THE CONTROL OF COMPLEX DOUBLE
EMULSIONS THROUGH REACTIVE
INTERFACES
by
Cassandra A. Zentner
B.A. Chemistry with Honors
Oberlin College, 2013
Submitted to the Department of Chemistry
in partial fulfillment of the requirement for the degree of
DOCTOR OF PHILOSOPHY IN CHEMISTRY
at the
Massachusetts Institute of Technology
September 2020
© 2020 Massachusetts Institute of Technology. All rights reserved.
Signature of Author:
Department of Chemistry
July 30, 2020
Certified by:
Timothy M. Swager
John D. MacArthur Professor of Chemistry
Thesis Supervisor
Accepted by:
Adam Willard
Associate Professor of Chemistry
Graduate Officer
-2-
This doctoral thesis has been examined by a
committee of the Department of Chemistry as follows:
Prof. Jeremiah A. Johnson:
Professor of Chemistry
Thesis Committee Chairman
Prof. Timothy M. Swager:
John D. MacArthur Professor of Chemistry
Thesis Supervisor
Prof. Mathias Kolle:
Rockwell Career Development Professor of Mechanical Engineering
Thesis Committee Member
-3-
Dedicated to my family and the one I found along the way
-5-
THE CONTROL OF COMPLEX DOUBLE EMULSIONS
THROUGH REACTIVE INTERFACES
by
Cassandra A. Zentner
Submitted to the Department of Chemistry
on August 7, 2020 in Partial Fulfillment of the
Requirement for the Degree of
Doctor of Philosophy in Chemistry
ABSTRACT
This thesis summarizes the use of interfacial reactions, responsive surfactants, and specific tuning of interfacial tensions to discover novel ways to manufacture and manipulate dynamic double emulsion systems.
In Chapter 1, we introduce emulsions and surfactants. We describe the fabrication of emulsions and creating stimuli responsive systems. Finally, we explore the relatively recent research into dynamic double emulsions, which is explored further in this thesis.
In Chapter 2, we demonstrate the use of selective, interfacial imine formation at emulsion interfaces for the in situ formation of surfactants for novel manufacturing of emulsions and biosensors, dynamic morphology changes through perturbing imine equilibria, and the destruction of emulsions with imine formation at the emulsion-solid interface.
In Chapter 3, we introduce surfactants that localize at the internal interface of double emulsions, which enables the incorporation of liquid crystals into dynamically reconfigurable complex emulsions. Further, we demonstrate that isomerization of a photo-responsive azobenzene surfactant at the internal interface of liquid crystal double emulsions results in reversible morphology change. In addition, isomerization of the azobenzene internal surfactant results in overall droplet movement, both orientational and translational.
In Chapter 4, we describe that interfacial confinement of magnetic nanoparticles to emulsions interfaces, accomplished through interfacial imine formation, imparts ferromagnetic behavior to dynamic double emulsion comprising isotropic solvents. Further, we demonstrate liquid crystal double emulsions enable precise assembly of magnetic nanoparticles at the emulsion interface and can produce droplets movement and reorganization of the director field.
In Chapter 5, we synthesize nucleophile-responsive surfactants with Michael acceptor functionalities to create responsive single and double emulsions. We demonstrate the emulsion systems are responsive to both small nucleophiles and polymeric nanoassemblies. Further, we describe the use of an unrelated stimuli, light, to trigger a cascade that results in emulsion responses.
Thesis Supervisor: Timothy M. Swager
-7-
Acknowledgments
First and foremost, I would like to thank Prof. Tim Swager. Tim has always given me the space to explore and learn, but was there in support when I needed guidance. Tim’s constant enthusiasm and immense creativity have greatly impacted my experience at MIT and helped me grow into a better scientist by example. I am very fortunate to have Tim as a mentor, allowing me to stay involved in entrepreneurship and setting me up for my jump back into industry. Thank you, Tim, for everything you have done for me. I am also grateful for the support of my Thesis Committee Chair, Prof. Jeremiah Johnson. I am thankful for his insights and support during our meetings. I would also like to thank Prof. Mathias Kolle, not only for his role on my committee, but for his constant, interesting perspective in our group’s colloids work.
While in the group and at QDVision, I relied on Brian Pretti to accomplish my research, my group jobs, and for general sanity checks. Thank you, Brian, for being there for me over the last seven years, it has been an absolute pleasure. A thank you as well to Kathy Sweeny, Rachael Fuller, and Emily Wensberg for doing all the behind the scenes work necessary to keep the group running.
I was also very fortunate to have worked with a great group of collaborators. Dr. Alberto Concellón was the best collaborator someone could ask for - a fantastic source of immense knowledge, a great lab role model, and an enthusiastic researcher. Our collaborations were pushed to greater heights because of his knowledge and steady support. Thank you, Alberto. To the Colloids Subgroup, it was a pleasure having the opportunity to lead such an amazing group of innovative, collaborative scientists. Thank you for all the great discussions over the years. Finally, thank you to my Center for Autonomous Chemistry colleagues for a constant stream of new ideas and specifically to my close collaborators: Ann Fernandez, Manisha Shivrayan, Emil Samson, and Francesca Anson.
I have been blessed with the wonderful support of mentors, group members, and friends during my time in the Swager Group. First, I would like to thank Dr. Sarah Luppino, for welcoming me to the lab and for her support during my first year in the group. Dr. Suchol Savagatrup was my first group mentor and taught me everything I needed to know about droplets to get my project started. His support throughout his time at MIT and since, from looking over paper drafts to project advice, has been instrumental to my successes. Thank you, Suchol. I would like to thank Dr. Nate Romero for pushing me to be a better writer and scientist. His willingness to help me think through problems in lab, his patience looking over my shoulder while I attempted organic synthesis, and his honest feedback on my drafts are all greatly appreciated. Sam Etkind is a constant source of organic knowledge, a shining example of work ethic, and just an exceptionally kind, thoughtful person – thank you for always being there. I want to thank Jessica Beard for her never-ending support, kindness, and for knocking some sense into me when I was trying to do too much. This thesis also would not be possible without the small army of group members who helped read over drafts. An immense thank you to Sam Etkind, Dr. Nate Romero, Dr. Suchol Savagatrup, Jessica Beard, Dr. Alberto Concellón, Zach Nelson, Dr. Ben McDonald, Dr. Máté Bezdek, Mason Wu, and Dr. Julia Zhao. Over the past four years, I have met so many brilliant colleagues in the Swager Group. Thank you to everyone who shaped a wonderful experience in the group.
My MIT experience was further shaped by the support of friends and mentors outside of the group. I cannot express how happy I am that WIC matched Dr. Julia Zhao and I in the mentorship program. We may joke that we don’t know who actually mentored who, but all I can say is her constant support, advice, and friendship kept me going and I will miss our basement walks. Thank you to Katie McGeough for looking at a somewhat anti-social person during orientation and going “yeah, I want to be her friend.” I wouldn’t have gotten through our first year, orals, or graduate school without her. I am so thankful for her friendship. My experience at MIT was truly enriched by WIC and it was an honor to serve on the exec board for the past three years.
Outside of the chemistry world, I have to thank many people for their friendship and support. To the Boston Obies (and honorary Obies) who made sure I felt at home: Danica, Brendan, Ksenia, Matt, Ari, Michael, Brady, Meg, Steven, and Danny. Thanks to Brady for emotional support, movie and wine nights, and really, for everything else. I am the luckiest person to have her in my life. Thanks to Michael, who I
-8-
am grateful for his humor and friendship over the past eleven years. Thank you to all the friends I’ve met in Boston – Aaron, Mike, Kamal, Ty, Gill, and Cooper – for making me take a break for games and outings. Thank you to my former colleagues at QDVision and C2Sense, it was a pleasure to work with them all.
Finally, a heartfelt thank you to Dr. Jan Schnorr, for showing me how to be a great leader, for his friendship, and his never-ending, greatly appreciated advice.
Completing graduate school would not have been possible without my family. Thank you to Daddy, Jan, Thomas, and Zachary for being a break from school and for the support from afar. Thank you to Christopher for his always calming responses to my stress. Thank you to Danielle for attempting to make sure I take better care of myself. I am absolutely blessed to be an Aunt to Eileen and Rona and thank you for the video calls, laughs, and occasional German lessons. Thanks to Tracey, Rick, Sarah, and Andy for welcoming me into the Frattesi family and making me feel instantly at home. I couldn’t have done any of this without my Mom. Saying thank you doesn’t cover it nearly enough - I love you, Mommy.
And to Timmy – you have been there for me through all the highs and lows for the past seven years. You have been a steady presence, making sure I had food, wine, and love through it all. Thank you for your attempts to make me take a break, for the board games, for the introduction to D&D, for all our trips, and for everything. I think it would take up a whole page to thank you for everything you do for me, so instead I’ll say that I am lucky to have met you, lucky to have you by my side during this journey, and even luckier to be marrying you. I love you.
-9-
Respective Contributions
Chapter 1This chapter was written by the author.
Chapter 2
This chapter was a collaborative effort between the author and Francesca Anson. Francesca Anson provided protein samples and performed initial enzymatic activity studies. The author carried out all other studies and wrote the manuscript.
Chapter 3
This chapter was a collaborative effort between the author and Dr. Alberto Concellón. The author synthesized and characterized the azobenzene surfactant, performed all studies in double emulsions comprising isotropic solvents, and measured the interfacial tensions. Dr. Alberto Concellón developed and led the liquid crystal emulsion studies. Dr. Alberto Concellón and the author contributed to the writing of the manuscript.
Chapter 4
This chapter was a collaborative effort between the author and Dr. Alberto Concellón. Dr. Alberto Concellón led efforts on liquid crystal double emulsions. The author synthesized and characterized the magnetic nanoparticles and carried out the work on emulsions comprising isotropic solvents. Dr. Alberto Concellón and the author contributed equally to the writing of the manuscript.
Chapter 5
This chapter was a collaborative effort between the author, Ann Fernandez, Manisha Shivrayan, Emil Samson, Prof. Suchol Savagatrup, and Dr. Jiaming Zhuang. The project was led by Ann Fernandez and the author. Ann Fernandez performed all single emulsion studies. The author performed all double emulsion studies. Manisha Shivrayan designed and synthesized the polymeric self-assemblies and performed the surfactant synthesis. Emil Samson contributed to the initial surfactant design and preliminary synthesis. Prof. Suchol Savagatrup designed and fabricated the PDMS microfluidic device. Dr. Jiaming Zhuang provided intellectual input for the surfactant design. Ann Fernandez and the author contributed equally to the writing of the manuscript.
-11-
Table of Contents
Title page ... 1 Signature page ... 2 Dedication ... 3 Abstract ... 5 Acknowledgments ... 7 Respective Contributions ... 9 Table of Contents ... 11 List of Figures ... 14 List of Schemes ... 24 List of Tables ... 24 List of Equations ... 241. Introduction – Responsive Emulsion Systems ... 25
1.1 Emulsions and Stabilizers ... 25
1.2 Fabrication of Emulsions ... 29
1.2.1 Conventional Emulsification Methods ... 30
1.2.2 Membrane Emulsification ... 30
1.2.3 Microfluidic Emulsification ... 32
1.2.4 Phase Separation Emulsification ... 33
1.3 Stimuli Responsive Stabilizers and Emulsions ... 35
1.3.1 pH ... 35
1.3.2 Light ... 36
1.3.3 Magnetic Field ... 38
1.4 Dynamic Complex Emulsions ... 40
2. Dynamic Imine Chemistry at Complex Double Emulsion Interfaces ... 46
2.1 Abstract ... 46
2.2 Introduction ... 46
2.3 Results and Discussion ... 48
2.3.1 Phase Separation Emulsification and Dynamic Double Emulsions ... 48
2.3.2 In Situ Surfactant and Phase Separation Emulsification ... 48
2.3.3 Dynamic Nature at Liquid−Liquid Interface... 51
2.3.4 Bioconjugation at Liquid−Liquid Interface ... 53
2.3.5 Emulsion−Solid Interfacial Imine Formation ... 55
-12-
2.5 Experimental Methods ... 58
2.5.1 Materials and Characterization Techniques ... 58
2.5.2 Synthesis and Characterization ... 59
2.5.3 Experimental Methods – Model System: Techniques and Emulsion/Surfactant Analysis ... 60
2.5.4 Experimental Methods – Dynamic Equilibria in Model Imine Studies ... 71
2.5.5 Experimental Methods – Multivalent Amines ... 82
2.5.6 Experimental Methods – Biological Amine Substrates ... 84
2.5.7 Experimental Methods – Surface Functionalization and Wetting ... 90
2.6 Acknowledgments ... 93
3. Internal Structure Control in Complex Double Emulsions ... 95
3.1 Abstract ... 95
3.2 Introduction ... 95
3.3 Results and Discussion ... 97
3.3.1 Liquid Crystal/Fluorocarbon Double Emulsions ... 97
3.3.2 Stabilization of LC Double Emulsions via Internal Surfactant ... 98
3.3.3 Photo-control of LC Double Emulsions ... 102
3.3.4 Internal Surfactants in Hydrocarbon/Fluorocarbon Double Emulsions ... 106
3.4 Conclusions ... 109
3.5 Experimental Methods ... 110
3.5.1 Materials and Characterization Techniques ... 110
3.5.2 Synthesis and Characterization ... 111
3.5.3 Experimental Methods ... 112
3.5.4 Appendix - NMR Spectra ... 116
3.6 Acknowledgments ... 119
4. Controlled Movement of Complex Double Emulsions via Interfacially Confined Magnetic Nanoparticles ... 121
4.1 Abstract ... 121
4.2 Introduction ... 121
4.3 Results and Discussion ... 123
4.3.1 Synthesis and Functionalization of Magnetic Nanoparticles ... 123
4.3.2 Interfacial Attachment in Hydrocarbon/Fluorocarbon Double Emulsions ... 123
4.3.3 Interfacial Attachment in Liquid Crystal/Fluorocarbon Double Emulsions ... 128
4.4 Conclusion ... 131
-13-
4.5.1 Materials and Characterization Techniques ... 132
4.5.2 Synthesis and Characterization ... 135
4.5.3 Experimental Methods ... 136
4.5.4 Appendix – Nanoparticle Characterization ... 141
4.6 Acknowledgments ... 145
5. Programmable Emulsions via Nucleophile-Induced Covalent Surfactant Modifications... 147
5.1 Abstract ... 147
5.2 Introduction ... 147
5.3 Results and Discussion ... 148
5.3.1 Surfactants and Emulsion System Design ... 148
5.3.2 Small-molecule Nucleophile Studies ... 150
5.3.3 Molecular Assembly Nucleophile Studies ... 153
5.3.4 Light-Triggered Cascade Studies ... 155
5.4 Conclusions ... 157
5.5 Experimental Methods ... 157
5.5.1 Materials and Characterization Techniques ... 157
5.5.2 Synthesis and Characterization ... 158
5.5.3 Experimental Methods ... 163
5.5.4 Appendix – NMR Spectra ... 179
5.6 Acknowledgments ... 195
-14-
List of Figures
Figure 1.1. Schematic representations of emulsion systems and configurations. ... 25 Figure 1.2. Surfactants as emulsifying agents. (a) Structure and alignment in an O/W single emulsion. (b)
Examples of ionic surfactants: sodium dodecyl sulfate (SDS), cetyl trimethylammonium bromide (CTAB), phospholipid, and nonionic surfactants: Tween 20, Zonyl-FS 300, Span 20... 27
Figure 1.3. The position of a solid particle (solid black circles) at the oil (or air)/water interface with θ <
90° (upper left), θ = 90° (upper middle), or θ > 90° (upper right). For θ < 90° and θ > 90°, O/W emulsions or W/O emulsions are formed, respectively. Reproduced from Ref. 27 Copyright 2002 with permission from Elsevier. ... 28
Figure 1.4. Schematic representation of instability mechanisms of emulsions. Reproduced from Ref. 30
Copyright 2017 with permission from Elsevier, under the Creative Commons Attribution-NonCommercial-No Derivatives License (CC BY NC ND). ... 29
Figure 1.5. Conventional fabrication of double emulsions. (a) Multiple emulsion examples. (b)
Conventional two-step method for fabrication multiple emulsions. Reproduced from Ref. 38 Copyright 2014 with permission from John Wiley and Sons. ... 30
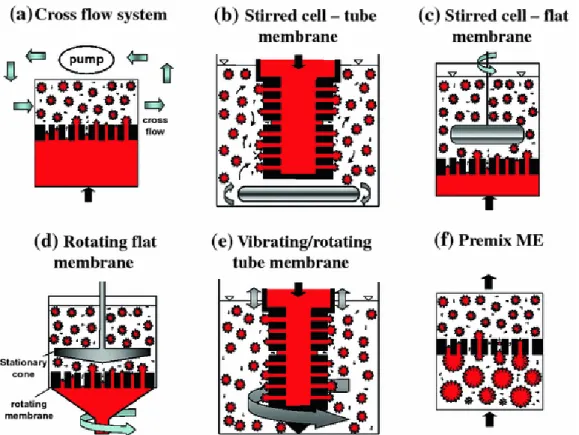
Figure 1.6. Various membrane emulsification devices. Reproduced from Ref. 36 Copyright 2012 with
permission from Springer Nature. ... 31
Figure 1.7. The second step of membrane emulsification of double emulsions, directly following the
generation of W/O emulsions in the first step. Reproduced from Ref. 45 Copyright 2003 with permission from Elsevier. ... 32
Figure 1.8. Microfluidic geometries for making single emulsions: (a) T-junction, (b) flow focusing, and (c)
co-flowing. Reproduced from Ref. 38 Copyright 2014 with permission from John Wiley and Sons. ... 33
Figure 1.9. Microfluidic device examples for fabrication of (a) double and (b) complex emulsions with
coaxial flow focusing. Scale bar = 200 µm. Adapted from Ref. 48 Copyright 2005 with permission from AAAS and Ref. 50 Copyright 2007 with permission from John Wiley and Sons. ... 33
Figure 1.10. Double emulsions formed by evaporation-induced phase separation. (a) Evolution of
evaporation of ethanol and the resulting phase separation. (b) Micrographs of the phase separation process. Scale bar = 40 µm. Reproduced from Ref. 53 Copyright 2016 with permission from the Royal Society of Chemistry. ... 34
Figure 1.11. Double emulsion formation by temperature-induced phase separation. (a) Emulsification
process of hydrocarbon and fluorocarbon double emulsions dispersed in water. Adapted from Ref. 55 Copyright 2015 with permission from Springer Nature. ... 34
Figure 1.12. pH-responsive surfactants. (a) Schematic illustration of the dynamic formation of surfactants
from hydrophilic and hydrophobic components. The formation of imine surfactant from a hydrophilic aldehyde and a hydrophobic amine creates a pH-responsive micelle. The reaction takes place in pH 11.8 phosphate buffer at 25 °C; Adapted from Ref. 70 Copyright 2009 with permission from the American Chemical Society. (b) pH-responsive ketal surfactants: commercially available PPS Silent Surfactant and the cleaving of ketal surfactant designed by Li et al.75 ... 36
Figure 1.13. Photo-responsive surfactants. (a) Isomerization of an azobenzene surfactant.84 (b)
Isomerization of a stilbene surfactant.87 (c) Conversion between merocyanine and spiro form of a spiropyran
surfactant.89 ... 37
Figure 1.14. Schematic of near-IR/visible light-controlled Pickering emulsions stabilized by spiropyran
functionalized particles. Reversible phase inversion is observed with near-IR and visible light excitation. Reproduced from Ref. 91 Copyright 2014 with permission from the American Chemical Society. ... 38
Figure 1.15. Schematic of polymer-coated magnetic nanoparticles for oil water separation. The particles
align at the interface to generate magneto-responsive Pickering emulsions, which in turn are attracted to a magnet and separated. Reproduced from Ref. 95 Copyright 2014 with permission from the American Chemical Society. ... 39
Figure 1.16. Magneto-responsive surfactants and emulsions. (a) Surfactant examples.108–110 (b)
-15-
stabilized emulsion to a magnet. Reproduced from Ref. 110 Copyright 2012 with permission from the Royal Society of Chemistry. ... 40
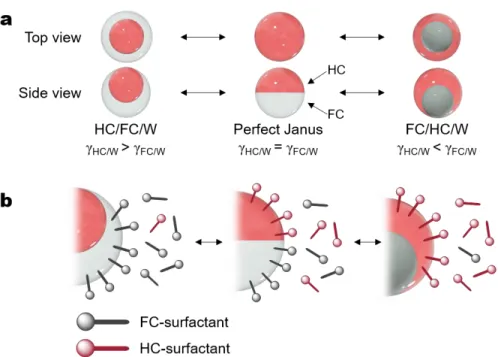
Figure 1.17. Dynamic double emulsions. (a) Top and side view images of the morphological changes of
HC (red) and FC (white) with adjustments in interfacial tension balances. (b) Tuning of the interfacial tension balance with changes in concentrations of FC- and HC-surfactants. ... 41
Figure 1.18. Dynamic double emulsions as micro-lenses. (a) Geometry of double emulsions comprising
HC and FC oils. The internal interface curvature Ri is determined by the morphology. (b) The double
emulsions can focus or diverge light depending on morphology. (c) Side view micrographs of double emulsions (HC oil dyed with Sudan Red 7B) with different morphologies and (d) the corresponding propagation of light through the droplets. Reproduced from Ref. 112 Copyright 2017 with permission from Springer Nature under the Creative Commons CC BY license. ... 42
Figure 1.19. Total internal reflection (TIR) in dynamic double emulsions. (a) Intensity distribution around
the droplet determined by computational 2D raytracing to study the output of light for varying morphologies, with high intensity of the HC-FC-W three-phase junction. (b) Computationally determined emission intensity as a function of angle measured from the droplets’ symmetry axis by full 3D raytracing. Arrows indicate the TIR light out-coupled at the three-phase junction. (c) Side-view depiction of TIR (middle), with corresponding fluorescence side-view (left) and top-view (right) of an emissive emulsion, showing the higher light intensity at the three-phase junction line. (d) Scheme for detection of Salmonella. Scale bar = 50 µm. Adapted from Ref. 114 Copyright 2019 with permission from the American Chemical Society. ... 43
Figure 1.20. ConA and E. coli responsive emulsions. (a) Side-view depiction of responsive emulsion
stabilized by mannose-surfactant (ManC14) and FC-surfactant (Zonyl). (b,c) Schematic of (b) the multivalent binding of ConA and ManC14 and (c) agglutination of Janus emulsions with ConA addition. (d) Optical micrographs of and QR code measurement of optically clear perfect Janus emulsions (left) and light scattering agglutinated emulsions with addition of ConA (right). Scale bar = 100 µm. Adapted from Ref. 116 Copyright 2017 with permission from the American Chemical Society. ... 44
Figure 2.1. Interfacial imine formation scheme. (a) Non-amphiphilic amine/protein and aldehyde reagents
in separate immiscible phases to form an imine surfactant through interfacial formation during emulsification. (b) By lowering the pH of the system or through imine exchange, the amphiphilic properties of the imine surfactant are lost causing changes in morphology or emulsion stability. (c) Amine-functionalized surface and aldehyde reagent in an emulsion react to form an imine-Amine-functionalized surface and triggered payload release. ... 47
Figure 2.2. Dynamic double emulsions. (a) Morphological changes of dynamic double emulsions of HC
(red) and FC (white) with adjustments in γ balance. Top and side view images of the droplets at each morphology are shown. Typical FC solvents used are denser than the HC solvent; thus, phases align with gravity. (b) Example of commercially available HC and FC-surfactants. ... 48
Figure 2.3. In situ formation of imine surfactants and double emulsions. The aldehyde, selectively soluble
in HC or FC, is dissolved in the dispersed phases. HC and FC are heated above miscibility and are added to an amine-enriched continuous phase. Interfacial surfactant formation via imine condensation promotes single-step emulsification. ... 49
Figure 2.4. Interfacial imine formation scope and results. (a) Overall interfacial imine formation reaction.
(b) FC-surfactant 6 derived from FC-soluble reagents 1 or 2. Top view images of HC/FC/W morphology emulsions stabilized by FC-surfactant 6. (c) Proposed imine formation at HC/W interface, with HC-soluble reagent 3, but no stable emulsion droplets were obtained. (d) HC-surfactant 8 derived from HC-soluble reagent 4. Top view images of FC/HC/W morphology emulsions stabilized by HC-surfactant 8, with top and side view morphology depictions. Black, FC-soluble reagent; red, HC-soluble reagents; blue, water-soluble reagents. Scale bar = 100 μm... 50
Figure 2.5. Pendant drop analysis of imine formation. 200 mM solutions of substrates 1−4 in HFE-7500
-16-
was successful only for substrates that display some surface activity (1, 2, and 4), reducing interfacial tension in water. ... 51
Figure 2.6. Imine exchange studies in emulsion droplets. (a) Toluene/HFE-7500 and FC-43 (9:1) droplets
stabilized by imine surfactant 8 and Zonyl. Morphology changes from FC/HC/W to HC/FC/W with imine exchange and the transformation of imine surfactant 8 to non-amphiphilic imine 10. (b) Diethylbenzene/HFE-7500 droplets stabilized by imine surfactant 6 and Tween 20. With imine exchange, coalescence and the appearance of microdroplets was observed. Scale bar = 100 μm. ... 53
Figure 2.7. In situ generation of FC-surfactants with proteins. (a) FC-surfactant generated with
anti-β-actin-FITC and hydrate 2, expected emulsion morphology, confocal image (left), and optical image (right) of non-spherical behavior. Red arrow highlights the string of droplets created by interactions between the antibodies. (b) FC-surfactants with hydrate 2 and either anti-β-actin-FITC or amine 5, which stabilize the emulsion interface, expected morphology, confocal image (left), and optical image (right). (c) Agglutination of salmonella antibody-functionalized emulsions in response to 108 HKST cells/mL.
Macroscopically, the droplets changed from transparent to opaque, rendering a QR code unreadable upon agglutination. (d) FC-surfactant generated with Protein A and hydrate 2, the resulting morphology, and optical image. (e) Confocal image of Protein A conjugated emulsion tagged with IgG-FITC antibody. (f) 3D side view image of selective Protein A attachment in a Janus emulsion stabilized by Protein A surfactant and Tween 20. Scale bar = 100 μm. ... 55
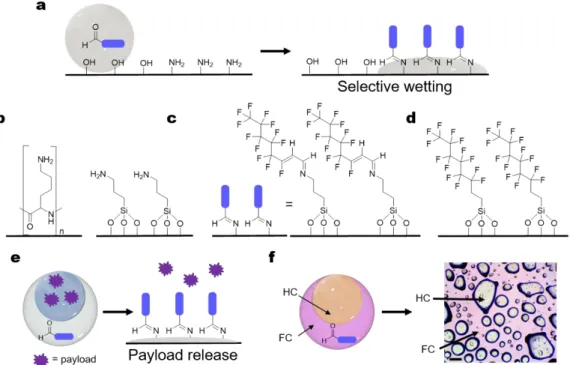
Figure 2.8. Imine-formation induced selective wetting. (a) Selective wetting on amine-functionalized
surface through imine formation in single emulsions. (b) Amine-functionalized substrates: polylysine (left) and APTMS surfaces (right). (c) APTMS surface after reactive wetting with hydrate 2. (d) (Tridecafluoro-1,1,2,2-tetrahydrooctyl)trichlorosilane-functionalized glass surface. (e) Scheme of double emulsion payload release. (f) Hydrate 2-enriched diethylbezene/HFE-7500 double emulsion bursting on an APTMS surface. ... 57
Figure 2.9. Representative carbonyl substrates for in situ emulsification... 60 Figure 2.10. Scheme for reaction between reagents 1-4 and mPEG3-NH2 in THF-d8 at room temperature
for 30 min, unless noted otherwise. ... 61
Figure 2.11. 1H NMR spectrum (600 MHz, THF-d
8) after reaction between aldehyde 1 and mPEG3-NH2 to
form imine 6b. ... 62
Figure 2.12. Splitting and J-value analysis of the α,β-unsaturated imine product 6b. ... 62 Figure 2.13. 1H NMR spectra (600 MHz, THF-d
8) after reaction between hydrate 2 and mPEG3-NH2. Red
trace (1) – hydrate 2, blue trace (2) – imine product 6b. ... 63
Figure 2.14. 1H NMR spectra (600 MHz, THF-d
8) after reaction between aldehyde 3 and mPEG3-NH2. Red
trace (1)– aldehyde 3, blue trace (2) – imine product 7b. ... 64
Figure 2.15. 1H NMR spectrum (600 MHz, THF-d
8) after 24 h for the reaction between benzaldehyde 4
and mPEG3-NH2. ... 65
Figure 2.16. 1H NMR spectrum (600 MHz, CD
2Cl2) of isolated surfactant 8, with minimal hydrolysis back
to benzaldehyde 4 after column chromatography. ... 67
Figure 2.17. Proposed mechanisms for imine formation with aldehyde 1. Highlighted in blue is the
reversible imine bond formation between α,β-unsaturated aldehyde and α,β-unsaturated imine. ... 68
Figure 2.18. 1H NMR spectrum (600 MHz, THF-d
8) of mechanistic study, highlighting the downfield peaks
of the structures. ... 68
Figure 2.19. 1H NMR (600 MHz) analysis of the hydrolysis of imine 6b (1) in THF-d
8 after adding 10 µL
water (2) or 1 M HCl (3) after 1 h... 69
Figure 2.20. 19F NMR spectrum (376 MHz, D
2O) for interfacial reaction between hydrate 2 in HFE-7500
and mPEG3-NH2 in D2O. ... 70
Figure 2.21. Pendant drop data for pH study of imine formation between hydrate 2 and amine 5. ... 72 Figure 2.22. Pendant drop data for pH study of imine formation between benzaldehyde 4 and amine 5.. 72 Figure 2.23. Equilibrium of each aldehyde with its corresponding imine. ... 73 Figure 2.24. Morphology changes with added acid with imine surfactant 8 and Zonyl-stabilized double
-17-
Figure 2.25. Small morphology changes observed with added acid after 1 min with imine surfactant 6 and
Tween 20 stabilized double emulsions. Scale bar = 100 μm. ... 74
Figure 2.26. Bursting of surfactant 8 stabilized droplets after acid addition. Scale bar = 100 µm. ... 75 Figure 2.27. Coalescence of surfactant 6 stabilized droplets after acid addition. Scale bar = 100 µm. ... 75 Figure 2.28. 1H NMR spectra (600 MHz, THF-d
8) of imine exchange in imine 8b. ... 76
Figure 2.29. 1H NMR spectra (600 MHz, THF-d
8) of imine exchange in imine 6b. ... 77
Figure 2.30. Imine exchange studies in emulsion droplets. (a) Toluene/HFE-7500&FC-43 (9:1) droplets
stabilized by imine surfactant 8 and Zonyl. Morphology changes from FC/HC/W to HC/FC/W with imine exchange and the transformation of imine surfactant 8 to non-ampliphilic imine 10. (b) Control tests with toluene/HFE-7500&FC-43 (9:1) droplets with 200 mM benzaldehyde 4 stabilized by Tween 20 and Zonyl. Minimal changes in morphology were observed with addition of propylamine. (c) Diethylbenzene/HFE-7500 droplets stabilized by imine surfactant 6 and Tween 20. With imine exchange, coalescence and the appearance of microdroplets was observed. (d) Diethylbenzene/HFE-7500 droplets with 200 mM hydrate
2, stabilized by Tween 20 and Zonyl exhibited some coalescence and microdroplet appearance with
propylamine addition. (e) Control studies with diethylbenzene/HFE-7500 (no hydrate 2) exhibited no changes in morphology, coalescence, and minimal microdroplet formation with propylamine addition. Scale bar = 100 μm. ... 79
Figure 2.31. 1H NMR spectra (600 MHz, THF-d
8) of hydrate 2 (1), ethanethiol (2), hydrate 2 mixed with
ethanethiol (3), ethanol (4), and hydrate 2 mixed with ethanol (5) after 30 min. ... 80
Figure 2.32. 1H NMR spectrum (600 MHz, THF-d
8) of imine 6b mixed with ethanol. ... 81
Figure 2.33. 1H NMR spectrum (600 MHz, THF-d
8) of imine 6b mixed with ethanethiol. ... 81
Figure 2.34. No changes in morphology observed with the addition of ethanethiol or ethanol to the system.
(a) Imine 6 and Tween 20 stabilized diethylbenzene/HFE-7500 emulsions. (b) Zonyl and Tween 20 stabilized droplets of 200 mM hydrate 2 in diethylbenzene/HFE-7500. Scale bar = 100 µm. ... 82
Figure 2.35. Multivalent amine substrates. ... 82 Figure 2.36. (a) HC/FC/W emulsions (diethylbenzene/HFE-7500) stabilized by surfactant resulting from
interfacial reaction of PEG diamine 18 and hydrate 2. (b) Cross-linked droplet film generated by amine 19 and hydrate 2 (diethylbenzene/HFE-7500). ... 83
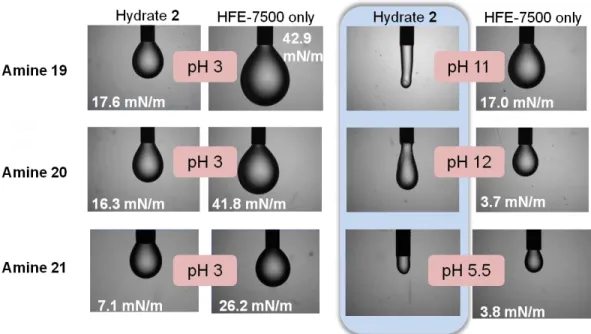
Figure 2.37. Pendant drop images, with 1 mM amine in continuous phase, and HFE-7500 or hydrate
2-enriched HFE-7500 (200 mM) and various pH. ... 84
Figure 2.38. (a) Scheme of interfacial imine formation between hydrate 2 and antibodies in the continuous
phase with expected HC/FC/W morphology. Non-spherical droplets and phase separation issues were, instead, observed. The red arrow highlights the string of droplets created by interactions between the antibodies. (b) Scheme of interfacial imine formation between hydrate 2 and antibodies/amine 5 in the continuous phase, with resulting HC/FC/W morphology. (c) Scheme of interfacial imine formation between hydrate 2 and antibodies in the presence of Tween 20 as a co-surfactant during emulsification, with the resulting Janus morphology. Laser power was set to 10% for all confocal images. Scale bar = 100 μm... 85
Figure 2.39. On/off reading due to the agglutination of the droplet in the presence of HKST. ... 86 Figure 2.40. (a) Agglomeration of droplets generated by GFP. (b) Film of droplets generated by in situ
reaction of hydrate 2 and asparaginase. ... 88
Figure 2.41. UV-vis absorbance at 405 nm after hCAII catalyzed hydrolysis of NPA in 10 mM HEPES
buffer. ... 90
Figure 2.42. Single emulsion wetting studies. HFE-7500 single emulsions show no bursting on (a) glass
slide or (b) APTMS-functionalized glass. (c) 200 mM hydrate 2 in HFE-7500 single emulsions show no bursting on a glass slide. (d) 200 mM hydrate 2 in HFE-7500 single emulsions display instant wetting on APTMS-functionalized glass. ... 91
Figure 2.43. Double emulsion wetting study controls. Diethylbenzene/HFE-7500 double emulsions
(HC/FC/W) show no bursting on (a) glass slides or (b) APTMS-functionalized glass. (c) 200 mM hydrate
-18-
Figure 3.1. Morphologies of double emulsions. (a) Varying intrinsic internal interfacial surface area.
Highlighted is an example of a droplet with an Enneper surface. (b) Increase in surface area with addition of internal surfactants, depicted with a black and red structure. ... 96
Figure 3.2. Characterization of the Janus “snowman-shaped” LC/FC double emulsions. (a) Side-view
microscope images and γLC/FC interfacial tension by varying the fluorocarbon phase. (b) Schematic
representation of interfacial tensions of a Janus droplet. (c) Confocal microscopy images (inset: side-view 3D visualization of the LC compartment). (d) Polarized-light optical microscopy images without (left) and with (right) crossed polarizers. (e) Schematic representation of radial alignment. ... 98
Figure 3.3. LC/FC interface internal surfactant. (a) Chemical structure of a LC/FC internal surfactants,
CB-RF and AZO-RF. (b) Side-view microscope images varying CB-RF concentration and the corresponding
sketch of the interfacial tensions (the blue and red lines represent the direction of the three interfacial tensions while their lengths are arbitrary; all droplets were prepared in a 0.1 wt% aqueous solution of Tween 20). (c) θFC vs. concentration of internal LC/FC-surfactant CB-RF (the values reported for θFC were averaged
of at least 5 independent measurements; a 0.1 wt% aqueous solution of Tween 20 was used as the continuous phase). (d) CB-RF solubility in 5CB and HFE-7200: Mixture of CB-RF (2.5 wt%) in I) 5CB, II)
5CB after addition of 7200, III) 5CB and 7200 using DCM as co-solvent, and IV) 5CB and HFE-7200 after DCM evaporation. (e) Snapshots showing the evolution of a droplet with dissolving and partitioning of surfactant. Deformation at the interface in initial and 20 s images is due to surfactant particulates before partitioning and alignment at the LC/FC interface. (f) Interfacial tension measurements of 5CB in HFE-7200, in the presence of 0.5 wt% CB-RF and AZO-RF in 5CB. ... 100
Figure 3.4. Complex emulsions with a radial alignment of the LC molecules: polarized-light optical
microscopy images without (left) and with (right) crossed polarizers of 5CB/HFE-7200 droplets that reconfigure in response to variation in the mass ratio of hydrocarbon and fluorocarbon surfactants (fZonyl):
(a) FC/LC/W double emulsions (fZonyl = 0−0.15), (b) spherical Janus droplets (fZonyl = 0.20−0.35), and (c)
LC/FC/W double emulsions (fZonyl = 0.4−1). ... 102
Figure 3.5. Photo-responsive LC/FC double emulsions. (a) Isomerization of AZO-RF. (b) Schematic
representation of Janus droplets containing AZO-RF in which UV irradiation results in a disorder of the
nematic LC phase. (c) Polarized-light optical microscopy images of the photo-induced phase transition from nematic to isotropic upon irradiation at 365 nm, and subsequent phase transition from isotropic to nematic upon 450 nm irradiation (inset: corresponding side-view images). ... 103
Figure 3.6. Movement of 5CB/HFE-7200 double emulsions enriched with 2.5 wt% AZO-RF. (a) Side-view
images of the gravity aligned double emulsions that tilt during active isomerization with exposure to 365 nm light and return to gravity aligned state after complete isomerization. (b) Schematic of droplet movement during isomerization (AZO-RF not shown). ... 104
Figure 3.7. Movement of 5CB/HFE-7300 double emulsions enriched with 2.5 wt% AZO-RF. (a) Side-view
images of the gravity aligned double emulsions that rotate during active isomerization with exposure to 365 nm light and return to gravity aligned state after complete isomerization. Emulsions rotate in all directions during isomerization. (b) Schematic of droplet movement during isomerization (AZO-RF and changes in
LC alignment are not shown). (c) Deformation of the LC/FC interface during isomerization. ... 105
Figure 3.8. Movement of 5CB/HFE-7500 double emulsions enriched with 2.5 wt% AZO-RF. Side-view
images of the gravity aligned double emulsions that rotate during active isomerization with exposure to 365 nm light and return to gravity aligned state after complete isomerization. Deformation of the LC/FC interface was observed during isomerization. ... 106
Figure 3.9. Photo-responsive azobenzene surfactant AZO-RF in HC/FC double emulsions. (a) Schematic
of the potential increase in internal interfacial area with AZO-RF alignment. (b) Schematics of AZO-RF
isomerization potentially tuning internal interfacial surface area. ... 107
Figure 3.10. o-DCB/HFE-7200 double emulsions. (a) Control-emulsions with perfect Janus morphology.
(b,c) Double emulsions enriched with 2.9 wt% (50 mM) AZO-RF (b) before and (c) after excitation with
365 nm light. No changes in morphology or internal interface structure were observed with the addition of AZO-RF or with isomerization. o-DCB and HFE-7200 have similar densities, therefore emulsion droplets
-19-
Figure 3.11. Rolling and movement of 1.2 wt% (20 mM) AZO-RF-enriched o-DCB/HFE-7200 double
emulsions with active excitation under 365 nm light. Droplet movement is tracked by reflected light (highlighted by the arrow and yellow dot) as the droplets roll and move. Droplets are illuminated only by the LED, no other light sources were used. ... 109
Figure 3.12. Polarized-light optical microscopy images without (left) and with (right) crossed polarizers of
LC complex droplets prepared by bulk emulsification. ... 113
Figure 3.13. LC ordering at the LC/FC interface. (a) Polarized-light side-view images of snowman Janus
droplets with radial alignment, wherein the mesogens align perpendicular to the LC/W and LC/FC interfaces. (b) Polarized-light optical images of 5CB single emulsions in HFE-7200 showing the small influence of LC/FC-surfactants on the radial LC organization (i: 5CB dispersed in pure HFE-7200, ii: 5CB dispersed in a 1 wt% HFE-7200 solution of CB-RF). ... 114
Figure 3.14. Study of the isomerization of AZO-RF with (a) exposure to 365 nm UV light and (b) relaxation
induced by 450 nm blue light or (c) visible light. ... 115
Figure 3.15. 1H NMR spectrum (400 MHz, CDCl 3) of CB-RF. ... 116 Figure 3.16. 13C NMR spectrum (100 MHz, CDCl 3) of CB-RF. ... 117 Figure 3.17. 19F NMR spectrum (376 MHz, CDCl 3) of CB-RF. ... 117
Figure 3.18. 1H NMR spectrum (600 MHz, Acetone-d
6) of AZO-RF. ... 118
Figure 3.19. 13C NMR spectrum (150 MHz, Acetone-d
6) of AZO-RF. ... 118
Figure 3.20. 19F NMR spectrum (376 MHz, Acetone-d
6) of AZO-RF. ... 119
Figure 4.1. (a) Interfacial imine formation between amine-functionalized magnetic nanoparticles
(MNP-NH2) and oil soluble aldehydes along the oil/water interface. (b) Dynamic double emulsions decorated with
magnetic nanoparticles and the retrosynthetic representation of the reaction of the MNP-NH2 with the
oil-soluble aldehyde or aldehyde hydrate. As studied in Chapter 2, the reaction between hydrate 1 and amines is expected to result in α,β-unsaturated imine (Figure 2.11-2.13 and Section 2.5.3.7). ... 122
Figure 4.2. Incomplete phase separation was observed with MNP-NH2 attachment in water, in the absence
of surfactants. (a) Top-view with highlighted areas of incomplete phase separation and (b) side-view of HC/FC/W double emulsions. ... 124
Figure 4.3. Magnetic response of MNP-NH2 confined to the FC/W interface in HC/FC double emulsions
with (a) HC/FC/W or (b) Janus morphology: (i) side-view schematic and image, (ii) top-view optical images before exposure to magnetic field, (iii) response to magnetic field, (iv) response to inversion of magnetic field, (v) schematic representation of Janus emulsion orientation change. ... 124
Figure 4.4. Chains of double emulsions are broken up with quick, repeated inversion of magnetic field.
... 125
Figure 4.5. Magnetization curve of free MNP-NH2, as well as confined MNP-NH2 in HC/FC/W and Janus
double emulsions. (a) Schematic of materials studied. (b) Magnetization curve, inset – hysteresis. ... 127
Figure 4.6. Magnetic response of MNP-NH2-functionalized LC double emulsions with radial
organizations: (i) side-view microscopy images, (ii) confocal microscopy images, (iii) polarized light optical microscopy images, (iv) schematic representations. ... 129
Figure 4.7. Magnetic response of MNP-NH2-functionalized LC double emulsions with monopolar
organizations at (a,b) 25°C (with and without cross polarizers, respectively) and (c) 40°C: (i) side-view microscopy images, (ii) confocal microscopy images, (iii) polarized light optical microscopy images, (iv) schematic representations. ... 130
Figure 4.8. Magnetic response of MNP-NH2-functionalized LC single droplets with (a) radial and (b)
bipolar organizations: (i) side-view microscopy images, (ii) confocal microscopy images, (iii) polarized light optical microscopy images wherein the point singularity containing the MNP-NH2 is highlighted by a
blue arrow, (iv) schematic representations. ... 131
Figure 4.9. Mesogenic surfactants for the fabrication of stable LC/FC double emulsions.199
4-Cyano-4’-(3-perfluoro-octyl-propyl)biphenyl (CB-RF) and 4,4’-bis(tetra(ethylene glycol)monomethyl ether)biphenyl
-20-
Figure 4.10. Attachment of MNP-NH2 in the presence of 0.1 wt% Tween 20 during emulsification. (a)
Some phase separation and incomplete coverage at the FC/W interface was observed directly after emulsification. (b) After allowing for a longer reaction time with overnight mixing, better attachment was observed at the FC/W interface; however, non-specific attachment of MNP-NH2 at the HC/W interface (no
imine formation) was also observed. ... 137
Figure 4.11. Control studies for MNP and MNP-NH2 attachment without imine formation. (a) Instant coalescence was observed when attempting emulsification of hydrate 1 enriched HC/FC dispersed in 1 mg/mL MNP in water. The MNP preferentially attached to the HC/W interface, signifying minimal interaction between unfunctionalized MNP and hydrate 1. (b,c) No MNP-NH2 attachment was observed in the absence of hydrate 1 with 1 mg/mL MNP-NH2 in (b) 0.01 wt% Tween 20 or (c) 0.01 wt% Zonyl continuous phases. ... 138
Figure 4.12. Janus emulsions with MNP-RF dispersed in the FC in an unconfined state exhibited translational movement towards the magnet, but did not demonstrate the change in orientation shown with interfacially confined magnetic nanoparticles. ... 139
Figure 4.13. Aldehyde 2 was found to be nicely and readily soluble in the isotropic and nematic phase of 5CB. (a) POM texture of a solution of aldehyde 2 in 5CB (100 mM) with no evidence of phase separation. (b) DSC traces (Exo down, 10 °C/min) of 5CB with 0 mM and 100 mM of aldehyde 2. ... 140
Figure 4.14 Confocal microscopy images of the fluorescent labelling control experiments for LC single droplets with (a) radial and (b) monopolar organizations. ... 141
Figure 4.15. TGA measurements of MNP and MNP-NH2. ... 141
Figure 4.16. FTIR spectra of MNP and MNP-NH2. ... 142
Figure 4.17. TEM images of (a) MNP and (b) MNP-NH2. ... 142
Figure 4.18. DLS scans of (a) MNP and (b) MNP-NH2. (c) Summary of approximate diameters of nanoparticle aggregates. (d) Settling of MNP and MNP-NH2 particles in water overtime. ... 143
Figure 4.19. Magnetic measurements of MNP and MNP-NH2 dispersed in water. (a) Full loop and (b) zoomed in to show coercivity. ... 143
Figure 4.20. TGA measurements of MNP-RF. ... 144
Figure 4.21. FTIR spectrum of MNP-RF. ... 144
Figure 4.22. TEM images of MNP-RF. ... 144
Figure 4.23. (a) DLS scans of MNP-RF. (b) Summary of approximate diameters of nanoparticle aggregates. ... 145
Figure 4.24. Magnetic measurements of MNP-RF dispersed in HFE-7500. (a) Full loop and (b) zoomed in to show coercivity. ... 145
Figure 5.1. Design of reactive surfactants and emulsions. (a) Design of reactive amphiphilic HC-surfactants undergoing nucleophile-triggered cleavage. (b) Chemical structures of HC-surfactants in this work. (c) Bursting of single emulsions as the result of nucleophile (purple triangles) induced cleavage of charged hydrophilic head groups, thus reducing surfactant strength and destabilization of the HC/W interface. (d) Change in morphology of HC (red) and FC (blue) double emulsions from perfect Janus to HC-in-FC-in-water (HC/FC/W) in response to the decrease in mass fraction of reactive HC-surfactant (ʄHC) to the FC-surfactant (ʄFC) with the addition of a nucleophile and resulting HC-surfactant cleavage. Changes in morphology are tracked optically by observing the increase in size of the FC-ring. Nucleophile, surfactants, and emulsion sizes are not to scale. ... 149
Figure 5.2. Small-molecule nucleophile trigger studies. (a) PDMS microfluidic device for controlled analyte addition. (b) Schematic and optical microscopy images of single emulsions stabilized by TEA12, PYR12, and DMAP12 before and after addition of 1.1 equiv. EG2-SH: TEA12 droplets after 8 min, PYR12 and DMAP12 droplets after 15 min. (c) Top-view schematic and optical microscopy images of double emulsion morphology before and after 1.1 equiv. or 0.25 equiv. EG2-SH addition (1 min after addition). Scale bar = 50 µm. ... 151
-21-
Figure 5.3. Kinetic results. (a) Kinetics plots of TEA12, DMAP12 and PYR12 at various equivalents of
EG2-SH. (b) Zoomed in plot of TEA12 kinetic measurement results. ... 152
Figure 5.4. Amine-functionalized assembly studies. (a) Synthesis, self-assembly, and assembly size of
amine and acetamide end-functionalized amphiphilic polymer (Amine-P2 and Acetamide-P2, respectively). (b) Optical microscopy images of single emulsion bursting with the addition of Amine-P2 after 3 min. (c) Top-view optical microscopy images of the morphology changes observed with the addition of Amine-P2 to Janus double emulsions after 3 min. Amine-P2 assemblies are not visible in microscopy images. Scale bar = 50 µm. ... 154
Figure 5.5. Controlled on-demand triggered release and response. (a) Amphiphilic diblock copolymer
(PAP) with hydrophilic (orange) and hydrophobic (blue) units linked with an azobenzene unit (green). (b) PAP self-assembles into a vesicle (~200 nm in size) for UV-triggered release of HMDA (purple hexagon). (c) Schematic and optical microscopy images of single emulsion bursting after pre-release of HMDA. Images from left to right – initial, 2 min and 3 min after addition. (d-f) Top-view schematic and microscopy images of the morphology changes with in situ irradiation of PAP-HMDA with (e) 5 min of irradiation and (f) 10 total min of irradiation. PAP vesicles are not visible in microscopy images. PAP, HMDA, and emulsion size in schematic representations are not to scale. Scale bar = 50 µm. ... 156
Figure 5.6. Perfect Janus morphology for each reactive HC-surfactant with 0.2 wt% Zonyl and (a) 5 mM
TEA12, (b) 4 mM PYR12, or (c) 4 mM DMAP12. Scale bar = 50 μm. ... 164
Figure 5.7. CMC values of TEA12, PYR12, and DMAP12. ... 165 Figure 5.8. CAC values of Amine-P2 and Acetamide-P2... 165 Figure 5.9. PDMS microfluidic device setup. (a) Layering of PDMS components and glass slide base. (b)
Schematic of top and side view of droplet well. (c) Representation of water pathway in droplet well. For emulsions denser than water, droplet well orientated as shown above. For emulsions less dense than water, setup was inverted. (d) Full microfluidic device with T-junction and tubing. ... 167
Figure 5.10. EG2-SH equiv. study with Zonyl and HC-surfactants in the PDMS microfluidic testing device.
Final morphology and time required to reach the final morphology (blue box) are shown. 0.25-1.1 equiv. (1.25-5.5 mM for TEA12 and 1-4.4 mM for DMAP12 and PYR12) of EG2-SH was introduced to double
emulsions stabilized by TEA12/Zonyl, PYR12/Zonyl, and DMAP12/Zonyl. Scale bar = 50 μm. ... 168
Figure 5.11. Single emulsion stabilized by TEA12 after addition of 1.1 equiv. (5.5 mM) HMDA in the
PDMS microfluidic testing device. Bursting began within 3 min and continued over 12 min. Scale bar = 50 μm. ... 169
Figure 5.12. HMDA equiv. study with Zonyl and HC-surfactants in the PDMS microfluidic testing device.
Final morphology and time required to reach the final morphology (blue box) are shown. 1.1 equiv. (5.5 mM for TEA12 and 4.4 mM for DMAP12 and PYR12) HMDA was introduced to double emulsions stabilized by TEA12/Zonyl, PYR12/Zonyl, and DMAP12/Zonyl. Appreciable bursting of the TEA12/Zonyl double emulsions was also observed, with some bursting observed with PYR12/Zonyl. At lower equiv. HMDA (0.25 and 0.5 equiv.), bursting was only observed in the TEA12/Zonyl emulsions. Scale bar = 50 μm. ... 169
Figure 5.13. Validation of no-flow setup for single emulsions. TEA12-stabilized emulsions before and after
the addition of 1.1 equiv. (5.5 mM) (a) EG2-SH and (b) HMDA. Instant bursting was observed and
completed within 3 min for EG2-SH. Bursting was observed ~3 min after the addition of HMDA and
continued over the next 10 min. These results are consistent with the PDMS microfluidic testing device. Scale bar = 50 μm. ... 169
Figure 5.14. Validation of no-flow setup for double emulsions. TEA12/Zonyl-stabilized double emulsions
(a) initial perfect Janus morphology and the observed complete morphology change to HC/FC/W within 1 min after the addition of 1.1 equiv. (5.5 mM) (b) EG2-SH or (c) HMDA. These results are consistent with
the PDMS microfluidic testing device. Scale bar = 50 μm. ... 170
Figure 5.15. Low equiv. HDMA study in no-flow setup for single emulsions. TEA12-stabilized before and
after the addition of (a) 0.1 equiv. (0.5 mM), (b) 0.05 equiv. (0.25 mM), and (c) 0.025 equiv. (0.125 mM) HMDA. In all three cases, bursting was observed within 3 min of addition of HMDA and images were taken after 7 min. The rate of bursting was slower at lower amounts of HMDA. With 0.025 equiv., about
-22-
90% of droplets were intact after 15 min. As expected, there were fewer number of intact droplets (~ 70-80%) after the introduction of 0.05 and 0.1 equiv. HMDA after the same time period. Scale bar = 50 μm. ... 170
Figure 5.16. Low equiv. HDMA study in no-flow setup for double emulsions. (a) TEA12/Zonyl-stabilized
emulsions initial perfect Janus morphology. (b) Full conversion to HC/FC/W morphology was observed after exposure to 0.1 equiv. (0.5 mM) HMDA over 2 min. No bursting was observed. (c) Morphology changes, but not full conversion to HC/FC/W, were observed after exposure to 0.05 equiv. (0.25 mM) HMDA. (d) Minimal morphology changes were observed after 15 min with the addition of 0.025 equiv. (0.125 mM) HMDA. Scale bar = 50 μm. ... 171
Figure 5.17. Ethanol and acetic acid nucleophile studies of TEA12, PYR12 and DMAP12-stabilized single
emulsions before and after the addition of 1.1 equiv. (5.5 for TEA12; 4.4 mM for DMAP12 and PYR12) (a) ethanol or (b) acetic acid in the no-flow setup. Minimal bursting was observed when ethanol and acetic acid were introduced over 15 min. Scale bar = 50 μm. ... 171
Figure 5.18. Ethanol and acetic acid nucleophile studies of TEA12/Zonyl, PYR12/Zonyl, and
DMAP12/Zonyl-stabilized double emulsions. The initial morphology and the morphology 30 min after addition of 1.1 equiv. (5.5 mM for TEA12; 4.4 mM for DMAP12 and PYR12) ethanol or acetic acid are shown. No morphology changes were observed with either analyte. Scale bar = 50 μm. ... 172
Figure 5.19. Single emulsions control studies in PDMS microfluidic testing device. No bursting was
observed after introduction of 1.1 equiv. (1.1 mM) EG2-SH to 1 mM CTAB-stabilized single emulsions
after 20 min. Scale bar = 50 μm. ... 172
Figure 5.20. Control studies with CTAB/Zonyl-stabilized double emulsions with the addition of EG2-SH
and HMDA in the PDMS microfluidic testing device. (a) Initial FC-in-HC-in-W (FC/HC/W) morphology. (b) No change in morphology was observed with the addition of 1.1 equiv. (1.1 mM) EG2-SH after 3 min.
(c) No change in morphology was observed with the addition of 1.1 equiv. (1.1 mM) HMDA after 3 min. Scale bar = 50 μm. ... 172
Figure 5.21. DLS plots and correlation coefficients of Amine-P2 and Acetamide-P2 assemblies. ... 173 Figure 5.22. Control studies for polymer nanoassemblies and single emulsions. (a) TEA12-stabilized single
emulsions exposed to Acetamide-P2 particles after 5 min. (b) CTAB-stabilized single emulsions exposed to Amine-P2 particles after 5 min. (c) CTAB-stabilized single emulsions exposed to Acetamide-P2 particles after 5 min. No bursting was observed in all control studies. Scale bar = 50 μm. ... 173
Figure 5.23. Control studies for polymer nanoassemblies and double emulsions. (a)
TEA12/Zonyl-stabilized emulsions perfect Janus morphology before and after addition of Acetamide-P2. No morphology changes were observed after 30 min. (b) CTAB/Zonyl-stabilized emulsions before and after addition of Amine-P2. No morphology changes were observed after 60 min. Scale bar = 50 μm. ... 174
Figure 5.24. DLS plots and correlation coefficients of PAP vesicles before and after HMDA encapsulation.
... 174
Figure 5.25. TEA/Zonyl-stabilized double emulsions with in situ irradiation of PAP-HMDA in the no-flow
setup. Scale bar = 50 μm. ... 175
Figure 5.26. Control studies for PAP-HMDA addition to single emulsions in the no-flow setup. (a)
TEA12-stabilized single emulsions with UV untreated PAP-HMDA after 5 min. (b) CTAB-TEA12-stabilized single emulsions with UV untreated PAP-HMDA after 5 min. (c) CTAB-stabilized single emulsions with UV treated PAP-HMDA after 5 min. Scale bar = 50 μm. ... 176
Figure 5.27. Control studies for PAP-HMDA addition to double emulsions using the no-flow setup. (a)
TEA12/Zonyl-stabilized emulsions initial perfect Janus morphology (b) Morphology change after exposure to pre-released HMDA from PAP. (c) No morphology changes were observed after droplets (in the absence of PAP-HMDA) were irradiated for 25 min. (d) No morphology changes were observed after 30 min with the addition of HMDA-PAP without excitation. (e) No morphology changes were observed after pre-released HMDA from PAP was added to CTAB/Zonyl-stabilized emulsions after 30 min. Scale bar = 50 μm. ... 176
Figure 5.28. Partitioning studies showing the reacted product formed an insoluble product in water, which
-23-
Figure 5.29. Trigger-induced polyurethane formation. (a) Polyurethane formation scheme. (b)
Nucleophile-induced bursting of XDI in hexane single emulsions masked by a TEA12 layer to form a polyurethane foam with water-soluble triol (images taken after 20 min). ... 178
Figure 5.30. 1H NMR spectrum (400 MHz, CDCl 3) of precursor 1. ... 179 Figure 5.31. 13C NMR spectrum (125 MHz, CDCl 3) of precursor 1. ... 179 Figure 5.32. 1H NMR spectrum (400 MHz, CDCl 3) of precursor 2. ... 180 Figure 5.33. 13C NMR spectrum (125 MHz, CDCl 3) of precursor 2. ... 180 Figure 5.34. 1H NMR spectrum (400 MHz, D 2O) of surfactant 3 (TEA12). ... 181 Figure 5.35. 13C NMR spectrum (125 MHz, D 2O) of surfactant 3 (TEA12). ... 181 Figure 5.36. 1H NMR spectrum (400 MHz, D 2O) of surfactant 4 (PYR12). ... 182 Figure 5.37. 13C NMR spectrum (125 MHz, D 2O) of surfactant 4 (PYR12). ... 182 Figure 5.38. 1H NMR spectrum (400 MHz, D 2O) of surfactant 5 (DMAP12). ... 183 Figure 5.39. 13C NMR spectrum (125 MHz, D 2O) of surfactant 5 (DMAP12). ... 183 Figure 5.40. 1H NMR spectrum (400 MHz, CDCl 3) of 6. ... 184 Figure 5.41. 13C NMR spectrum (125 MHz, CDCl 3) of 6. ... 184 Figure 5.42. 1H NMR spectrum (400 MHz, CDCl 3) of 7 (P1). ... 185 Figure 5.43. 13C NMR spectrum (125 MHz, CDCl 3) of 7 (P1). ... 185 Figure 5.44. 1H NMR spectrum (400 MHz, CDCl 3) of 8 (P2). ... 186 Figure 5.45. 13C NMR spectrum (125 MHz, CDCl 3) of 8 (P2). ... 186 Figure 5.46. 1H NMR spectrum (400 MHz, CDCl 3) of 9 (Amine-P2). ... 187 Figure 5.47. 13C NMR spectrum (125 MHz, CDCl 3) of 9 (Amine-P2). ... 187 Figure 5.48. 1H NMR spectrum (400 MHz, CDCl 3) of 10 (Acetamide-P2). ... 188 Figure 5.49. 13C NMR spectrum (125 MHz, CDCl 3) of 10 (Acetamide-P2). ... 188 Figure 5.50. 1H NMR (400 MHz, acetone-d
6) kinetics studies of TEA12 with 1.1 equiv. EG2-SH.
Appearance of H-b’ was compared to the disappearance of H-a to track reaction progress. ... 189
Figure 5.51. 1H NMR (400 MHz, acetone-d
6) kinetics studies of TEA12 with 0.5 equiv. EG2-SH.
Appearance of H-b’ was compared to the disappearance of H-a to track reaction progress. ... 190
Figure 5.52. 1H NMR (400 MHz, acetone-d
6) kinetics studies of TEA12 with 0.1 equiv. EG2-SH.
Appearance of H-b’ was compared to the disappearance of H-a to track reaction progress. ... 191
Figure 5.53. 1H NMR (400 MHz, acetone-d
6) kinetics studies of DMAP12 with 1.1 equiv. EG2-SH.
Appearance of H-b’ was compared to the disappearance of H-a to track reaction progress. ... 192
Figure 5.54. 1H NMR (400 MHz, acetone-d
6) kinetics studies of DMAP12 with 0.5 equiv. EG2-SH.
Appearance of H-b’ was compared to the disappearance of H-a to track reaction progress. ... 193
Figure 5.55. 1H NMR (500 MHz, acetone-d
6) kinetics studies of PYR12 with 1.1 equiv. EG2-SH.
Appearance of H-b’ was compared to the disappearance of H-a to track reaction progress. ... 194
Figure 5.56. 1H NMR (400 MHz, acetone-d
6) of the isolated product of the reaction between TEA12
-24-
List of Schemes
Scheme 4.1. Schematic for the quantification of amines on nanoparticle surfaces. ... 134
Scheme 5.1. Synthesis of precursors and surfactants (1–5). ... 158 Scheme 5.2. Synthesis of amphiphilic polymers Amine-P2 (9) and Acetamide-P2 (10). ... 160 Scheme 5.3. Synthesis of thiol trigger EG2-SH. ... 162
List of Tables
Table 2.1. Percent conversion of benzaldehyde 4 to imine 8b. ... 65 Table 2.2. Hydrocarbon and fluorocarbon solvent combinations attempts for each substrate (200 mM) and
amine 5 (1 mM). (+) indicates a successful formation of stable emulsions; (-) indicates unstable emulsion formation. Preferred solvent combinations highlighted in green. ... 66
Table 2.3. Percent hydrolysis observed with the addition of water or 1 M HCl. ... 73 Table 2.4. Protein screening for in situ imine formation. ... 88 Table 2.5. Contact angle before and after submitted to controls and droplet wetting. ... 92
Table 3.1. Tc for 1:1 volume mixture of o-DCB/HFE-7200 with varying concentrations of AZO-RF. ... 114
List of Equations
Equation 1.1. ΔGform = ΔAγ - TΔSconf ... 26
Equation 3.1. 𝑐𝑜𝑠𝜃𝐿𝐶 = 𝛾𝐹𝐶2 − 𝛾𝐿𝐶2 − 𝛾𝐿𝐶/𝐹𝐶22 ∙ 𝛾𝐿𝐶/𝐹𝐶 ∙ 𝛾𝐹𝐶 ... 98
-25-
1. Introduction – Responsive Emulsion Systems
1.1 Emulsions and Stabilizers
An emulsion consists of one or more immiscible phases dispersed within another immiscible phase. They are ubiquitous in daily life and across industries, such as food (milk, mayonnaise), cosmetics (hair products), pharmaceuticals (vaccine adjuvants), and agriculture (pesticides).1–4 A material comprising both
an oil and water allows for incorporation of selectively soluble reagents to either phase, increasing system complexity and specialized delivery capabilities for desired applications. For example, drugs that are selectively soluble in an oil phase can effectively be delivered to a target via an emulsion system, such as is topical drug delivery. Emulsions can be single emulsions (one phase dispersed in another) or multiple emulsions (emulsions of emulsions).5 Examples of multiple emulsions, also referred to as complex
emulsions, include double emulsions—droplets comprising two immiscible phases dispersed in another phase—or more complex systems comprising three or more immiscible phases or structural complexity (Figure 1.1).6,7 Emulsions are further described by their configuration, such as oil-in-water (O/W),
water-in-oil (W/O), water-water-in-oil-in-water (W/O/W), and oil1-in-oil2-in-water (O1/O2/W). For example, in an O/W
single emulsion, the oil is the dispersed phase in an aqueous continuous phase. In complex emulsions, configurations also range from core-shell multilayers, Janus (equal hemispheres), or dispersed internal micro-droplets.
-26-
Additionally, emulsions can be classified by their diameter: microemulsions (< 100 nm), nano- or miniemulsions (100 nm – 1 µm), and macroemulsions (> 1 µm).8,9 Nanoemulsions are sometimes also
characterized as < 100 nm, which leads to the incorrect, interchangeable use of the terms nano- and microemulsions across the literature, resulting in some confusion of the terms and emulsion characteristics. Importantly, microemulsions are a specific class of emulsions that are uniquely characterized by their thermodynamic stability.8,10 That is, microemulsions can spontaneously form from separate phases into
dispersions. Conversely, nanoemulsions and macroemulsions—the focus of this thesis and referred herein as emulsions—are thermodynamically unfavorable systems. When considering the thermodynamic stability of a given emulsion system, the surface area (size-dependent), interfacial free energy, and configuration entropy are important factors (Equation 1.1).8,10,11
Equation 1.1. ΔGform = ΔAγ - TΔSconf
Where ΔGform is the change in free energy in forming dispersions from separate phases, ΔA is the change
in interfacial surface area, γ is the interfacial tension between the phases, T is temperature, and ΔSconf is the
configuration entropy. The first term, ΔAγ, describes the change in interfacial free energy for creating more surface area between two immiscible phases. With emulsification, the number of droplets increases, and consequently TΔSconf is positive. Although both ΔAγ and TΔSconf are positive terms with emulsification,
generally ΔAγ >> TΔSconf, resulting in a positive ΔGform; therefore, emulsification is nonspontaneous and
thermodynamically unfavorable.11 Conversely, microemulsions are thermodynamically stable as a result of
a more positive TΔSconf term associated with an increase in droplet number and require very low interfacial
tensions (< 0.01 mN/m), which counteracts the large increase in surface area.8
Formation of emulsions generally requires an energy input to fragment a bulk phase into dispersed droplets;8 however, some examples of spontaneous emulsification are known.12 Without stabilizing
components, the dispersed droplets will rapidly phase separate to reduce the interfacial area between the immiscible phases. The addition of an emulsifying agent helps stabilize the emulsions allowing for a higher interfacial area and prevents phase separation.8 The emulsifying agents adsorb and align at the emulsion
interface, reducing the γ and therefore the ΔAγ term. This reduction in interfacial free energy results in a lower ΔGform, meaning the system is relatively more thermodynamically stable, albeit with a positive ΔGform.
Emulsifying agents also provide a barrier at the interface and prevent phase separation through electrostatic interactions or through a steric barrier, imparting kinetic stability to emulsions; as a result, emulsions with emulsifying agents are metastable.13,14
Emulsifying agents can be separated into two broad categories: surfactants or solid particles. Surfactants are amphiphilic molecules that comprise a hydrophilic head group and a hydrophobic tail and
-27-
adsorb to the oil-water interface (Figure 1.2a). They can be either small molecular surfactants or polymeric surfactants (Figure 1.2b). Surfactants are further classified by their polar headgroup as ionic (cationic, anionic, zwitterionic) or nonionic. Surfactants self-assemble in solution above their critical micelle concentration (CMC) to form micelles. Although surfactants assemble into ordered micelle structures, self-assembly is an entropically driven, favorable process. Assembly is driven by the hydrophobic effect, wherein the disruption of hydrogen-bond networks of water molecules around the hydrophobic tails during assembly increases overall entropy of the system and outweighs the increase in order from assembly.8,15
The hydrophobic effect is also responsible for driving surfactants to interfaces, where the accumulation of surfactants is a spontaneous process and results in the reduction of γ.8,15 The molecular structure of the
surfactants, specifically their hydrophilic-lipophilic balance (HLB) and geometry, determines the type of emulsions they can stabilize.9,16,17 Surfactants with HLB < 10 are generally oil soluble and can generate
W/O emulsions (ex. Span 20, Figure 1.2b). Surfactants with HLB > 10 are water soluble and can generate O/W emulsions (ex. SDS, Tween 20, Figure 1.2b).
Figure 1.2. Surfactants as emulsifying agents. (a) Structure and alignment in an O/W single emulsion. (b)
Examples of ionic surfactants: sodium dodecyl sulfate (SDS), cetyl trimethylammonium bromide (CTAB), phospholipid, and nonionic surfactants: Tween 20, Zonyl-FS 300, Span 20.
Emulsions stabilized solely by particles are referred to as Pickering emulsions.18–21 Particles can be
non-amphiphilic particles (e.g., silica or clay)22,23 or amphiphilic Janus particles,24–26 which are