Corporate Sustainability Assessment Methodology
by
Natallia Pinchuk
B.S. Nuclear Engineering and Radiological Science, University of Michigan, Ann Arbor, 2006
M.S. Nuclear Engineering and Radiological Science, University of Michigan, Ann Arbor, 2007
Submitted to the MIT Sloan School of Management and the Department of Mechanical Partial Fulfillment of the Requirements for the Degrees of
Master of Business Administration
and
Master of Science in Mechanical Engineering
In conjunction with the Leaders for Global Operations Program at the Massachusetts Institute of Technology
Engineering in MASSACHUSETTS INSTITUTE OF TECHNOLOGY
JUN 15 2011
LIBRARIES
ARCHIVES
June 2011@ 2011 Natallia Pinchuk. All rights reserved.
The author hereby grants to MIT permission to reproduce and to distribute publicly copies of this thesis document in the whole or in part in any medium now known or hereafter created.
Signature of Author
May 6, 2011 Mechanical Engineering Department. MIT Sloan School of Manaeement Certified by
Sarah Slaughtefr, Thesis Supervisor Senior Lecturer, MIT Sloan School of Management
Dan.Whityne hesis Supervisor Senior Rsearch Seintist. Mich airaI Fnpinpirino Dazoartment
Certified by
Accepted by________
David Hardt, Chair, Mechanical Engineerifig Department Education Committee PrnfpSor. Mechanical Engineering Department
Accepted by
Debbie Berechman, Elecutive Director of MBA Program MIT Sloan School of Management
Corporate Sustainability Assessment
by Natallia Pinchuk
Submitted to the MIT Sloan School of Management and the Mechanical Engineering Department on May 6, 2011 in Partial Fulfillment of the Requirements for the Degrees of Master of Business
Administration and Master of Science in Mechanical Engineering Department
Abstract
Sustainability is a vague concept specifically in the context of a corporate world. There are numerous definitions for corporate sustainability and just as many ways of evaluating it. This work attempts to define, structure and assess corporate sustainability in a standardized robust manner through
development of a comprehensive framework. The framework is developed based on Global Reporting Initiative (GRI) guidelines to serve as a common measure system allowing for meaningful assessment of current state and comparison between companies in a variety of industries. Based on this framework and earlier developed Sustainability Assessment by Fuzzy Evaluation (SAFE) model a quantitative method is developed in MATLAB code. The new method is demonstrated on five companies within software industry through evaluation of publicly available data. The outcome of the evaluation is a relative ranking of companies with respect to economic, social and environmental aspects as well as intermediate components of each. Additionally high impact components, which have the potential to improve the ranking outcome the most, are identified for one of the companies as an example of practical application of such assessment. Evaluation of these components could serve as a base for recommendations development of further management action on improving of company's
sustainability.
Thesis Supervisor: Sarah Slaughter
Title: Senior Lecturer, MIT Sloan School of Management
Thesis Supervisor: Daniel Whitney
Acknowledgments
I
would like to thank my company supervisor, mentor and friend Karen Tempkin for her support, confidence in me and endless energy and optimism. Her ingenuity and enthusiasm continuously inspired me to conceive, develop and finish the project. Without her this work would not have seen the light of day. I also would like to thank my company champion Bill Foley for his patience, support and wisdom navigating the corporate world.TABLE OF.CONTENTS
ABSTRACT ... ... 3
ACKNOW LEDGM ENTS... . . ... ... 5
CHAPTER 1: SUSTAINABILITY IN A CORPORATE WORLD, DEFINITION, SIGNIFICANCE ... 12
1.1 INTRODUCTION...12
1.2 DEFINITION OF CORPORATE SUSTAINABILITY ... 12
1.3 PROJECT M OTIVATION ... 13
1.3.1 SUSTAINABILITY AT RAYTHEON... 14
1.3.2 SUSTAINABILITYAT 1S ... 16
1.4 HYPOTHESIS..----... 17
1.5 RESEARCH M ETHODOLOGY... 17
1.5.1 CORPORATE SUSTAINABILITY EVALUATION TECHNIQUES, NP-SAFE OVERVIEW... 18
1.5.2 DATA GATHERING APPROACH... 19
1.5.3 NP-SAFE DEMONSTRATION... 19
1.6 CHAPTER SUMMARY... 19
CHAPTER 2: SU STAINABILITY EVALUATION TECHNIQUES ... 21
2.1 GLOBAL REPORTING INITIATIVE GUIDELINES... 21
2.2 SUSTAINABILITY RATING SYSTEMS... 22
2.3 SUSTAINABILITY EVALUATION VIA FUZZY LOGIC... 24
2.4 NP-SAFE ASSESSMENT M ODEL... 26
2.5 CHAPTER SUMMARY ...---... ... 26
CHAPTER 3: FUZZY LOGIC... ... ... ... 28
3.1 INTRODUCTION TO M ATLAB AND FUZZY LOGIC... 28
3.2 FUZZY SETS... 29
3.3 M EMBERSHIP FUNCTIONS... 30
3.4 LOGICAL OPERATORS... 31
3.5 IF-THEN RULES... 32
3.6 CHAPTER SUMMARY... 32
4.1 M ODEL DESCRIPTION ... 34
4.2 BASIC SUSTAINABILITY INDICATORS ... ... 34
4.3 TERTIARY, SECONDARY AND PRIMARY VARIABLES ... 36
4.4 ADDITIONAL INDICATORS ... 38 4.5 M ODEL STRUCTURE ...---... - 40 4.5.1 DATA TREATMENT...-... 43 4.5.2 NORMALIZATION ...---... .. 44 4.5.3 FUZZIFICATION ...--- ... .--. 46 4.5.4 EVALUATION RULES ...---...---- 48 4.5.5 DEFUZZIFICATION... .. 53 4.6 SENSITIVITY ANALYSIS ...----.---... 53 4.7 CHAPTER SUMMARY ...--... 54
CHAPTER 5: M ODEL IM PLEM ENTATION AND RESULTS ... 56
5.1 M ETHODOLOGY APPLICATION ... .56
5.1.1 DATA RELIABILITY ...--. 56
5.1.2 DATA TREATMENT... 57
5.1.3 NORMALIZATION OF THE BASIC INDICATORS... 57
5.2 RESULTS... ---... 58
5.3 SENSITIVITY ANALYSIS ... 59
5.4 CHAPTER SUMMARY ...-... 60
CHAPTER 6: CONCLUSIONS AND FUTURE RESEARCH ... 61
6.1 CONCLUSIONS ... 61
6.2 M ODEL GROWTH AND FUTURE RESEARCH ... 61
6.3 M ODEL LIMITATIONS ... 62
6.4 CHAPTER SUMMARY ...-- ...---. 63
APPENDICES... 64
APPENDIX A: ECONOMIC INDICATORS (GLOBAL REPORTING INITIATIVE, 2010) ... 64
APPENDIX B: SOCIAL INDICATORS ((GLOBAL REPORTING INITIATIVE, 2010), CONT'D ON THE NEXT PAGE)... 65
SOCIAL INDICATORS (CONT'D) ...- .. -...---.---.-... 66
SOCIAL INDICATORS (CONT'D) ... 68
APPENDIX C: ENVIRONMENTAL INDICATORS (GLOBAL REPORTING INITIATIVE, 2010) ... 69
ENVIRONMENTAL INDICATORS (CONT'D)... 70
APPENDIX D: SUSTAINABILITY SURVEY... 71
APPENDIX E: ILLUSTRATION OF FUZZY COMPUTATIONS...84
APPENDIX F: TAGUCHI'S DESIGN OF EXPERIMENT ... 88
APPENDIX G: RAW DATA... 89
APPENDIX H: M INIMUM, M AXIMUM AND TARGET OF BASIC INDICATORS... 93
APPENDIX I: DESIGN OF EXPERIMENTS RESULTS... 96
APPENDIX J: THE PRESSURE-STATE-RESPONSE (PSR) MODEL (ORGANIZATION FOR ECONOMIC CO-OPERATION AND DEVELOPMENT (OECD), 1991) ... 97
APPENDIX K: OECD CORE SET OF ENVIRONMENTAL INDICATORS ... 98
LIST OF FIGURES
FIGURE 1: ||5 M ARKETS AND CAPABILITIES (RAYTHEON, 2009). ... ... ... 14
FIGURE 2: RAYTHEON PUBLISHES YEARLY CORPORATE RESPONSIBILITY REPORTS ... 15
FIGURE 3: EPA AWARDED RAYTHEON THE 2010 ENERGY STAR AWARD FOR SUSTAINED EXCELLENCE IN ENERGY MANAGEMENT FOR THE THIRD CO N SECUTIV E YEA R ... 15
FIGURE 4: RAYTHEON TRACKS ENERGY CONSUMPTION AND GREENHOUSE GAS EMISSION AMONG OTHER SUSTAINABILITY METRICS. ... 16
FIG URE 5 : G LO BAL REPO RTING IN ITIATIVE ... 2 1 FIGURE 6: THE G RI REPORTING FRAM EW ORK ... 21
FIGURE 7: D ow JONES SUSTAINABILITY INDEXES ... 22
FIGURE 8: Dow JONES SUSTAINABILITY GROUP INDEX WORLD VS. Dow JONES GLOBAL INDEX WORLD (DECEMBER 1993 - AUGUST 200 0 , U S D , PRICE IN D EX)... 2 3 FIGURE 9: SUSTAINABILITY LEADERS IN AEROSPACE AND DEFENSE CATEGORY AS OF SEPTEMBER 21, 2009. ... 24
FIGURE 10: HIERARCHICAL STRUCTURE OF SAFE M ODEL... 25
FIGURE 11: HIERARCHICAL STRUCTURE OF NP-SAFE M ODEL... 26
FIGURE 12: PRECISION VS. SIGNIFICANCE (FROM (M ATHW ORKS, 2010). ... ... ... 29
FIGURE 13: M EMBERSHIP FUNCTION OF EMPLOYEE TRAINING PROGRAM ... ... ... 30
FIGURE 14: CRISP MEMBERSHIP FUNCTION OF EMPLOYEE TRAINING PROGRAM... 31
FIGURE 15: BOOLEAN LOGIC TRUTH TABLE (FROM (MATHWORKS, 2010)). ... ... 31
FIGURE 16: TWO-VALUED LOGIC (BOOLEAN) AND MULTI-VALUED LOGIC (FUZZY) (FROM (MATHWORKS, 2010))... 32
FIGURE 17: PRIMARY, SECONDARY, TERTIARY VARIABLES AND BASICINDICATORS ORGANIZATION IN NP-SAFE (SOME TERTIARY VARIABLES AND BASIC INDICATORS ARE OM ITTED FOR SIM PLICITY). ... ... 35
FIGURE 18: METHODOLOGY FOR NP-SAFE (MOST INTERMEDIATE ELEMENTS ARE EMITTED FOR SIMPLICITY). ... ... 42
FIGURE 19: D ATA TREATM ENT PROCESS... 44
FIGURE 20: NORMALIZATION OF A BASIC INDICATOR V, IF TARGET T(v) IS MINIMUM. ... 45
FIGURE 21: NORMALIZATION OF A BASIC INDICATOR V, IF TARGET T(v) IS MAXIMUM... 45
FIGURE 22: NORMALIZATION OF A BASIC INDICATOR V, IF TARGET T(V) IS AN INTERVAL. ... 46
FIGURE 23: MEMBERSHIP FUNCTIONS FOR PRIMARY VARIABLES ECONI, SOCI, AND ENVI ... 46
FIGURE 24: MEMBERSHIP FUNCTIONS FOR SECONDARY VARIABLES SUCH AS ECONP, MP, IEI, HR, LA, ETC... 47
FIGURE 25: MEMBERSHIP FUNCTIONS FOR TERTIARY VARIABLES SUCH AS HRO, HRS, HRR, LAP, LAS, LAR, ETC AND BASIC INDICATORS SU CH AS H R 1, H R 2 , ETC... 4 7 FIGURE 26: LINGUISTIC VALUES AND FUZZIFICATION OF CRISP INPUTS ... 85
LIST OF TABLES
TABLE 1: D JSI A SSESSM ENT AREAS... .. -... -... ... ... 23
TABLE 2: EXAMPLE OF SUSTAINABILITY INDICATORS AND COMPUTATION OF THE QUANTITATIVE VALUE OF THE SECONDARY VARIABLE TMp FOR A HYPOTHETICAL COMPANY (MP IS MARKET PRESENCE, P IS PRESSURE, S IS STATUS, AND R IS RESPONSE). ... 37
TABLE 3: EXAMPLE OF SUSTAINABILITY INDICATORS AND COMPUTATION OF THE QUANTITATIVE VALUE OF THE SECONDARY VARIABLE TIE, FOR A HYPOTHETICAL COMPANY (IEI IS INDIRECT ECONOMIC IMPACT, P IS PRESSURE, S IS STATUS, AND R IS RESPONSE). ... 37
TABLE 4: PRESSURE INDICATORS USED IN THE MODEL (ONLY INDICATORS NOT LISTED IN THE SURVEY (APPENDIX D) AND STATIC IN EACH EVA LUATIO N A RE CITED)... 39
TABLE 5: EXCERPT FROM LINGUISTIC RULE BASE FOR THE PRIMARY VARIABLES (125 RULES). ... ... 49
TABLE 6: EXCERPT FROM LINGUISTIC RULE BASE FOR THE SECONDARY VARIABLES (53=125 FOR A VARIABLE WITH 3 INPUTS AND 54=625 FO R A VARIABLE W ITH 4 INPUTS) ... 50
TABLE 7: LINGUISTIC RULE BASE FOR THE TERTIARY VARIABLES (27 RULES). ... 51
TABLE 8: LINGUISTIC RULE BASE FOR THE BASIC INDICATORS (9 RULES)... 51
TABLE 9: EXCERPT FROM LINGUISTIC RULE BASE FOR THE BASIC INDICATORS (27 RULES). ... 52
TABLE 10: EXCERPT FROM LINGUISTIC RULE BASE FOR THE BASIC INDICATORS (81 RULES). ... 52
TABLE 11: EXCERPT FROM LINGUISTIC RULE BASE FOR THE BASIC INDICATORS (243 RULES)... 52
TABLE 12: EXCERPT FROM LINGUISTIC RULE BASE FOR THE BASIC INDICATORS (729 RULES)... 53
TABLE 13: NPSAFE METHODOLOGY APPLICATION RESULTS BROKEN DOWN BY CATEGORY FOR IMB, SAP, SYMANTEC, HP, CISCO AND A HYPOTHETIC IDEAL CO M PA NY. ... 58
TABLE 14: TOP 10 BASIC INDICATORS WITH THE MOST SIGNIFICANT IMPACT ON FINAL SCORE FOR CISCO (IN DECREASING SIGNIFICANCE
Chapter
1: Sustainability in a corporate world, definition, significance
1.1
Introduction
Sustainability and sustainable development became increasingly popular words in the last three decades that politicians, economists and businesspeople like to use. However, different people interpret them differently depending on an industry, a country or a product of interest. One of the most popular interpretations was adopted from the definition by Brundtland Commission of the United Nations (United Nations General Assembly, 1987): "sustainable development is development that meets the needs of the present without compromising the ability of future generations to meet their own needs." This thesis intends to look into sustainability and sustainable development in the context of corporations and large firms, dive into the meaning, evaluation and conclusions that can be derived from it.
This work develops a new corporate sustainability evaluation technique, which is a comprehensive assessment covering nearly all areas of a company's conduct: from public relations to operations impact on local communities, from economical profitability to life cycle analysis of products. The model, called
NP-SAFE', could be used by a company to identify sustainability areas in which it could improve, both with respect to its objectives and in comparison with its peer companies.
This work comprises five chapters. The first one will explain the motivation behind this work and describe the definition of sustainability and sustainable development used in this research, academia and industry. Then a review of current sustainability evaluation techniques is presented in the second chapter. The third one is a brief overview of some of the basic concepts, such as fuzzy logic, used in the model building. This chapter is crucial to understanding how the model works from technical
prospective. However if one is already familiar with fuzzy logic then the reader can proceed directly to chapter four, which explains the model structure in detail. Chapter five presents five examples of model application, results and conclusions drawn from the evaluation, as well as suggests further areas of research and improvement for the model.
1.2
Definition of Corporate Sustainability
There are several definitions used for corporate sustainability in the business world, most of which one way or another tie in ethical corporate practice. Most people therefore perceive corporate
sustainability as just another word for corporate social responsibility or corporate citizenship. In this
1NP-SAFE acronym is derived from the parent model SAFE (Sustainability Assessment by Fuzzy Evaluation) and
work however corporate sustainability has a much broader meaning. It is a "business approach that creates long-term shareholder value by embracing opportunities and managing risks deriving from economic, environmental and social developments" (Atkinson, 2000).
This approach relies on a better-known concept of the Triple Bottom Line (Goethe-Institut, 2008), which suggests that business goals should be inseparable from the societies and environment in which they operate. In order to succeed in the long term a sustainable business has to advance and grow in three areas: People, Planet and Profit. It is also important to point out that apart from these three categories there is an important strategic principle on which corporate sustainability should rely: transparency. Having an engaged and open environment within the company as well as the community improves overall performance and increases profits. Open culture promotes employee involvement in regards to innovation and creative processes. When community becomes involved it becomes a company's stakeholder and therefore is interested in the company's success. Community involvement is also inexpensive, because people are often willing to volunteer their time, and provides a diverse comprehensive evaluation (Garsten, 2008).
1.3
Project Motivation
Intelligence and Information Systems (IIS), one of six business divisions within Raytheon Corporation, is inspired to do business in a more sustainable manner, and motivated this project. Raytheon is a $25B defense contractor and industrial corporation with core manufacturing concentration in weapons and military. Raytheon is composed of six major business divisions, of which IIS is one. IIS had $2.8B in sales in 2010, and employed 8,300 employees. This division designs, delivers, secures and supports critical intelligence and information system missions throughout the world. There are four key markets, in which IIS is a major player: Intelligence, Surveillance and Reconnaissance; Cybersecurity; environmental; and civil security (Figure 1). IIS provides end-to-end systems to process data at near real-time speed and scale (Raytheon, 2009). Within Raytheon I1s business unit has unique portfolio of products and services, operations, and supply chain. As a business IIS is committed to doing business more sustainably,
understand comprehensibility of its current sustainability program and be able to compare itself to its peers in the industry.
I 1S Capabilitie C2 of Air a.> Space VehiMPt Geospapal Intelligence Cybersecut', Solutions Knowledg~ Managemn missio Manageme:!-Image ProX Deve op -Syste ni Integratd" 9
Figure 1: IIS Markets and Capabilities (Raytheon, 2009).
1.3.1 Sustainability at Raytheon
Raytheon's vision is to be the most admired defense and aerospace systems supplier through world-class people and technology. To date Raytheon has achieved measurable progress in sustainability, including respect for the external environment, and they continue striving to achieve tangible improvement (Raytheon, 2009). Sustainability at Raytheon is defined as "showing respect for the external environment-eliminating pollution and waste, minimizing the use of water and other natural resources, maximizing reuse and recycling and working steadily to reduce our carbon footprint".
Raytheon states that they "work regularly with customers, suppliers, partners, industry and government leaders, academic researchers and neighbors to devise and implement solutions that work for the business and protect the world around." They "strive to integrate energy efficiency and environmentally friendly behavior into the daily practice of every Raytheon business" (Raytheon, 2009).
Markets and Capabilities'""
This definition is general enough to provide each business unit freedom of interpretation and choice of implementation depending on the nature of the business, and what's feasible. While at the same time the definition provides guidance and general consensus among business units around how sustainability is understood at Raytheon. It also should be mentioned that sustainability definition at Raytheon has been evolving, and becoming more comprehensive over time.
209 Corpor ate Responsibiity Reor E
Kayitheem
Figure 2: Raytheon publishes yearly Corporate Responsibility Figure 3: EPA awarded Raytheon the 2010 ENERGY STAR
Reports Award for Sustained Excellence in energy management for
the third consecutive year2
There are a number of programs at Raytheon under the umbrella of sustainability according to the 2009 Corporate Responsibility Report (Figure 2). They include:
1. Safety and Wellness
a. Participation in OSHA Voluntary Protection Program
b. Injury Prevention
c. Workers' Compensation Program
d. Work/Life Program
e. Environmental, Health And Safety Audits
f. Mission: Health
2 Raytheon was awarded ENERGY STAR Sustained Excellence Award in 2011 as well making it the fourth consecutive year to receive the award.
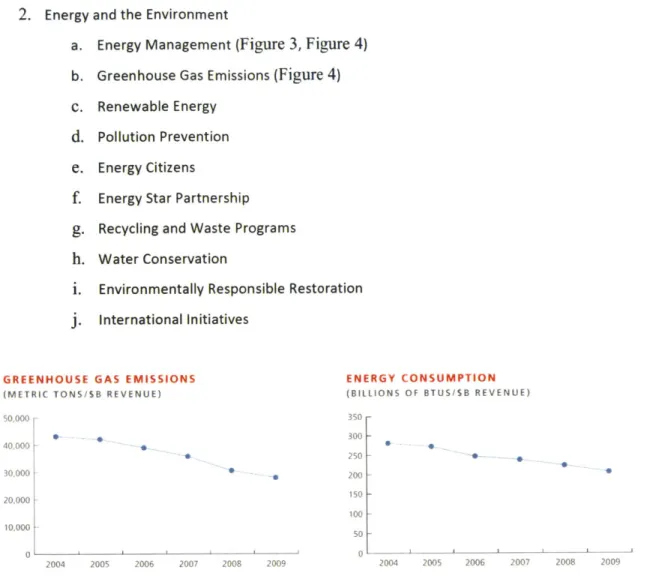
2. Energy and the Environment
a. Energy Management (Figure 3, Figure 4)
b. Greenhouse Gas Emissions (Figure 4)
c. Renewable Energy
d. Pollution Prevention
e. Energy Citizens
f. Energy Star Partnership
g. Recycling and Waste Programs
h. Water Conservation
I. Environmentally Responsible Restoration
j.
International InitiativesGREENHOUSE GAS EMISSIONS ENERGY CONSUMPTION
(METRIC TONS/SB REVENUE) (BILLIONS OF BTUS/SB REVENUE)
50,000 350 *0*0300 -40 000~ 250 -30,000 200 -20,000 150 -100 10,000 50 0 0 - --- ---2004 2005 2006 2007 2008 2009 2004 2005 2006 2007 2008 2009
Figure 4: Raytheon tracks energy consumption and greenhouse gas emission among other sustainability metrics. There are also numerous programs in social area, which do not fall under the umbrella of sustainability as Raytheon defines it, but would definitely be part of overall sustainability, as defined in section 1.2.
For a complete list of these programs, please refer to Raytheon's 2009 Corporate Responsibility Report (Raytheon, 2009).
1.3.2 Sustainability at 1IS
Each of the six businesses comprising Raytheon could participate in the programs described in section
1.3.1, have their own programs or have a customized version of a Raytheon-wide program. This was the
case in IIS. Overall business units, including I1S, have to interpret and implement Raytheon's vision of sustainability based on their understanding of it, resources available, and specific nature of their business. Due to the unique nature of IIS described earlier, a better understanding of what Raytheon
sustainability means for
IIS
and how they can improve were needed. FurthermoreIls
is inspired to be a leader among the business units in sustainability, and therefore was interested in advancing the vision, and real life implementation of sustainable business practices.To summarize the problem at hand, in the past IIS implemented a variety of programs and metrics in sustainability under corporation-wide vision. They were chosen based on the interpretation of the current Raytheon definition of sustainability. However due to unique nature of business at
IlS,
a better understanding of what sustainability could look like atIls
was needed. AdditionallyIIS
wanted to advance in this area and become the leader of sustainability at Raytheon and potentially advance the corporate-wide vision. NP-SAFE, the sustainability evaluation tool, was developed with these needs in mind. The set of companies, on which NP-SAFE was applied, was therefore selected based on industry similarities to115.
1.4
Hypothesis
In the light of the problem statement described above, a more succinct question is posed in this research: How can IIS develop and use a sustainability assessment methodology that not only will work for all other diverse business units, but allow assessment of Raytheon as a whole as well as comparison to other corporations? The hypothesis answering this question is therefore as follows:
It is possible to develop a robust, standardized sustainability assessment methodology suitable to multiple industries and company types, based on comprehensive characterization of sustainability.
There are a few key components to a valuable assessment tool: standardization (ensure that a
consistent basis is applied to all subjects to allow fair comparison), applicability (comparison basis has to make sense for all business units and companies without putting one in a disadvantaged position due to nature of its business), and comprehensiveness (as the understanding of sustainability evolves within the business, some aspects will become more important than others, however, nothing should fall through the cracks).
1.5
Research Methodology
The goal of the research is to develop a sustainability assessment methodology, which can be applied to businesses of different sizes and types, and yet provide equal basis for comparison. The philosophy behind this research is to fuse academic assessment methods of sustainability with business world criteria of such assessment. Therefore methodology development will rely heavily on previously
developed methods (Andriantiatsaholiniaina, 2003), (Phillis Y. A., 2008), (Phillis Y. A., 2000) for
sustainable development assessment of a country or a business found in academia. While keeping the approach to the assessment similar, the scope will be modified to correspond to widely used
sustainability guidelines (Global Reporting Initiative, 2010) in the business world. Previously developed methods and sustainability guidelines are reviewed in more detail in Chapter 2.
1.5.1 Coirpor ate sustainability evaluation techniques, NP-SAFE overview
There are a plethora of corporate sustainability assessment methods (some of them illustrated in chapter 2). The overwhelming majority of them rely on two elements: categories of evaluation and corresponding weighting. However this approach has obvious drawbacks, such as unfair basis of
comparison. For example, a fossil fuel power plant will score worse than an insurance company working out of one office building because of the nature of their businesses. A fossil fuel power plant is
essentially in the business of producing greenhouse gases, an inseparable byproduct of burning fossil fuels. Office buildings on the other hand (albeit could be managed inefficiently) can avoid greenhouse gasses emissions altogether. Therefore if greenhouse gas emission is a heavily weighted category in a sustainability assessment there will be a bias due to the nature of a business. The final score will also heavily depend on how the weights were distributed for each of the categories, allowing room for gaming the system.
NP-SAFE on another hand avoids most of these issues by using normalization based on size of a company. The size of a company is measured on multiple dimensions: revenue, number of employees, amount of total energy used, land it occupies, etc. The model also does not use explicit weightings. And most importantly NP-SAFE favors significance over precision via employment of fuzzy logic (illustrated in chapter 3).
One of the key components used in NP-SAFE is fuzzy logic. It is well equipped to handle such difficult-to-define or measure concepts such as sustainability, because of its inherent vagueness and complexity. The following two features of fuzzy logic justified its usage: 1) fuzzy logic has the ability to deal with complex and polymorphous concepts, which are not open to straightforward quantification and contain ambiguities 2) fuzzy logic provides the mathematical tools to handle ambiguous concepts and reasoning, and gives concrete answers to problems filled with subjectivity (Phillis Y. A., 2008).
15.2 Data gathering approach
To demonstrate application of NP-SAFE several testing companies were required. One limitation imposed on testing subjects is IT/software development nature of their business (section 5.1). Another requirement is that only companies, which are fairly transparent about their sustainability performance, were suitable subjects due to scarcity of data for the rest. Therefore only public data was used in NP-SAFE assessment. It's important to realize the companies do not disclose much of internal information. The results of this sustainability assessment therefore reflect only public perception based on disclosed data. In reality a company might be more or less sustainable.
Another aspect of data gathering is quantitative emphasis. Many sustainability assessment techniques rely on qualitative data, which is understandable given the ambiguity of sustainability concept. However this was not the case for NP-SAFE. To eliminate potential bias associated with usage of qualitative information only quantitative data were used. To assist with the data gathering process a standard survey was developed (described in section 4.2). A blank template can be found in Appendix D: Sustainability Survey). The survey is conveniently split into several functional areas to ease the data gathering within a company.
15.3 NP-SAFF Demonstration
NP-SAFE requires large amount of data, which might not have been collected before within a company or a business unit, such as IIS. If this is the case, implementation of this model would require either supplementary data collection effort or additional metric implementation, neither of which are trivial tasks. This problem however is largely avoided with companies, which already report according to the GRI guidelines. Once the data collection is complete NP-SAFE can be used.
1.6
Chapter Summary
In this chapter the concepts of sustainability, sustainable development and corporate sustainability are introduced. Although many sound definitions exist the author reports most widely used and accepted definitions for each of mentioned above concepts. The focus of this research is corporate sustainability, the definition of which relies on the idea of Economic, Social, and Environmental elements or Triple
Bottom Line approach. These are crucial to corporate sustainability assessment framework development discussed in Chapter 2 and therefore explored as well.
The motivation for this project and background information on Raytheon and one of its business units are presented along with Raytheon's understanding and definition of sustainability. This provides
context in which NP-SAFE model was developed. Therefore a hypothesis of ability to develop a robust,
standardized sustainability assessment methodology suitable to multiple industries and company types, based on comprehensive characterization of sustainability is stated. A brief overview of NP-SAFE is given
to illustrated application of this hypothesis.
Chapter 2 will introduce the reader to several sustainability assessment frameworks and methodologies. First, Global Reporting Initiative guidelines are discussed. These are the cornerstones of NP-SAFE model framework. Next, Dow Jones Sustainability Index is examined as an example of a comprehensive corporate sustainability assessment methodology widely used in financial world. Then SAFE
methodology is reviewed. This methodology is the starting point for quantitative model development of NP-SAFE. And lastly a more detailed overview of NP-SAFE will be given.
Chapter 2: Sustainability evaluation techniques
This chapter provides brief overview of selected sustainability evaluation techniques and frameworks including Global Reporting Initiative guidelines, Dow Jones Sustainability Index, SAFE and NP-SAFE.
2.1
Global Reporting Initiative guidelines
Global Reporting Initiative (GRI, Figure 5) is an organization that pioneered the world's most widely used sustainability reporting framework. Its goals include the mainstreaming of disclosure on environmental, social and governance performance (Global Reporting Initiative, 2010). Sustainability reports compiled based on the GRI utilize a framework to demonstrate organizational commitment to sustainable development, compare organizational performance over time, and to measure organizational performance with respect to laws, norms, standards, and voluntary initiatives (Figure 6). The GRI guidelines provide Performance Indicators that organizations can use to measure and report their economic, environmental and social performance.
Global
Reporting
Initiative
TM 0*0
Figure 5: Global Reporting Initiative Figure 6: The GRI reporting Framework
The number of companies using GRI guidelines has been increasing by about 30% annually since 2007 worldwide. The spectrum of these companies is vast including: agriculture, automotive, aviation, chemicals, commercial services, computers, conglomerates, construction, construction material, consumer durable, energy, energy utilities, equipment, financial services, food and beverage products, forest and paper products, healthcare products, healthcare services, household and personal products, logistics, media, metal products, mining, non-profit and services, public agency, railroad, real estate, retailers, technology hardware, telecommunications, textiles and apparel, tourism and leisure, universities, waste management, water utilities and other. Some of the companies which use them
include Bank of America, Coca-Cola, Dell, Citigroup, Ford, General Electric, Hewlett Packard, Starbucks, USPS, UPS and hundreds of others around the globe.
The GRI reporting framework is intended to aid companies in reporting their economic, environmental, and social performance in a standardized, consistent manner. It is designed so that an organization of any size, sector or location could easily use it. It also takes into account the practical consideration faced by a diverse range of organizations from small enterprises to those with extensive and geographically dispersed operations.
2.2
Sustainability rating systems
There are a variety of sustainability rating systems, unlike that which was described above, will assign a company a score based on analysis comparing companies. To illustrate this kind of rating system lets look at the Dow Jones Sustainability Indexes (Figure 7), which are some of the most popular and credible systems.
(,
Dow Jones
Sustainability Indexes
Figure 7: Dow Jones Sustainability Indexes
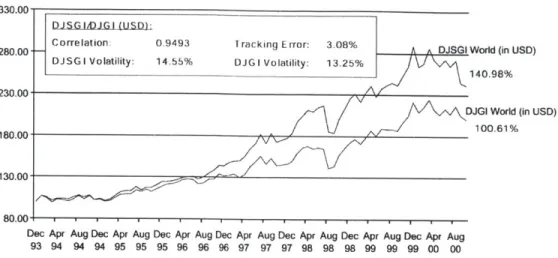
The Dow Jones Sustainability Indexes (DJSI) are a cooperation between Dow Jones Indexes and SAM3. Together they assess sustainability driven companies and track their financial performance to guide potential investors (Figure 8). DJSI assesses the quality of a company's strategy and management and its performance in dealing with opportunities deriving from economic, environmental and social
developments. There are several areas that go into the assessment: strategy, financial, customer and product, governance and stakeholder, and human. These are explained in detail in the Table 1.
3 SAM (Sustainable Asset Management) is an investment group focused exclusively on Sustainability Investment. Based on its Corporate Sustainability Assessment, SAM compiled one of the world's largest sustainability databases and analyzes over 1,000 listed companies annually (SAM, 2010).
Dec Apr Aug Dec Apr Aug Dec Apr Aug Dec Apr Aug Dec Apr Aug Dec Apr Aug Dec Apr Aug
93 94 94 94 95 95 95 96 96 96 97 97 97 98 98 98 99 99 99 00 00
Figure 8: Dow Jones Sustainability Group Index World vs. Dow Jones Global Index World (December 1993 - August 2000,
USD, Price Index)4
Table 1: DJSI Assessment areas
Focus Area Description
Strategy Integrating long-term economic, environmental and social aspects in their business strategies while maintaining global competitiveness and brand reputation.
Financial Meeting shareholders' demands for sound financial returns, long-term economic growth, open communication and transparent financial accounting.
Customer & Product Fostering loyalty by investing in customer relationship management and product and service innovation that focuses on technologies and systems, which use financial, natural and social resources in an efficient, effective and economic manner over the long-term.
Governance and Setting the highest standards of corporate governance and stakeholder Stakeholder engagement, including corporate codes of conduct and public reporting. Human Managing human resources to maintain workforce capabilities and employee
satisfaction through best-in-class organizational learning and knowledge management practices and remuneration and benefit programs.
DJSI yearly reviews the 10% leading sustainability companies in each of the 64 industry groups. Throughout the year the companies are continuously monitored and, if necessary, down rated or excluded from the Index. A variety of sources are used for the assessment and for cross-checking of information, including company questionnaires, company documents, publicly available information, 4 Dow Jones Sustainability Group Index World (DJSGI World) is one of many Dow Jones Sustainability Indexes.
DJSGI World covers the top 10% of the biggest 2,500 companies in the Dow Jones Global Total Stock Market Index in terms of economic, environmental and social criteria. This index was first published on 8 September 1999 (DJSI, 2010).
stakeholder relations, media screening and company interviews. The selection process is externally verified and the methodology is reviewed yearly to capture the increasing knowledge and
standardization of sustainability issues to align it with ongoing initiatives such as the Global Reporting Initiative. Below is an example of such assessment for aerospace and defense companies (Figure 9) (DJSI, 2010).
As of September 21 2009
Company Country Sector DJSI World DJSI STOXX DJSI North America DJSI Asia/Pacific
Leader Universe Member Universe Member Universe Member Universe Member
Number of Companies 33 3 14 3 14 4 1 0
BAE Systems United Kingdom ___
Bombardier Inc. Canada
EADS NV France
Rockwell Collins Inc. United States ?
Rolls-Royce Plc United Kingdom _____ ____
The Boeing Co. United States _
United Technologies Corp. United States _ _
Figure 9: Sustainability Leaders in Aerospace and Defense category as of September 21, 2009s Other sustainability rating agencies include Carbon Disclosure Project, Innovest, Environmentally responsible Mutual Fund, IRRC, EPA's Green Power Partnership, Robert's Environmental Center, Social Funds, CRO's 100 Best, and many others including SAFE.
2.3
Sustainability Evaluation via Fuzzy Logic
One of the methods of evaluating corporate sustainability is via fuzzy logic. Sustainability Assessment by Fuzzy Evaluation (SAFE) is a model, which uses fuzzy logic reasoning and basic indicators of
environmental integrity, economic efficiency, and social welfare to derive measures of human, ecological, and overall sustainability (Andriantiatsaholiniaina, 2003), (Phillis Y. A., 2000), (Phillis Y. A., 2008).
According to the SAFE methodology, the overall sustainability (OSUS) of the system whose development is in question has two primary components: an ecological system (ECOS) and a human system (HUMS). The ecological system depends on four secondary inputs: air, water, and land, while human system
depends on four additional secondary inputs: policies, health, and wealth. Each of the secondary inputs has three inputs: status, pressure and response. Each of the secondary components encompasses
tertiary inputs or components. The tertiary inputs depend on any number of basic indicators (Figure 10). OSUS ECOS HUMSl 2 AIR --- POLICY 4-10 3 11
4-o- LAND - -WEALTH 1
13
6 -- WATER HELH 1
Figure 10: Hierarchical structure of SAFE model.
In this methodology Andriantiatsaholiniaina uses an interesting method of employing pressure, status and response types of variables, which will also be used in NP-SAFE. "To evaluate the secondary components, we adopt the Pressure- State-Response (PSR) approach (Organization for Economic Co-operation and Development (OECD), 1991), which was originally proposed to assess the environmental component of sustainability (see (Spangenberg, 1998) for a review and discussion of variants of this approach). Specifically, the SAFE model uses three quantities to describe each secondary component: PRESSURE, STATUS and RESPONSE, called tertiary components. STATUS describes the current overall state of a secondary component we want to assess. It is a function of a number of indicators, which we call basic, because they act as primitives when we compute composite indicators such as PRESSURE,
STATUS and RESPONSE [...]. PRESSURE is an aggregate measure of the changing forces human activities
exert on the state of the corresponding secondary component. Finally, RESPONSE summarizes the environmental, economic, and social actions taken to bring pressure to a level that might result in a better state" (Andriantiatsaholiniaina, 2003). The PSR model is described in detail in Appendix J: The Pressure-State-Response (PSR) Model .
This is a powerful method of assessing sustainability. However there are several areas, which can be improved upon. For example, GRI guidelines provide a convenient and comprehensive structure for primary components and secondary inputs, which we can use in NP-SAFE model. The overall
sustainability therefore in NP-SAFE will comprise three primary components: economic, environmental and social. Each of these could be further broken down into sub components of secondary inputs. This research develops a new approach (NP-SAFE) based on SAFE to address to incorporate GRI structure.
2.4
NP-SAFE Assessment Model
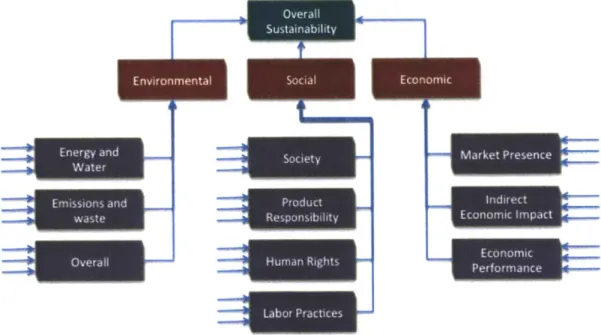
NP-SAFE can be thought of as fusion of GRI guidelines and SAFE model. The SAFE model provides the mathematical approach and structure of the evaluation technique and GRI guidelines provide content structure of the evaluation. General representation of hierarchical structure of NP-SAFE is shown in
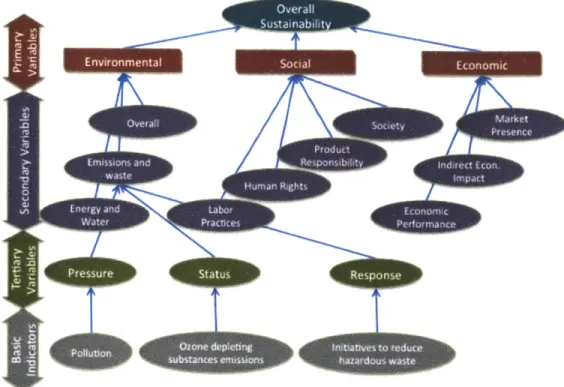
Figure 11. As one can see it has three components: Environmental, Social and Economic. Each of these has secondary components, which have tertiary components (not shown in the figure for simplicity). Chapter 3 explains the mechanics behind NP-SAFE including mathematical concepts involved, such as fuzzy logic, and chapter 4 describes the structure of the model in detail. Fuzzy logic is a key tool used in SAFE and NP-SAFE, which allows effective handling of such vague concept as sustainability.
Figure 11: Hierarchical structure of NP-SAFE model.
2.5
Chapter Summary
In this chapter the reader is familiarized with four sustainability assessment frameworks and
methodologies. The first one is GRI guidelines, which is a comprehensive framework developed by well-established organization and used by major corporations worldwide to report on their sustainability
performance. However the framework is not a quantitate tool and cannot be used for comparative analysis and ranking of companies based on their sustainability.
Next DJSI rating system is presented. This is a great example of quantitate ranking system used by many major corporations. However the system is privately developed and maintained. It is not transparent to public and any not-participating companies. It cannot be applied autonomously and provides no insight into how current sustainability state can be practically improved.
SAFE, another quantitative assessment methodology, is presented next. This a great quantitative tool, which an entity can apply and assess its current sustainability state, compare to peer entities, identify areas for improvement and develop practical recommendations. However this tool is not well suited for corporations and it is not comprehensive enough as it only looks into environmental impact on air, land and water and the state of wealth, health and policy of human system.
Lastly NP-SAFE is reviewed and shown to have the missing qualities of the previous frameworks: it has comprehensibility of GRI guidelines, quantitativeness of DJSI, and practicality of SAFE. The qualitative structure of NP-SAFE is discussed in detail at the end of the chapter, however the quantitative part of it is yet to be explained in Chapter 4. Before this can be done successfully the reader needs to be familiar with such technical concepts as fuzzy logic, fuzzy sets, membership function, logical operators and if-then rules. These are the foundation of the NP-SAFE quantitative evaluation.
Chapter 3: Fuzzy Logic
3.1
Introduction to Matlab and
Fuzzy
Logic
This chapter intends to justify the usage of Fuzzy Logic and Matlab. Fuzzy logic sometimes appears exotic or intimidating, but once you become familiar with it, it seems almost surprising that no one attempted it sooner. Fuzzy logic is a form of multi-valued logic derived from fuzzy set theory to deal with reasoning that is approximate rather than precise. In contrast with "crisp logic", where binary sets have binary logic, fuzzy logic variables may have a truth value that ranges between 0 and 1 and is not
constrained to the two truth values of classic propositional logic. Furthermore, when linguistic variables are used, these degrees may be managed by specific functions (Harris Interactive, 2010).
"Precision is not truth." - Henri Matisse
"Sometimes the more measurable drives out the most important." - Rene Dubos
"Vagueness is no more to be done away with in the world of logic than friction in mechanics." - Charles Sanders Peirce
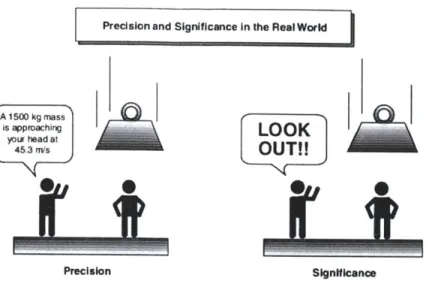
Fuzzy logic is all about the relative importance rather than precision. Additionally sustainability is an inherently vague concept whose scientific definition and measurement still lack wide acceptance. Fuzzy logic is well equipped to handle such vague concepts (Figure 12Figure 12: Precision vs. Significance (from (MathWorks, 2010)
Precision and Significance In the Real World
A 1500 kg mass
is appmaching
LOOK
yotshead atOU!
Precision Significance
Figure 12: Precision vs. Significance (from (MathWorks, 2010).
Matlab R2006b (version 7.3.0.267) is used for this research. It is a numerical computing environment and fourth generation programming language. Although Matlab is intended primarily for numerical computing, it also has symbolic computing capabilities. An additional package, Simulink, adds graphical multi-domain simulation and Model-Based Design for dynamic and embedded systems. The software comes with a toolbox, which includes Fuzzy Logic Toolbox, with help of which fuzzy interference systems can be created and integrated with Simulink. This toolbox relies heavily on graphical user interface (GUI) tools (MathWorks, 2010).
3.2
Fuzzy Sets
A fuzzy set is a set of without so called crisp, clearly defined boundary and it can contain elements with only partial degree of membership (see section 4.3). For example, consider a set of percentage of
employees trained. It wholly includes or wholly excludes any given element. Such as 0%, 50%, and 100%
employees trained would be wholly included, while 20 children and 13 retirees are wholly excluded. This is an example of a classical set. Now consider a different example, a fuzzy set of effective employee
training program. In this set 100% of employees trained is included in the set, while 0% is excluded.
However, what about 50%? Would it be included or excluded? Fuzzy set allows you to include into the set such borderline value with a certain membership grade, ranging from 0 to 1. In this particular example we can say that 100% employees trained is included in effective employee training program with a membership of 1, which is maximum; 50% employees trained is included with a membership grade of 0.5; and 0% employees trained is included with a membership grade of 0, which is minimum.
Essentially crisp sets could be viewed as sets allowing membership grades only equal to 0 or 1. To better understand membership grades lets introduce a concept of membership functions.
3.3
Membership Functions
A membership function is a curve that defines each point in the input space is mapped to a membership value (membership grade) between 0 and 1. For example, a sinusoid could be used to describe
membership function of effective employee training program. This definition allows to define smaller percentage of trained employees as being less effective and higher as being more effective (Figure 13).
Employee Training Program
W 1 0.8 to a. 0.6 TV 0.4 S0.2
02-
I0 0% 20% 40% 60% 80% 100%Percentage Employees Trained (%)
Figure 13: Membership function of Employee Training Program
For comparison let's come back to a crisp set. Suppose we define that any program with more than 30% trained employees as an effective program. Therefore our membership function would look as depicted
in Figure 14 - all programs with less than 30% trained employees will be ineffective and those that are above are effective. This example illustrates the weakness of crisp sets, when it comes to reality. If a program has 29.9% trained employees it would be considered ineffective, while if it has 30.1% it would be considered effective. In reality though both of these programs are almost the same. Now consider a third program with 95% of trained employees. With crisp sets it would be just as effective as 30.1% program, but in reality it is significantly more effective! Fuzzy sets allow you to avoid those kinds of problems and define reality in a more meaningful manner.
Employee Training Program
S0.8ft- -to c. 0.6-0.4
-0.2 0 0% 20% 40% 60% 80% 100%Percentage Employees Trained (%)
Figure 14: Crisp membership function of Employee Training Program
To summarize fuzzy set allows you to describe vague concepts (effective employee training program) and admits the possibility of a partial membership (50% is sort of effective, but there is a great deal of room for improvement). The degree of a value belonging to a fuzzy set is denoted by a membership grade ranging from 0 to 1. And finally, a membership function associated with a given fuzzy set maps an input value to its appropriate membership grade (MathWorks, 2010).
3.4
Logical Operators
Logical operator or connective is a symbol or a word used to connect logical statements. All logical connectives can be expressed as a function also called a truth function. Some of the most commonly used logical operators are conjunction (AND), disjunction (OR), and negation (NOT). These connectives also used for fuzzy logic. Since fuzzy logic reasoning is essentially a superset of standard Boolean logic operators work in similar way. Just as it were the case with membership grades, if we keep the values at their extremes of 1 (completely true) and 0 (completely false), standard logical operations will hold (Figure 15).
A B Aard8 A B AorB A notA
0 0 0 0 a a 0
0 1 0 0
1 0 0 1 01 1]
11 1 1 1 1
AND
OR
NOT
We can also note that AND operator is just a MIN function (min(A, B)), OR operator is MAX function
(max (A, B)) and NOT operator is (1-A) function. Now that this is established, the same rules can be
extended to fuzzy logic (Figure 16). Please note that in this example membership functions of variables A and B are arbitrary. Using these newly defined operators for fuzzy sets we can now describe If-Then
rules (MathWorks, 2010).
A And
/AA
BU A
AND OR NOT
mrdn(A,B) max(A,B) (1-A)
Figure 16: Two-valued logic (Boolean) and multi-valued logic (fuzzy) (from (MathWorks, 2010)).
3.5
If-Then Rules
With understanding of fuzzy sets and fuzzy operators we can now form if-then rule statements, which are used to formulate the conditional statements that comprise fuzzy logic. A single fuzzy if-then rule assumes the form if x is A then y is B, where A and B are linguistic values defined by fuzzy sets on the ranges X and Y respectively. An example of such a rule might be if water scarcity is severe then pressure
on corporations to conserve it is high. Note that severe is represented as number between 0 and 1, and high is also an output number between 0 and 1. This would represent a typical If-Then rule. Of course high and severe would have to be defined through membership functions first in order for us to use the
rule. A more detailed example is provided in Appendix E.
3.6
Chapter Summary
Chapter 3 introduced the concept of fuzzy logic and justified the usage of this powerful tool over other suitable options. The ability of fuzzy logic to favor significance over precision, the capability to deal with ambiguous concepts such as sustainability, flexibility in evaluation options are just some of the reasons
to use it. Other related concepts such as fuzzy sets, membership functions, logical operators and if-then rules are also introduced in this chapter. These should help the reader understand how evaluation is done in NP-SAFE.
The following chapter introduces NP-SAFE model in its full glory. Based on the readers understanding of the qualitative framework explained in chapter 2 and quantitative concepts introduced in chapter 3 chapter 4 brings the two together and describes NP-SAFE in full detail.
Chapter 4: Model Development
4.1
Model
Description
When corporate sustainability of a company is assessed the model used should be tuned to the industry, in which the company operates. Despite such customization certain ground rules exist, such as those described in GRI. Below is the description of a model, based on SAFE model (described in (Phillis Y. A.,
2008) and tailored to assess Raytheon's sustainability, from now on referred to as NP-SAFE model (Figure 17, Figure 18).
4.2
Basic sustainability indicators6
Overall sustainability (OSUS) comprises three primary components: economic (ECONi), social (SOCi) and environmental (ENVi). Such breakdown is consistent with the one described in GRI guidelines and heavily relies on it for further category breakdown. There are however some differences. For example, GRI guidelines divide all reporting in 5 categories: Economic, Environment, Homan Rights, Labor Practices and Decent Work, Product Responsibility, and Society, while in NP-SAFE the last three are united into social component. Similar differences occur in other areas, but while some categories could be combined, none are omitted.
6 All intermediate variables are calculated except for basic indicators, which is raw data drawn from primary
Figure 17: Primary, secondary, tertiary variables and basic indicators organization in NP-SAFE (some tertiary variables and basic indicators are omitted for simplicity).
The economic dimension has three secondary components: Economic Performance (EconP), Market Presence (MP), and Indirect Economic Impact (IEI). The social dimension has four secondary
components: Human Rights (HR), Labor Practices and Decent Work (LA), Product Responsibility (PR), and Society (SOC). The environmental dimension has three secondary components: Water and Energy (WE), Emissions, Waste, and Recycling (EEWR), and Overall (Overall), which includes biodiversity, products and services, compliance, and transport. These are discussed in more detail in the next sections.
For companies that already report on its sustainability using GRI framework it should be fairly easy to conduct an evaluation using NP-SAFE. However to help them to migrate GRI reported data to NP-SAFE inputs an effort was made to increase traceability of the inputs. Therefore codes from the GRI guidelines are used as the codes for tertiary variables (explained below) for all three dimensions (economic, social and environmental). If a question was split into several questions its original code was used with an additional letter after it, indicating that there is more than one questions originated from this source. For example, LA13 from GRI guidelines appears as LA13A and LA13B in the tertiary indicators.
b
7
-,"own
Otorte depicting u b-s1a:ni-or"bstances ernissions
4.3
Tertiary, secondary and primary variables
To assess each of the secondary components mentioned above, we use tertiary variables. There are three types of tertiary variables for each of the secondary components in each of the three dimensions. The types are pressure, status and response, which is consistent to the approach employed in SAFE (and is the standard framework for the presentation of environmental information in terms of indicators of the pressures that human activities exert on the environment, of the state of he environment, and of society's responses (Organization for Economic Co-operation and Development (OECD), 1991)). In its turn each of the types of tertiary variables is calculated from a number of basic indicators. The reason for division of the tertiary variables into three groups is to provide adequate weighting. For example,
secondary variables Market Presence and Indirect Economic Impact (
Table 2 and Table 3) have 6 and 4 basic indicators respectively, however each of these secondary variable should have equal importance. Therefore each basic indicator in a variable containing six of them should weigh less. However instead of simply proportioning the importance of each basic indicator we bin them into three types of tertiary variables, such as pressure, status and response. This allows lumping of the similar types of indicators together, while assigning equal importance to each bin. This way of dividing basic indicators also allows decreasing of weight of similar indicators while keeping the high level of importance of distinctive ones. The PSR model is also described in Appendix J: The
Pressure-State-Response (PSR) Model . The actual evaluation rules are discussed later in the chapter. Basic indicators are selected from the pool of sustainability indicators described in GRI guidelines
(Appendix A: Economic Indicators (Global Reporting Initiative, 2010)). Each of the indicators was
evaluated for applicability to Raytheon and then, if determined applicable, either used as is or modified to be a quantitative question. Comment column provides explanations as to how the question was modified. For example, a qualitative question EC7 from GRI guidelines (Proceduresfor local hiring and
proportion of senior management hired from the local community at significant locations of operation)
was split into two quantitative questions: EC7A (Existence of procedures for local hiring), which is a Yes/No question and EC7B (Proportion of senior management hiredfrom the local community at
significant locations of operation). Yes or No questions receive a full credit if disclosed and all other
questions are assigned corresponding membership grades (data treatment is discussed in section 4.5). Resulting questions are sorted by presumed function and composed into a survey (Appendix D).
Table 2: Example of sustainability indicators and computation of the quantitative value of the secondary variable TMP for a hypothetical company (MP is Market Presence, P is Pressure, S is Status, and R is Response).
Indicators for MP Min( v) Max6(v) Target6, T(v) Data
(v)
Nfv 8PRESSURE indicators
Globalization (globalization)
0.00
100.00
0.00
35.00
0.650
Trust Erosion (trusterosion) 0.00 100.00 0.00 81.00 0.190
N(MPP) = 0.363 (after
fuzzy
inference calculations using MA TL AB)STATUS Indicators
Minimum entry-level wage (EC5) 0.00 21,549 21,549 18,720 0.869
Percentage of senior management hired
0.00
10000
100
100.00
1.000
form local community (EC7B) 00100.00 1
N(MPS) = 0.798 (after fuzzy inference calculations using MATLAB)
RESPONSE indicators
Percentage of spending on locally based 0.00 100.00 100.00 13.40 0.134 suppliers (EC6)
Existence of procedures for local hiring 0.00 1.00 1.00 0.00 0.000
(EC7A) 0 1 1 0
N(MPR) = 0.202 (after fuzzy inference calculations using MA TLA B)
Table 3: Example of sustainability indicators and computation of the quantitative value of the secondary variable TI,, for a hypothetical company (IEI is Indirect Economic Impact, P is Pressure, S is Status, and R is Response).
Indicators for IEI Min(v) Max(v) Target, T(v) Data (v) N(v)
PRESSURE indicators
Climate Change (climate_change)
0.00
5.20
0.00
0.76
0.854
Trust Erosion (trusterosion) 0.00 100.00 0.00 81.00 0.190
N(IEIP) = 0.500 (after
fuzzy
inference calculations using MATLA B)STATUS Indicators
Infrastructure investments and services 0.00 10.00 10.00 0.00 0.000
provided primarily for public benefit though commercial, in-kind, or pro bono engagement
(EC8)
N(EC8)(S) = 0.00 (after fuzzy inference calculations using MATLAB)
RESPONSE indicators
Indirect Economic Impact Assessment (EC9) 0.00 1.00 1.00 0.00 1.000
N(EC9)(R) = 1.00 (after
fuzzy
inference calculations using MATLAB)One might note that some of the indicators, particularly of pressure type, are used more than once for different secondary variables. This practice is consistent with PSR model described in Appendix J: The
Pressure-State-Response (PSR) Model and Appendix K: OECD Core Set of Environmental Indicators. For
Determination of minimum, maximum and target values are described in section 5.1.3.
example, SOx and NOx emissions is used under Urban environmental quality and Acidification. Although this is true that multiple use of the same indicator gives additional weight to it, it could also be argued that if a particular indicator fuels multiple problems it should be given additional weight. Therefore this
practice of using an indicator more than once is upheld in current work.
4.4
Additional Indicators
After carefully analyzing all available indicators lack of pressure indicators in many categories was discovered. Although the NP-SAFE could be built with only a few pressure indicators the author believed it would make the model incomplete. Additional research was therefore required and to remedy the situation and such indicators were included. There are a number of credible sources, where additional pressure indicators could have been taken from, Organization for Economic and Co-operation and Development is one of which (Organization for Economic Co-operation and Development (OECD), 1991). However given the emphasis on corporate sustainability rather than just environmental assessment a different source was used. Based on literature research (Willard, 2005) pressure indicators we selected and are identified below:
1. Climate change (Reduce company greenhouse gas (GHG) emissions to below regulatory
requirements. Go further than required and build carbon credits as potential source of revenue. Declare zero net GHG emissions as a company goal and inspire employee innovation to help meet that target imaginatively)
2. Water scarcity 3. Food Insecurity 4. Health
5. Pollution (Work on upstream sources of hazardous waste by replacing hazardous materials and chemicals with more benign substitutes. Reduce and recycle, using closed-look process. Take back products at the end of their useful lives to reuse components. Move from outright sales to leasing products. Declare zero waste as a company goal)
6. Energy Crunch (commit to alternative green energy. Work aggressively with NGOs and governments to change perverse subsidies for fossil fuel providers to equitable treatment for alternative renewable-energy providers and users. Consider a company goal of being off the
utility grid.
7. Globalization Backlash (Work with industry trade organizations like World Trade Organization, the World Economic Forum, the International Monetary Fund, and the World Bank to improve