Publisher’s version / Version de l'éditeur:
Heating, Piping, Air Conditioning, 5, pp. 155-158, 1955-05-01
READ THESE TERMS AND CONDITIONS CAREFULLY BEFORE USING THIS WEBSITE. https://nrc-publications.canada.ca/eng/copyright
Vous avez des questions? Nous pouvons vous aider. Pour communiquer directement avec un auteur, consultez la première page de la revue dans laquelle son article a été publié afin de trouver ses coordonnées. Si vous n’arrivez pas à les repérer, communiquez avec nous à PublicationsArchive-ArchivesPublications@nrc-cnrc.gc.ca.
Questions? Contact the NRC Publications Archive team at
PublicationsArchive-ArchivesPublications@nrc-cnrc.gc.ca. If you wish to email the authors directly, please see the first page of the publication for their contact information.
NRC Publications Archive
Archives des publications du CNRC
This publication could be one of several versions: author’s original, accepted manuscript or the publisher’s version. / La version de cette publication peut être l’une des suivantes : la version prépublication de l’auteur, la version acceptée du manuscrit ou la version de l’éditeur.
Access and use of this website and the material on it are subject to the Terms and Conditions set forth at
A method for determining winter design temperatures
Thomas, M. K.
https://publications-cnrc.canada.ca/fra/droits
L’accès à ce site Web et l’utilisation de son contenu sont assujettis aux conditions présentées dans le site LISEZ CES CONDITIONS ATTENTIVEMENT AVANT D’UTILISER CE SITE WEB.
NRC Publications Record / Notice d'Archives des publications de CNRC:
https://nrc-publications.canada.ca/eng/view/object/?id=7369f871-51db-4d66-a09e-89c5f0e9e2e3 https://publications-cnrc.canada.ca/fra/voir/objet/?id=7369f871-51db-4d66-a09e-89c5f0e9e2e3N A T I O N A L R E S E A R C H C O U N C I L
C A N A D A
D I V I S I O N O F B U I L D I N G R E S E A R C H
A
METHOD
FOR
DETERMINING
by
MORLEY K. THOMAS
(Meteorological Division, Department of Transport
1
,
. C1-2:
REPRINTED F R O MM A Y 1 9 5 5
CCT
26
11955
1 '
RESEARCH PAPER NO.
16
OF THE
DIVISION OF
BUILDING RESEARCH
OTTAWA
T H I S publication is being distributed by the Division of Build-
ing Research of the National Research Council as a contribu-
tion towards better building in Canada. It should not be repro-
duced in whole or in part, without permission of the original
publisher. The Division would be glad to be of assistance in ob-
taining such permission.
Publications of the Division of Building Research may be
obtained by mailing the appropriate remittance, (a Bank,
Ex-
press, or Post Office Money Order or a cheque made payable
at par in Ottawa, to the Receiver General of Canada, credit Na-
tional Research Council) to the National Research Council, Ot-
tawa. Stamps are not acceptable.
A
coupon system has been introduced to make payments for
publications relatively simple. Coupons are available in denom-
inations of 5, 25, and 50 cents, and may be obtained by making
a remittance as indicated above. These coupons may be used for
the purchase of all National Research Council publications in-
cluding specifications of the Canadian Government Specifications
Board.
A Method
for
Determining Winter
Design Temperatures
By
M.
K. Thomas", Toronto, Ont., CanadaA WINTER design temperature may be broadly defined as the coldest tem- perature which is likely to recur frequently enough during the aver- age winter to justify its use in the de- sign of heating systems for structures. These temperatures are used in cal- culating the heat loss which such sys- tems may be called upon to overcome iri normal operation.
While winter design temperatures have been used for some time in Canada, IIO one has as yet published
a method by which these tempera- tures may be selected on a systematic basis across the country. In the past some designers have used values ob- tained by adjusting the extreme or
SUMMARY-A logical method
of arriving at winter design tem- peratures for Canadian condi- tions is described. The method makes use of the probable fre- quency of occurence of low tem- peratures during January. A tab- ulation of design temperatures on four different bases of fre- quency of occurrence is pre- sented for
15
Canadian localities and these temperatures are com- pared with the design tenipera- tures in common use. An outline map of Canada with winter de- sign temperature lines is in- cluded. It is shown that at Toron- to and Montreal, city weather stations report winter tempera- tures slightly higher than those read at the adjacent airports.cided to select design temperatures on the bases of four probabilities (1, 21/2, 5 and 1 0 percent) so that the designer might have a choice accord- ing to the heat capacity and the use of a builcling. Considering the volume of calculations involved in obtaining these design temperatures, it was also decided to base them on conditions during the coldest month of the year only. Accordingly, the following def- inition was adopted : Winter design temperatures for bases of 1, 21/2,
5
and 1 0 percent are the temperalure values expressed in Fahrenheit de- grees at or below which 1, 21/2,
5
and 1 0 percent of the January hourly outdoor temperatures occur.
average minimum temperatures ac-
cording t~ a rule, while others have the revised National Building Method
estimated values directly. I n the Code of Canada, it was necessary to January is usually the coldest ~ r e ~ a r a t i o l l of winter design tern- devise a logical method for obtain- month of the year throughout most of Perature charts for the Climate Part' ing these temperatures and to give Canadat. Normal January tempera-
a specific definition to a Canadian tures range from
+lo
to +25 deg in-
' D e ~ u t v Suoerintendent. Climatoloaical Serv- winter design temperature.
-
ices, kiteorological Division. Department of
-
tPebruag average colder only in Southern Transport. At the first meeting of the Techni- Ontario ova Scotla and New Poundland where For presentation at the Semi-Annual Meeting committee on Climate for the the difference varies from 0 to, -2 deg and in of the AMERICAN SOCIETY OP HEATING AND AIR- the Arct~c Islands where the d~fferences are 0 to C O N D I ~ O N I N G ENGINEERS, San Francisco, Calif., National Building Code, it was de- -6 deg. Most differences, except in the Arctic.June 1955. are 1 deg or less.
to accumulate the temperature fre- tion of the stations for which design quencies from the lowest tempera- temperature values were obtained.
&iwtzd@
Scfion
ture up to the desired percentage To obtain these regional relation- level. The frequency distribution of ships, monthly mean temperatures the more densely settled portion of 7,440 January hourly temperatures at and standard deviatio:is were cal- Eastern Canada, from-5
to +15 Ottawa is shown in Fig. 1. The posi- culated from the 35 locations for the deg in the southern Prairie Provinces tion of the 74th 1owest temperature 10-year period 1941:1950. Standard and from 4- 15 to+
35 deg in set- is indicated as the 1 Percent level, the deviations in Southern Canada were tled British Columbia. While a longer 186th as the Z1/2 percent level, the about 3 deg along the Atlantic Coast period of time would have been de- 372nd as the5
percent level and the ant1 increased steadily to 13 deg i n sirable, the 10 Januaries from 1941 744th as the 10 percent level. The Alberta and interior British Colum- to 1950 inclusive, were chosen as a 50 percent level and the mean Janu- bia and then decreased to5
(legary temperature for the same 1941-
Fig. 1-January hourly temperature fre- quencies at Ottawa, Ont., for the period 1941-1950. Temperature frequencies have been accumulated from the coldest tem- perature upward to indicate the 1: 2?4, 5, 10, and 50 percent levels
basis for this study. However, the period proved to be fairly representa- tive, as the departures from normal of the mean January temperature during this period were mostly with- in the range -1 to + 2 deg in set- tled Southern Canada and + 4 to -2 deg in Northern Canada. The largest departures from the long term normal occurred in the sparsely settled Mac- kenzie Valley and Yukon Territory. The first step was to analyze the hourly temperature frequencies from 10 representative locations. The hour- ly temperature records for 100,000 observations were transferred to punched cards for machine analysis, from which it became apparent that more information was needed. Hour- ly temperature frequencies for an ad- ditional 2 5 stations were then ob- tained by clerical methods for the coldest 10 percent of the hours.
To obtain design temperatures for the desired (or any) percentage level at these 35 stations, it was necessary
1950 period are also shown.
In order to obtain a more com- plete coverage of the country, a mem- ber of the National Building Code Committee on Climate, H.C.S. Thom of the
U. S.
Weather Bureau sug- gested the use of a relationship be- tween ( 1 ) the variability of January monthly mean temperatures, and ( 2 ) the difference between the monthly mean temperature and the design temperature. As Canada is divided into several regions according to the type of temperature frequency dis-tribution, the use of several regional ~
..
i 2~~~~~~~ ~ . hourlv temDeraLure Ile-relationships was suggested. Fig. 2 il- quencies at ~a;lcouver: B.
k.,
Edmonton,lustrates the different types of tern- and Moncton, N. B.9 for the period
1941-1950. The curves have been smoothed
~ e r a t u r e distribution and indicates the need for regional relationships.
The Vancouver frequency distribu- along the Pacific Coast. I n Northern tion illustrates the compact distribu- Canada the values exceeded 8 deg tion of hourly temperatures typical in the Eastern Arctic decreasing to of the maritime climate along the 4 deg in the Western Arctic.
Pacific Coast which was also found The standard deviation value for to exist in the Great Lakes region of each station was plotted against the southern Ontario. The broad Edmon- difference between the mean tem-
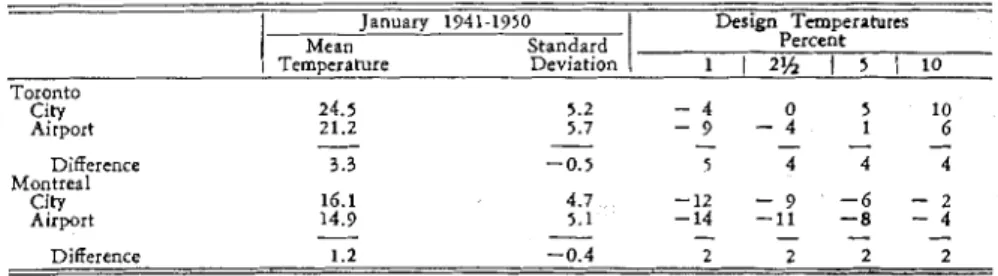
Table 1-Comparison 01 City and Airport Winter Design Temperatures at Toronto and Montreal (Fahrenheit degrees)
Toronto 24.5 5.2 - 4 0 5 10 i%o1t 21.2 5.7 - 9 - 4 1 6 January 1941-1950
I
Mean Standard Temperature Deviation-
--
-- -
Difference 3 . 3 -0.5 5 4 4 4 Montreal City 16.1 4.7 -12-
9 - 6-
2 Airport 14.9 5.1 -14 - 1 1 - 8-
4 Design Tcmperaturcs Percent 1 I 2% I 5 1 1 0-
-
-
-- -
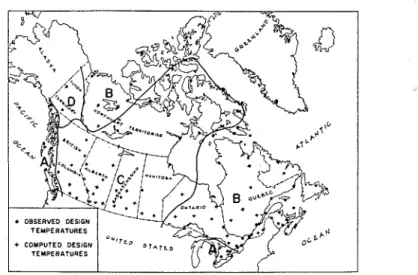
Difference 1.2 -0.4 2 2 2 2ton distribution is representative of peratlire and the known 21h percent the continental climate in Western design temperature. These plots and Canada, while the intermediate Monc- the resulting lines of best fit are ton distribution is typical of stations shown in Fig. 4. An excellent rela- in Eastern Canada. Fig. 3 shows the tionship was apparent for the West- different regions into which the coun- ern Canada stations. The three plots try was divided along with the loca- which do not lie along the line (C) Heating, Piping & Air Conditioning, May 1955
represent stations on the edge of this standard deviations were calculated region. The Eastern Canada plots for an additional 80 stations for the were more scattered than the first period 1941-1950. Knowing the group but are represented fairly well standard deviation and using the pro-
Fig. %Zones of regional relationships and location of stations from which data were used
by line
(B).
Although the method per regional relationship line, the dif- of least squares was used to obtain ference was read off between the the original relationship lines it was mean temperature and the 2% per- found that satisfactory lines could be cent design temperature. Since the drawn by inspection of the plotted mean temperature was also known, points. The values for the Maritime the calculated design temperatureFig. &Regional relationships between standard deviation ( U X ) and the difference between the mean temperature and the winter design temperature
-
2% percent basisstations were bunched and so the line (A) was given the same slope as
( B ) .
Similarly a line(D)
was drawn through the single Yukon stations which was parallel to the relationship line (C).To utilize these relationship lines, January mean temperatures and
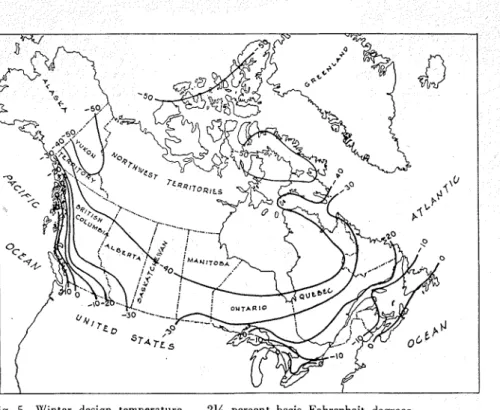
was obtained by subtracting the pre- viously mentioned difference from the mean temperature. The data from stations near the boundaries of differ- ent zones were adjusted accordingly as were data at stations with known unusual climatological characteristics. The design temperature values were
plotted and the chart shown i n Fig.
5 was drawn. In settled Southern Canada these values range from -35 deg in the interior to 0 deg on the Atlantic Coast and 1 0 deg on the Pacific Coast.
Similar procedures could have been used to obtain relationships for the 1, 5 and 1 0 percent levels. This was attempted but it was found to be just as accurate if values were estimated usirlg, with necessary ad- justments, the basic relationships al- ready found. 111 each region there were several locations where the ex- act frequencies were known for the lowest 1 0 percent of the temperatures. These observed design temperatures were used as reference points in esti- mating values for the other eighty lo- cations. The resulting charts a r e sirni- lar in appearance to the 2% percent basis chart and are not shown here.
Comparison of City and Airport Design Temperatures
As hourly temperature data were available for city and airport sta- tions at Toronto and Montreal, winter design temperatures were obtained for these stations and are shown in Table 1. As a result of the urban in. fluence, city temperatures in the win- ter are usually slightly higher than those at adjacent airports. Since these two cities are the largest metropolitan areas in Canada, larger city-airport differences are not expected in other urban areas. At Toronto and Mon- treal, differences in design tempera- tures between city and airport sites are about one degree greater than the differences between mean tempera- tures.
Comparison of TAC
97%
Per-cent Basis and Canadian 2%
Percent Basis Winter Design Temperatures
Many readers will be interested in seeing how the design temperatures as obtained by this Canadian method compare with design temperatures selected by the ASHAE Technical Heating, Piping & Air Conditioning, May 1955
Advisory Committee 97% percent basis. This latter temperature is de- fined as the hourly out-door tempera- ture which has been equalled or ex- ceeded 97% percent of the total hours irz December, January and February for the period of record.
The major difference is that the TAC method uses the three winter months instead of the single coldest month used in this paper. A minor difference in procedure is that the TAC method accumulates the tem- perature frequencies from the highest temperature down, while the method described here accumulates from the lowest temperature upward. A differ- ence of 3 deg was found between the two niethods at Toronto. The TAC 97?/2 percent value, based on Decem- ber, January and February is 4-3
deg, while the present method gives a value of 0 deg on the 2% percent level based on January temperatures alone.
Summary of Winter Design and Related Temperatures
In summary, Table 2 is a tabula- tion which lists for 1 5 Canadian cities various winter design, mean and extreme temperatures. The Canadian design temperatures are based on the period 194'1-1950 and where indicated are derived from airport temperature values. The standard temperature values are from 30-year records which are either entirely city records or a fairly ho- mogeneous combination of city and airport records.
Study of the tabulation reveals that apparently the design temperatures in common use have been selected with the mean animal minimum tem- perature in mind since there is close correlation. These temperatures in common use, while never as low as the 30-year extreme minimum tem-
Fig. 5-Winter design temperature - 2% percent basis Fahrenheit degrees
Table 2-Winter Design and Comparative Temperatures at 15 Locations in Canada (Fahrenheit degrees)
i
i 0 Year Standard V ~ l u c s Wlnter Design Temp"atatlono 1 1 2 % 1 r t Vancouver ( A ) , B C. 8 11 15 2 1 10 3 6 I ? Edmonton ( A ) . Altn. - 3 9 -33 - 2 9 - 2 1 - 4 0 0 Reglna ( A ) . Sask. - 3 9 -34 - 3 0 - 2 s - 8 - 3 9 -55 Church111 ( A ) , Man. -43 - 4 2 - 4 0 - 3 7 - - 1 6 2 - 4 3 - 3 9 -54 - 5 0 1Vinnipeg A ) , Man. -33 - 2 9 -25 - 2 1 - 3 s 1 Ottawa ( A \ . Ont. - 1 8 - 1 5 - 1 1 - 7 - 2 0 - 3 5 -44 Toronto Ont. - 4 0 5 10 - 1 0 24 12 - 2 6 - 7 - 3 8 -22 ~ o r t r e a ' l . \lue. -12 - 9 - 6 - 7
-
- 1 5 l S Quebtc, Oue. - 1 6 - 1 2 - 9 - 4 - 2 0 12 - 1 9 - 1 6 -29 -32 S ~ l n t lohn, N . 5 H l l r f a ~ . N . 5 . - 6 0 - 3 4 7 0 1 1 5 - - 2 0 - 1 2 - 2 1 - 6 - 3 32 Ch3rlottetown P.E.I. 0 4 - 1 0 19 - - - I 1 6 - ? I -23 St. John's ( A ) . Nfld. - 1 I 4 7 - 1 0 24 - 2 - 10 Goose 53y ( A ) , NHd. - 2 9 - 2 6 - 2 1 - 2 0-
Dawson. Y . 7 . - 6 -16 -so - 9 9 - 4 5 - 1 6 0 - 5 0 - 4 4 -35 - 7 1 , ," ( A ) indicates that observations were taken at the airport for the 10-year per~od 1941-1350.
bBased on January 1941-1950.
c H ~ ~ T I ~ G VENTILATING, AIR CONDITIONING GU!DE 1354 Chapter 12 245 ( ublished by
AMERICAN' SOCIPTV OF HEATING A N D AIR-CONDITIONING E ~ G I N E E R S , INC.,' d w York.
a.
Y.)h ee. Thiq-year standard values are based on the period 1321-1950 and are either entire1 city rec- ords or a f a x homogeneous combination of city and airport. The periods at Churchill. St. jbhn's and Goose Bay are ress than 30 years.
perature, are usually lower than both which position he was seconded from the 1 and 2% Percent basis desigll the Meteorological Division, Depart-
temperatures as selected in this study. ment of ~ ~~h~ paper is pub- ~ ~ ~ ~ ~ ~ t . lished with the approval of Andrew
Acknowledments Thomson, Controller of the Meteoro-
This paper records work done by the author in connection with the re- vision of the National Building Code of Canada. This was carried out as part of the author's duties as Cli- matologist to the Division of Build- ing Research of the National Re- search Council (1951-1953), to
logical Division and of R.