HAL Id: hal-03007230
https://hal.archives-ouvertes.fr/hal-03007230
Submitted on 16 Nov 2020HAL is a multi-disciplinary open access
archive for the deposit and dissemination of sci-entific research documents, whether they are pub-lished or not. The documents may come from teaching and research institutions in France or abroad, or from public or private research centers.
L’archive ouverte pluridisciplinaire HAL, est destinée au dépôt et à la diffusion de documents scientifiques de niveau recherche, publiés ou non, émanant des établissements d’enseignement et de recherche français ou étrangers, des laboratoires publics ou privés.
FUMSECK cruise report
S. Barrillon, Hubert Bataille, Nagib Bhairy, Caroline Comby, Théo Coulon,
Andrea Doglioli, Francesco d’Ovidio, Jean-Luc Fuda, Gérald Grégori, Anne
Petrenko, et al.
To cite this version:
S. Barrillon, Hubert Bataille, Nagib Bhairy, Caroline Comby, Théo Coulon, et al.. FUMSECK cruise report. [Technical Report] MIO-Mediterranean Institute of Oceanography, Aix-Marseille Université. 2020. �hal-03007230�
FUMSECK cruise report
St´
ephanie Barrillon
1, Hubert Bataille
2, Nagib Bhairy
1, Caroline Comby
1,
Th´
eo Coulon
∗1, Andrea Doglioli
1, Francesco d’Ovidio
3, Jean-Luc Fuda
1,
G´
erald Gr´
egori
1, Anne Petrenko
1, Ana¨ıs Ricout
†1, Louise Rousselet
‡1,
Melilotus Thyssen
1, and Roxane Tzortzis
11
Aix Marseille Univ., Universit´
e de Toulon, CNRS, IRD, MIO UM 110 ,
13288, Marseille, France
2
IRD,13572, Marseille, France
3
LOCEAN, UMR CNRS / Universit´
e P. et M. Curie / IRD / MNHM,
F-75005 Paris, France
Monday 29
thJune, 2020
Abstract
The FUMSECK cruise was a one-week technological cruise, which took place in spring 2019, in the gulf of Genoa (NW Mediterranean Sea), onboard the R/V T´ethys II. Its aim was to perform several technological tests of some instruments used for the study of the fine-scale processes and dynamics. It was conducted in preparation of the BioSWOT-Med cruise in the SW Mediterranean Sea in 2022, planned as part of the “Adopt a Cross Over” initiative organising simultaneous oceanographic cruises around the world during the SWOT fast sampling phase. During FUMSECK we tested various technological innovations for the study of fine-scale dynamics and their coupling with biogeochemistry.
∗student †contract ended ‡now at SCRIPPS
Aknowledgements
The scientific team is grateful to the CNFC for having supported the FUMSECK cruise, and to captain Jo¨el Perrot and the crew of R/V T´ethys II for their dedicated and enthusiastic help during the cruise, as well as to captain Dany Deneuve for his help in the preparation of the cruise.
We also acknowledge the DT-INSU La Seyne-sur-Mer: Malika Oudia for her help in the administrative work, C´eline Heyndrickx for the ADCP and TSG technical support and anal-ysis, Emmanuel Alessandrini and Jean-Louis Cohen for their help in the cruise preparation. Thanks to Aur´elien Courbe and Tanguy Lebreton from IFREMER for their help in the ad-ministrative preparation. Special thanks also go the DT-INSU Brest for material lending and help in the preparation from Robert Coffec, to Kevin Grangier form RDI for the Sentinel lending and expertise, to Thibaut Wagener and Elvira Elvira Pulido-Villena (MIO) for the pump lending and expertise, to Crist`ele Chevalier and Marc Pagano (MIO) for the SPOT units lending, to Estelle Donadio (L2 student) for her help in the preparation of the VVP ballasts, and to Andrew P. Dove (University of Birmingham) for the beads production.
Thanks to Genavir: Xavier Placaud, Olivier Fauvin and Pascal Pierre, for providing and assisting us with the MVP; and St´ephane Guiomar for onboard operations during the cruise. The MVP and associated captors have been bought by IFREMER and the LOPB with co-funding of the Centre Europ´een de Technologies Sous-Marines (CETSM Contrat de Projet Etat R´egion 20072013 en PACA) and the French ANR FOCEA (Project ANR09CEXC00601, M. Zhou and F. Carlotti). We also thank Laurent Froideval, Christophe Conessa and Lau-rent Benoit for the plane preparation, even if it has eventually been cancelled due to a radar problem, as well as Marie-Isabelle Pujol (CLS) for her help for Sentinel satellite tracks.
Thanks to Andreas Thurnherr for his help with the L-ADCP technique. We also aknowl-edge Pascal Lesage and Anne Casanova (MIO) for the various communications around the cruise. Thanks to the SATT Sud-Est for its investment in the first steps of an industrial valorisation of the ice-release system for the VVP. We also thank Nolwenn Danioux (IFRE-MER) for her help of the FUMSECK CNFC website, Fr´ed´eric Cyr for his work on the glider data, and Anthony Bosse joining the glider analysis effort.
We are grateful to the MIO SAM for their help in several aspects of the cruise prepa-ration, in particular to Deny Malengros, Michel Lafont, Dorian Guilleman and Christian Grenz; to Nicole Garcia for the nutrients analyses, to the MIO administrative team and in particular Brigitte Pantat, Dominique Poirot, and Aur´elia Lozingot, as well as Laurie Casalot for her help for the APA form; and to the SIP for their support in computing and networking.
This work as been performed within the MIO OPLC team and the Axe Transverse Couplage. The FUMSECK cruise has been supported by BioSWOT (PI Francesco d’Ovidio, funded by CNES), with the help from the Claim project (PI Melilotus Thyssen).
Contents
1 Introduction 4
2 Cruise 5
2.1 General view . . . 5 2.2 Way points and station points . . . 7 2.3 Cruise calendar . . . 7 3 SPASSO 9 4 ADCP 10 5 TSG and Fluorimeter 10 6 Cytometry 10 7 MVP 13
7.1 Rotative behaviour and connectics . . . 14 7.2 MVP profiles . . . 14
8 Vertical velocities 16
8.1 Sentinel V . . . 16 8.2 L-ADCP . . . 19 8.3 Comparison of the Sentinel 5th beam, 4 beams, and L-ADCP 4 beams . . . . 21
8.4 FF-ADCP . . . 23 8.5 VVP . . . 25
9 Biodegradable beads 27
10 Glider 30
11 Conclusion and perspectives 31
1
Introduction
The FUMSECK (Facilities for Updating the Mediterranean Submesoscale - Ecosystem Coupling Knowledge, https://doi.org/10.17600/18001155, PI S. Barrillon) cruise was a one-week technological cruise, from April, 30, 2019 to May, 07, 2019, in the gulf of Genoa in the NW Mediterranean Sea, onboard the R/V T´ethys II. Its aim was to perform several technological tests of some instruments used for the study of the (sub)meso-scale processes and dynamics (from 0.1 to 100 km for a lifetime from several days to several weeks).
This cruise is part of the BioSWOT international project supported by CNES (PI F. d’Ovidio, LOCEAN-IPSL, co-PIs A.M. Doglioli and G. Gr´egori, MIO), which develops the scientific exploitation of the future SWOT satellite observations (Surface Water and Ocean Topography, https://swot.cnes.fr/), by combining physical and biogeochemical oceanog-raphy with interdisciplinary in situ experiments around the SWOT mission in 2022.
In particular, the SWOT mission will allow the precise observation of the fine scale oceanic dynamics such as eddies and filaments. By their interactions, these fine scales could induce some ageostrophic and tridimensional dynamics [Capet et al., 2008, Ferrari and Wun-sch, 2009, McWilliams, 2016], which are a critical point for the understanding of the vertical exchanges [Ferrari, 2011]. Therefore, the fine scales play a key role in the oceans global bal-ance and, despite their low intensity, clearly impact processes such as the vertical transfer of nutritive elements and the carbon export [L´evy et al., 2001, Mahadevan, 2016, McGillicuddy, 2016]. However, their ephemeral nature complicates their in situ measurements, which are nevertheless essential for their understanding and for the confirmation of the models predic-tion and the satellite observapredic-tions. Furthermore, the vertical velocities being several orders of magnitude below the horizontal ones, their in situ measurements represents a real chal-lenge.
The FUMSECK cruise was conducted in preparation of the BioSWOT cruise in the Balearic sea in 2022, planned as part of the “Adopt a Cross Over” initiative organising si-multaneous oceanographic cruises around the world during the SWOT fast sampling phase [d’Ovidio et al., 2019]. During this cruise we tested various technological innovations for the study of fine-scale dynamics and their coupling with biogeochemistry.
First, we studied the MVP (Moving Vessel Profiler) instruments behaviour, focusing on the rotative behaviour of the MSFFFII (Multi Sensor Free Fall Fish, so called “big fish”) during its falling and raising, and the connectics for the whole data acquisition chain: be-tween the instrument and the MVP cable, bebe-tween the platform and the boat depth sensor, and between the platform and the PC used to analyse the data. One of the transects was synchronised to one of the S3B Sentinel satellite trajectories, allowing future comparisons between satellite and in situ data.
dif-ferent ADCP (vessel-mounted ADCP, L-ADCP and Sentinel V (5 beams) at fixed depth and in profile, FF-ADCP (Free Fall ADCP), the VVP (Vertical Velocities Profiler) prototype developed at MIO, and the MIO SeaExplorer glider.
Finally, we experienced the dropping, following, pumping and detection by cytometry of a sample of biodegradable micro-particles that mimic (in size and density) the phytoplankton, in order to study the physical part of the biological carbon pump. In addition, the distri-bution of phytoplankton functional groups at a small spatio-temporal scale was measured by automated flow cytometry with imaging. This technology is the only one that allows to compare the distribution of phytoplankton at fine scales in its hydrodynamic context.
The FUMSECK cruise benefited before, during and after the cruise from the automatic SPASSO treatment of the satellite data (https://spasso.mio.osupytheas.fr), with a onshore team analysing them and providing a daily bulletin with all the results and advices on the best route to meet fronts. Furthermore, audiovisual material was recorded all along the cruise in order to provide technical and general public documents.
2
Cruise
2.1
General view
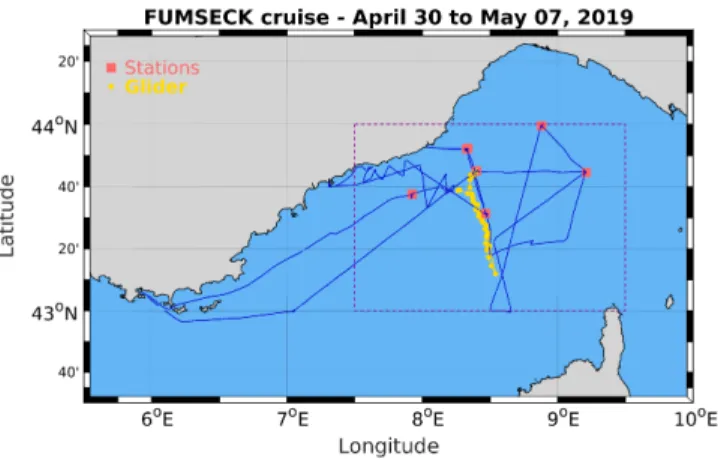
The FUMSECK cruise was performed from 30,April 2019 to 07, May 2019 onboard the R/V Th´etys II with captain Jo¨el Perrot. The experimental domain was between longitudes 7.5 and 9.5 and latitudes 43 and 44. The figure 1 shows the overall vessel route, the station positions and the glider trajectory.
Figure 1: FUMSECK cruise (blue). The geographical domain is shown in purple, the stations in orange squares, and the glider trajectory in yellow.
The vessel crew was the following: PERROT Jo¨el Commandant CLEMENT Laurent Chef m´eca MARTINEZ Jean-Luc Second LETORT Laurent Lieutenant LE MEUR Didier Cuisinier CRUBLE Gwenael Graisseur FONTENEAU Aur´elien Bosco
The scientific team was the following: • onboard
BARRILLON St´ephanie Researcher, CNRS Chef de mission BATAILLE Hubert Image director, lRD Audio-visual
DOGLIOLI Andrea Assistant Professor, AMU Deployment / analyses (physics) FUDA Jean-Luc Research engineer, CNRS Instruments / deployment / analyses GREGORI G´erald Researcher, CNRS Sampling / analyses (cytometry) THYSSEN Melilotus Researcher, CNRS Sampling / analyses (cytometry) TZORTZIS Roxane Student, AMU Deployment / analyses (physics) GUIOMAR St´ephane Technician, GENAVIR MVP
• onshore
BHAIRY Nagib Study engineer, CNRS Glider piloting
PETRENKO Anne Assistant Professor, AMU Satellite and ADCP analysis RICOUT Anais Study engineer, CNRS Satellite analysis
COMBY Caroline Student, AMU Post-cruise data analysis
The ADCP, TSG and Cytometer were operational all along the cruise. 7 MVP transects and 7 stations were performed (6 for vertical velocity measurements operations and one for the release, following and sampling of the beads together with partial vertical velocity measurement). 7 daily bulletins have been released.
The overall strategy was to spot a fine scale structure, like an eddy or a front, characterise it with MVP and ADCP and perform vertical velocities stations inside and outside it. The beads ex-periment was supposed to occur in the center quiet part of the structure. We didn’t spot any eddy but crossed several fronts, and the beads station has been displaced westward inside the French waters.
2.2
Way points and station points
The following summarises the main way points and station points of the cruise.
Name Longitude (deg) Latitude (deg) LA SEYNE 5.8800 43.1000 PASSAGE 1 7.045 42.994 A = Station 1 8.3869 43.7441 B = Station 2 9.2108 43.7441 C 8.5215 43.3824 D1 8.6568 43.0 D2 8.5146 43.0 E = Station 3 8.8771 43.9949 F 9.2108 43.7441 G 9.0570 43.363 H 8.509 43.298 I = Station 4 8.3385 43.8729 J=IMPERIA 8.0117 43.8773 K = I = Station 5 8.3385 43.8729 M = Station 6 8.4746 43.5119 N 7.9996 43.7441 O ∼ VINTIMIGLIA 7.575 43.759 P = VILLEFRANCHE 7.312 43.685 Q 7.546 43.674 R 7.983 43.784 S 8.034 43.561 T=GLIDER 8.149 43.662 U= Station 7 BEADS 7.924 43.627 LA SEYNE 5.8800 43.1000
2.3
Cruise calendar
Tuesday, April, 30Mobilisation at La Seyne-sur-Mer port. Departure 16h40.
Transit towards points Passage 1 and A with ADCP, TSG, Cytometry, and MVP.
Wednesday, May, 01
Transit towards point A with ADCP, TSG, Cytometry, and MVP. In point A, glider deployment and station 1: VVP, Sentinel, L-ADCP. Transit towards point B with ADCP, TSG, Cytometry, and MVP. In point B, station 2: VVP, Sentinel and L-ADCP, FF-ADCP. Transit towards point C with ADCP, TSG, Cytometry, and MVP.
Thursday, May, 02
Transit towards points C, D1, D2, E with ADCP, TSG, Cytometry, and MVP. In point E, station 3: VVP, Sentinel, L-ADCP, FF-ADCP.
Transit towards point F with ADCP, TSG, Cytometry, and MVP.
Friday, May, 03
Transit towards points G, and H with ADCP, TSG, Cytometry, and MVP.
Plan was modified due to bad weather, we could not go as far southward as planned. Transit towards point I with ADCP, TSG, Cytometry, and MVP.
In point I, station 4: VVP, Sentinel , FF-ADCP. no L-ADCP due to waves. Transit towards point J (Imperia) with ADCP, TSG, and Cytometry. Stop in Imperia for the night.
Saturday, May 04
Departure from Imperia 10h10 (Hubert Bataille and Roxane Tzortzis out, Melilotus Thyssen in). Transit towards point K = I with ADCP, TSG, and Cytometry.
In point K, station 5: VVP , Sentinel, L-ADCP, FF-ADCP.
Transit towards points M and P with ADCP, TSG, and Cytometry. In point P, station 6: VVP , Sentinel, L-ADCP, FF-ADCP.
Transit towards point N with ADCP, TSG, Cytometry, and MVP.
Sunday, May 05
Shelter in Vintimiglia due to bad weather. Tests for preparation of the beads station.
Transit towards Villefranche-sur-Mer to find a better shelter.
In Villefranche bay, beads station rehearsal (every step except the beads injection). Transit towards Q, R with ADCP, TSG, Cytometry, and MVP.
Monday, May 06
Transit towards S and T (glider recuperation point) with ADCP, TSG, Cytometry, and MVP. Wait for better weather for glider recuperation. Glider recuperation.
Transit towards point U.
In point U, beads station and FF-ADCP. End of operations 19h11.
Transit towards La Seyne with ADCP, TSG, and Cytometry.
Tuesday, May 07
3
SPASSO
SPASSO is a software developed at MIO [d’Ovidio et al., 2015, Nencioli et al., 2011, Petrenko et al., 2017] which performs real-time processing of CMEMS satellite products. The onshore team interprets the results and sends their daily recommendations on the routes to be taken and the choice of stations to target specific oceanic processes [Doglioli et al., 2013, Petrenko et al., 2017]. For the FUMSECK cruises, the following near-real-time products have been daily treated from April 2 to July 03 and all the results are available online on https://spasso.mio.osupytheas.fr/FUMSECK/:
• SSH and associated geostrophic currents
- “MEDITERRANEAN OCEAN GRIDDED L4 SEA SURFACE HEIGHTS AND DERIVED VARI-ABLES” (SEALEVEL MED PHY L4 NRT OBSERVATIONS 008 050): 0.125◦× 0.125◦
• SST
- “MEDITERRANEAN SEA - HIGH RESOLUTION AND ULTRA HIGH RESOLUTION L3S SEA SURFACE TEMPERATURE (SST MED SST L3S NRT OBSERVATIONS 010 012): 0.01◦× 0.01◦
- “MEDITERRANEAN SEA HIGH RESOLUTION AND ULTRA HIGH RESOLUTION SEA SUR-FACE TEMPERATURE ANALYSIS (SST MED SST L4 NRT OBSERVATIONS 010 004): 0.01◦× 0.01◦
• Chl
- “GLOBAL OCEAN CHLOROPHYLL FROM SATELLITE OBSERVATIONS” (OCEANCOLOUR GLO CHL L3 NRT OBSERVATIONS 009 032): 4km × 4km
- “MEDITERRANEAN SEA SURFACE CHLOROPHYLL CONCENTRATION FROM MULTI SATEL-LITE OBSERVATIONS”
(OCEANCOLOUR MED CHL L3 NRT OBSERVATIONS 009 040): 1km × 1km
- “MEDITERRANEAN SEA DAILY INTERPOLATED SURFACE CHLOROPHYLL CONCEN-TRATION FROM MULTI SATELLITE OBSERVATIONS”
(OCEANCOLOUR MED CHL L4 NRT OBSERVATIONS 009 041): 1km × 1km
A total of 11 daily bulletins (from April 23 to May 07) have been released and are available online on https://spasso.mio.osupytheas.fr/FUMSECK/Bulletin_web/. These bulletins and daily communication with the onshore team helped in guiding the cruise, in particular to move station 2 Eastward and points D1 and D2 Southward in order to cross interesting Chl fronts.
4
ADCP
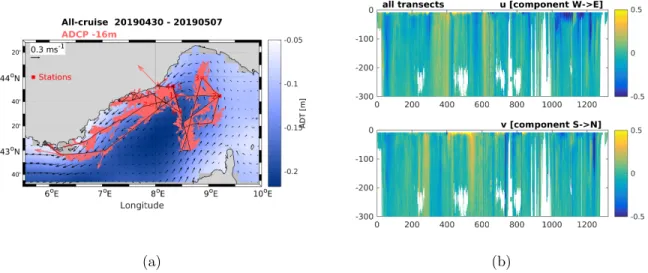
The vessel-mounted ADCP (RDI 75kHz) ran continuously during the cruise. Data were daily sent and treated by C´eline Heyndrickx at DT INSU La Seyne-sur-Mer. The figure 2 shows the currents at 16m-depth and the currents u (W→E component) and v (S→N component) profiles for all the cruise.
(a) (b)
Figure 2: ADCP currents: 16m (a), u and v profiles (b) measured during FUMSECK. The ADCP profiles are shown until a depth of 300m, which is the region of interest for this cruise.
5
TSG and Fluorimeter
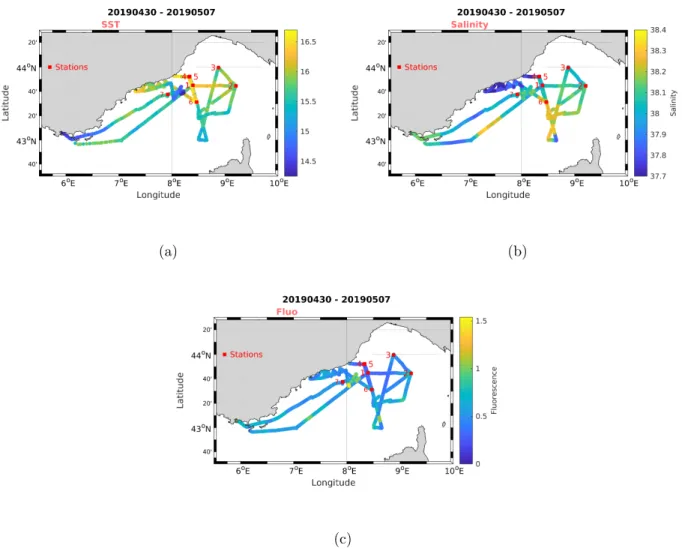
The TSG (SBE 21) and fluorimeter (10-AU-005-CE, Turner Designs) ran continuously during the cruise. Data were daily sent and treated by C´eline Heyndrickx at DT INSU La Seyne-sur-Mer. The figure 3 shows the surface temperature, salinity and fluorimetry for all the cruise.
6
Cytometry
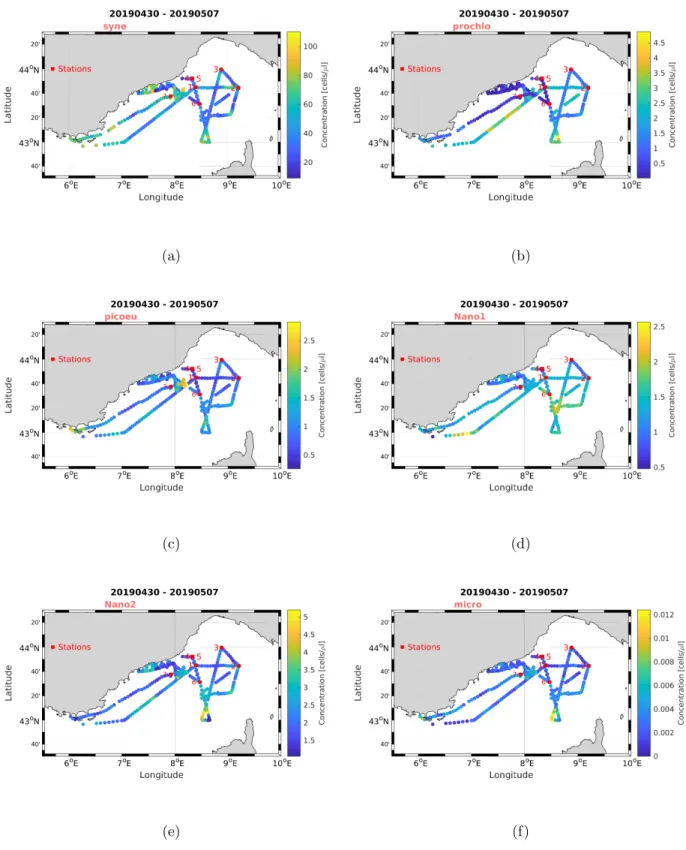
Two flow cytometers (an automated Cytosense and a bench-top ACCURI C6) were installed onboard in the wet laboratory. The Cytosense (Cytobuoy) was used to automatically analyse sur-face water samples from the TSG every 20 minutes for all the cruise. The ACCURY C6 (BD Biosciences) was used to detect the biodegradable microbeads used as tracers of the vertical veloc-ities. The figure 4 shows the concentrations of Synechococcus, Prochlorococcus, Picoeukaryotes, Nano1, Nano2, and Microplankton groups for all the cruise.
(a) (b)
(c)
Figure 3: Surface temperature (a), salinity (b) and fluorimetry (c) measured during FUM-SECK.
(a) (b)
(c) (d)
(e) (f)
Figure 4: Concentrations of phytoplankton functional groups during FUMSECK: Syne-chococcus (a), Prochlorococcus (b), Picoeukaryotes (c), Nano1 (d), Nano2 (e), Microplank-ton (f).
7
MVP
We studied the MVP200 (Moving Vessel Profiler) instruments behaviour, focusing on the ro-tative behaviour and the connectics for the whole data acquisition chain of the MSFFFII (Multi Sensor Free Fall Fish, so called ”big fish”) equipped with a µCTD, a fluorimeter, an LOPC (Laser Optical Plankton Counter, particle size range: 100µm − 1920µm), and an ODDI sensor (rotation measurement on the 3 axes).
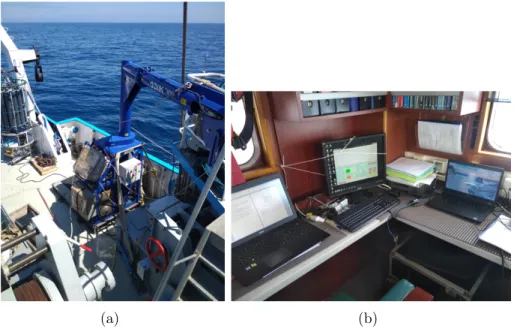
The MVP was installed port of the T´ethys II, and the operating system in the piloting cabin, as shown in figure 5. To lower the rotative effect of the MSSFFFII, two configurations were tested, both with the addition of 1kg mass at the back of the fish at the µCTD connectics level and of a dummy cable to the other side of the electric cable: the first configuration has the fluorimeter installed starboard side (right of the fish when looking at the fish bow), the second port side (left of the fish looking at the same direction of the fish head).
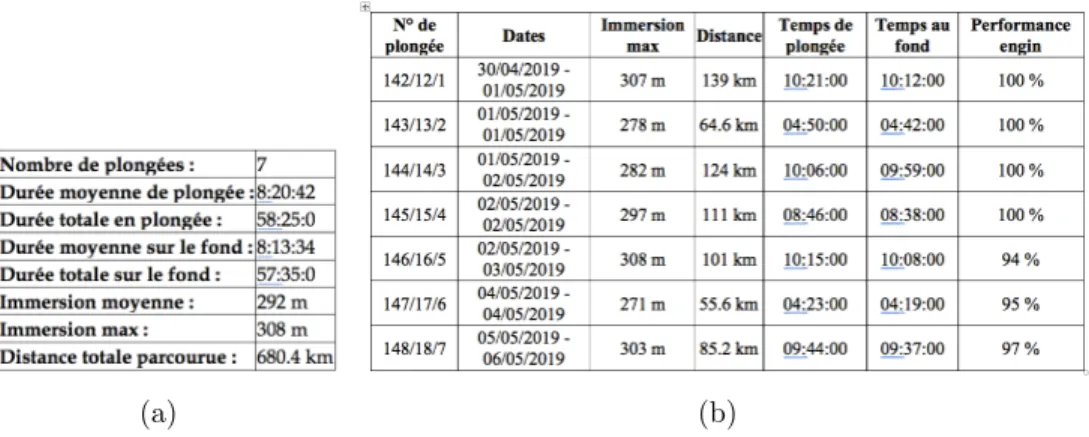
In total, 507 casts have been performed along 680.4 km of route (58h25min of effective work), with 7 transects with a mean duration of 8h20min each and a general vessel speed of 8 knots. One of the transects (PL4) was synchronised to one of the S3B Sentinel satellite trajectories, allowing future comparisons between satellite and in situ data. The transects details are given in the tables shown in figure 6.
(a) (b)
Figure 5: Pictures of the MVP200 installation: winch (a), deck unit and remote control computers (b) (credit: Hubert Bataille).
(a) (b)
Figure 6: MVP transect details: all transects (a), per transect (b).
7.1
Rotative behaviour and connectics
The basic configuration of the MSFFFII is defined without the balancing mass and false cable and with the fluorimeter installed on the starboard side, for which the previous measurements showed > 2.7 full rotations (full rotation = 360◦) per free fall. The balancing affects positively the rotative behaviour: 2 full rotations per free fall for the first configuration. Moving the fluorimeter to the port side (second configuration) also improves the rotative behaviour, lowering it to 1 full rotation per free fall, so that the cable can sustain up to 1000 casts. Figure 7 shows the retained configuration.
The connectics performed well with the new LOPC PC, however the casts had to be launched by hand despite several tries to debug the automatic mode.
Figure 7: Configuration of the MSSFFFII with the fluorimeter installed port side (credit: Hubert Bataille).
7.2
MVP profiles
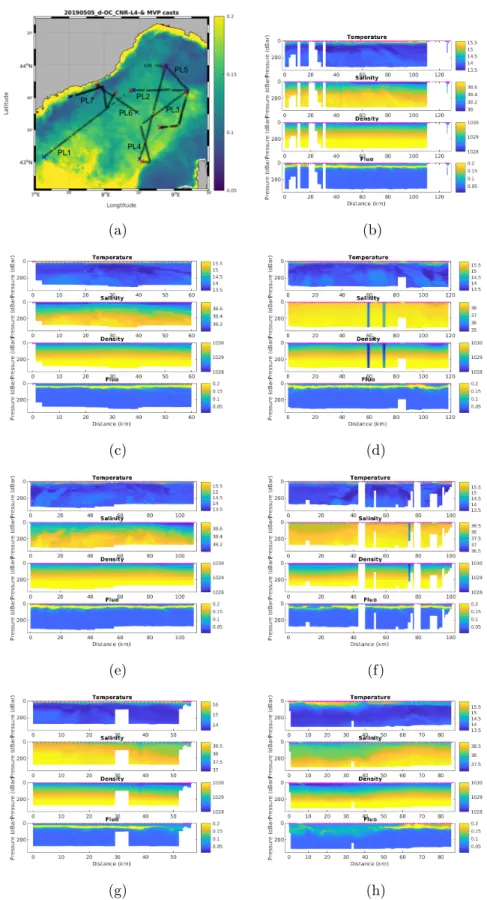
The 7 transects of the MVP and the temperature, salinity, density and fluorescence profiles are shown in figure 8.
(a) (b)
(c) (d)
(e) (f)
(g) (h)
8
Vertical velocities
Several methods of measuring vertical velocities have been developed and tested, using different ADCP (vessel-mounted ADCP, L-ADCP and Sentinel V (5 beams) at fixed depth and in profile, FF-ADCP (Free Fall ADCP), the VVP (Vertical Velocities Profiler) prototype developed at MIO, and the MIO glider.
The vessel-mounted ADCP data have not been analysed to obtain vertical velocities yet, as it demands a large development of the actual treatment chain which is calculating horizontal velocities while minimizing vertical velocities means.
8.1
Sentinel V
We used a Sentinel V ADCP (landed by RDI) with a frequency of 500kHz, with a theoretical profiling range of 50m, and the particularity of having 5 beams, one of which is vertical for a direct measurement of the vertical velocity. The Sentinel V was mounted on the bathysonde together with a CTD. 6 stations were performed with the same scheme: 10min at a fixed 10m depth, followed by 3 down-up profiles. This method was inspired by the L-ADCP profile method to measure vertical velocities [Thurnherr, 2011].
Two vertical velocity measurements are performed with the Sentinel: with the 5th beam, and with the classic method involving the 4 beams. In order to measure the oceanic vertical velocity, the data analysis has been developed as follows:
• time synchronisation between the Sentinel and the CTD
• quality selection: intensity > 40 and correlation > 64 (native RDI cuts), |error velocity| < 0.1m.s−1
• projection of the 5th beam velocity on the vertical axis, regarding the Sentinel pitch, roll and
heading
• substraction of the instrument velocity (using the CTD depth data) • projection of the Sentinel cells on the vertical axis
• time smoothing on 20s
• removal of the extreme depths of the profiles
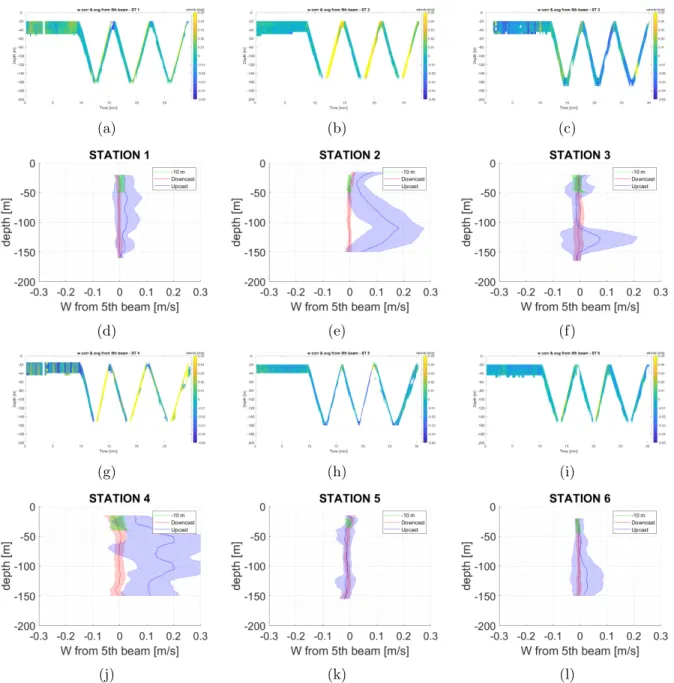
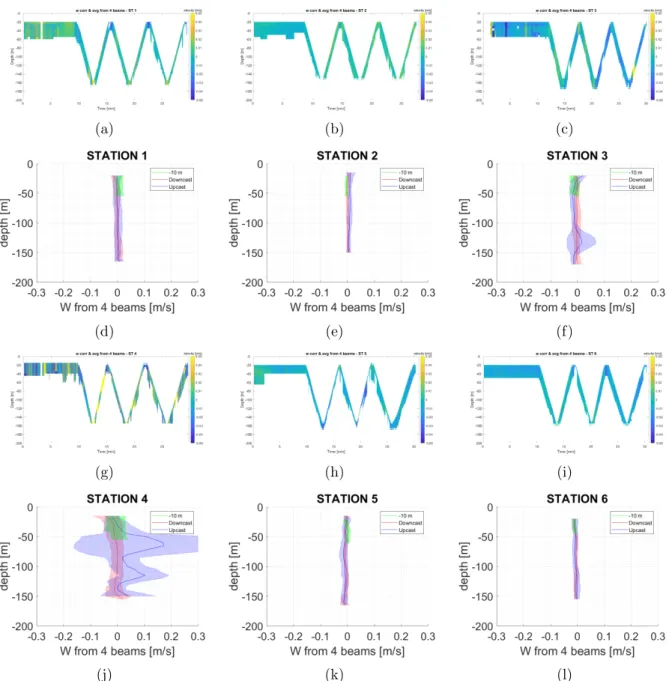
The results of the vertical velocities measurements for the 5th beam are shown in figure 9 for the 6 stations: as a function of time and depth (left), and mean value for each phase (fixed depth, downcasts, upcasts) as a function of depth. The results for the 4 beams are shown in figure 10 in the same way.
(a) (b) (c)
(d) (e) (f)
(g) (h) (i)
(j) (k) (l)
Figure 9: Measured vertical velocities by the Sentinel 5th beam for the 6 stations: station
1 (a) (d), station 2 (b) (e), station 3 (c) (f), station 4 (g) (j), station 5 (h) (k), station 6 (i) (l). Vertical velocities as a function of time and depth (a) (b) (c) (g) (h) (i). Mean vertical velocities and their standard deviations as a function of depth (d) (e) (f) (j) (k) (l).
(a) (b) (c)
(d) (e) (f)
(g) (h) (i)
(j) (k) (l)
Figure 10: Measured vertical velocities by the Sentinel 4 beams for the 6 stations: station 1 (a) (d), station 2 (b) (e), station 3 (c) (f), station 4 (g) (j), station 5 (h) (k), station 6 (i) (l). Vertical velocities as a function of time and depth (a) (b) (c) (g) (h) (i). Mean vertical velocities and their standard deviations as a function of depth (d) (e) (f) (j) (k) (l).
The main conclusions for the Sentinel measurements are the following, looking at the mean vertical velocities as a function of depth:
• Phases
For the 5th beam measurement the fixed-depth casts and the downcasts are in agreement, whilst the upcasts seem to suffer some instabilities, with larger mean values and standard deviations. This is generally not the case for the 4 beams measurement, except for sta-tions 3 and 4. Therefore, the downcasts, covering a wider depth range, are chosen for the measurement and comparison.
• Behaviour and order of magnitude
Focusing on the downcasts, the 5th beam and the 4 beams measurements are compatible in
mean and standard deviations values, are stable as a function of depth and as a function of the stations, with mean values of the order of a few mm.s−1 and standard deviation of the order of cm.s−1, compatible with the values expected in the study area. The largest standard deviations values are observed for the station 4 with the worst weather conditions.
8.2
L-ADCP
We used a L-ADCP (RDI) with a frequency of 300kHz, with a theoretical profiling range of 120m. The L-ADCP was mounted and used exactly the same way as the Sentinel V and each station was performed right after the Sentinel one, except for the station 4 where the weather conditions forbid the realisation of the L-ADCP station.
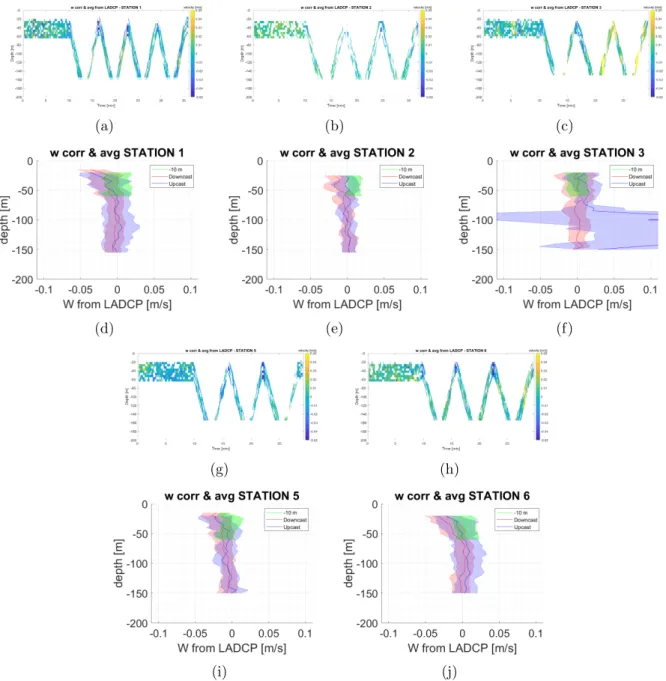
The data analysis chain is the same as the Sentinel V one. The results of the vertical velocities measurements for the 4 beams are shown in figure 11 for the 5 stations: as a function of time and depth (left) and mean value for each phase (fixed depth, downcasts, upcasts) as a function of depth. In general, the phases are in agreement except for station 3 where the upcast is showing a large variation, the values of mean and standard deviations are larger than the Sentinel ones, and less stable as a function of depth.
(a) (b) (c)
(d) (e) (f)
(g) (h)
(i) (j)
Figure 11: Measured vertical velocities by the L-ADCP 4 beams for the 5 stations: station 1 (a) (d), station 2 (b) (e), station 3 (c) (f), station 5 (g) (i), station 6 (h) (j). Vertical velocities as a function of time and depth (a) (b) (c) (g) (h). Mean vertical velocities and their standard deviations as a function of depth (d) (e) (f) (i) (j).
8.3
Comparison of the Sentinel 5
thbeam, 4 beams, and L-ADCP
4 beams
The comparison for the vertical velocity measurements between Sentinel V 5th beam, 4 beams and L-ADCP for the downcasts are summarised in the table 1 and shown in figure 12. In general, the mean values are compatible within the standard deviations, with more stable and precise mea-surement for the Sentinel compared to the L-ADCP.
STATION 1 2 3 4 5 6 ALL ALL without 4
Sentinel 5th beam µ (10−2m.s−1) -0.3 -0.0 -0.5 -0.5 -0.8 -0.6 -0.4 -0.4 σ (10−2m.s−1) 0.7 0.7 1.3 1.9 0.9 0.6 1.0 0.8 Sentinel 4 Beams µ (10−2m.s−1) -0.0 0.2 -0.2 -0.7 -0.6 -0.6 -0.3 -0.2 σ (10−2m.s−1) 1.0 0.5 1.1 2.7 0.7 0.6 1.1 0.8 L-ADCP µ (10−2m.s−1) -0.8 -0.4 0.1 / -1.0 -0.5 / -0.5 σ (10−2m.s−1) 1.4 1.0 1.5 / 1.2 1.3 / 1.3
Table 1: Comparison for the vertical velocity measurements between Sentinel V 5th beam,
4 beams and L-ADCP for the downcasts: mean values and standard deviations for all the stations. Station 4 doesn’t have a L-ADCP measurement.
More details on the Sentinel and L-ADCP vertical velocities analysis can be found in C. Comby’s master report (https://people.mio.osupytheas.fr/~barrillon.s/Students/Rapport_Caroline_ 2020.pdf)
(a) (b) (c)
(d) (e) (f)
(g) (h) (i)
(j) (k) (l)
Figure 12: Comparison for the vertical velocity measurements between Sentinel V 5thbeam,
4 beams and L-ADCP for the downcasts: mean values as a function of depth for station 1 (a), 2 (b), 3 (c), 4 (g), 5 (h), 6 (i), histograms for station 1 (d), 2 (e), 3 (f), 4 (j), 5 (k), 6 (l). Station 4 doesn’t have a L-ADCP measurement.
8.4
FF-ADCP
The FF-ADCP (Free Fall ADCP) is based on the L-ADCP measurement technique, but with the advantage of being disconnected from the vessel movement. An ADCP (WH MONITOR 300kHz) and a CTD (Sea-Bird RBR Concerto) are mounted in a cage (∼ 3m, total weight in air ∼ 150kg, total weight in water ∼ 2kg) retained by a rope to the boat. The FF-ADCP was operated in 6 stations, corresponding to stations 2 to 6 of Sentinel/L-ADCP and a last one (station 7) at the beads experiment point. We performed 3 profiles per station (5 profiles for stations 4 and 7), each one being composed by a free fall at slow speed with loose rope, therefore independent of the movement of the boat, then ascent. Pictures of the device are shown in figure 13.
(a) (b)
Figure 13: FF-ADCP preparation and deployment. (credit: Hubert Bataille)
The vertical ocean speed is obtained with the following analysis: • time synchronisation between the ADCP and the CTD • time smoothing on 10s
• selection of the free-fall phases (where the CTD velocity is constant)
• subtraction of the instrument velocity (using the CTD velocity) to the ADCP measured vertical velocity
The results are summarised in the table 2 and shown in figure 14 for each station: vertical velocity as a function of time et depth, and histogrammed. In general the mean values are of the order of a few mm.s−1, as for the Sentinel and L-ADCP results, with a standard deviation of the order of cm.s−1, same order of magnitude but lower than the Sentinel and L-ADCP ones, and very stable with respect to the station conditions. Some variations are observed with respect to depth and stations which will be explored in the future analysis, as well as a diagonal feature observed in most of the stations that is currently under investigation.
STATION 2 3 4 5 6 µ (10−2m.s−1) -0.6 0.4 0.0 -0.3 0.2 σ (10−2m.s−1) 0.7 0.7 0.7 0.7 0.6
Table 2: FF-ADCP vertical velocity measurements for the free fall parts: mean and standard deviations values for all the stations. Station 1 doesn’t have a FF-ADCP measurement.
(a) (b) (c)
(d) (e) (f)
(g) (h) (i)
(j) (k) (l)
Figure 14: FF-ADCP vertical velocity measurements for the free-fall phase, station 2 (a) (d), station 3 (b) (e), station 4 (c) (f), station 5 (g) (j), station 6 (h) (k), station 7 (i) (l). Vertical velocities as a function of time and depth (a) (b) (c) (g) (h) (i). Histograms of vertical velocities (d) (e) (f) (j) (k) (l).
8.5
VVP
The VVP (Vertical Velocities Profiler) was developed at MIO on the basis on the glider ability to measure vertical velocities [FrajkaWilliams et al., 2011, Fuda et al., 2013, Margirier et al., 2017, Merckelbach et al., 2010]. It is an autonomous device with a temperature and pressure sensor (PT SBE39 SN), an ARGOS antenna, an ice-release system and a ballast, as can be seen in the instrument scheme in figure 15. The VVP is performed in station: once launched, it sinks and falls freely until the release of the ballast, then ascents. Once back in surface, the VVP is tracked with a Goniometer and the ARGOS antenna and retrieved onboard. 6 stations have been performed, corresponding to the Sentinel/L-ADCP stations. The measurement of the oceanic vertical speed is inspired by measurements from gliders: the pressure and density of the water are evaluated along the profile, any deviation from the vertical speed predicted by the mechanical balance between weight in water and hydrodynamic drag can be interpreted as a oceanic vertical velocity.
The ice-release system is a new concept of a simple, robust and economical underwater release that was born during the VVP development. It is based on the controlled release over time of an insert caught in a frozen fluid. In June 2019, Jean-Luc Fuda declared the concept to the SATT Sud-Est. To date, SATT Sud-Est has invested in the first steps of an industrial valorisation, in-cluding the preliminary design study by a specialised agency as well as the drafting of a patent that has recently been filed at the INPI. Guillaume Gouvernet, in charge of technology transfer at SATT, and Jean-Luc Fuda are now actively looking for an industrial partner interested in the manufacture and marketing of this “ice-release”.
The first analysis, showing for each station depth and instrument vertical velocity as a function of time is shown in figure 16. The vertical velocities plots show some regular features and the main conclusion is that the results are not fully exploitable as a more precise and faster pressure sensor is needed, which will be achieved for the next prototype, replacing the temperature and pressure sensor by a RBR Concerto CTD.
(a) (b) (c)
(d) (e) (f)
Figure 16: VVP: depth and instrument vertical velocity vs time. Station 1 (a), 2 (b), 3 (c), 4 (d), 5 (e), 6 (f).
9
Biodegradable beads
We experimented the dropping, following, pumping and detection by cytometry of a sample of white biodegradable micro-particles (beads) that mimic (in size and density) the plankton, in order to study the physical part of the biological carbon pump.
On one side, we used a temperature and pressure sensor (PT SBE39 SN) attached to a 30m-long semi-rigid pipe, with a ballast of 200 kg, for water extraction before mixing with the beads and injection of the mixed water with beads. On the other side, for extraction of the water in the zone after injection, we used the PASTIS (Pumping Advanced System To Investigate Seawater) device, which is a cage containing a CTD (SBE19+) attached to a 30m-long semi-rigid pipe, as well as a temperature and pressure sensor (SBE39) at the extreme end of the pipe for a depth knowledge a posteriori. For extraction and injection, we used a pneumatic pump (model A2CH2 F12). For the tracking of the seeded water mass, we used 3 Lagrangian drifters, each with a 15m-long sock. All these devices are shown in figure 17. The samples were analysed with the two automated cytome-ters (Cytosense and C6).
One station was performed (station 7) with the following steps: • extraction of 500L of water at 15m depth
• mixing of 1kg beads with red food colouring and the extracted water • injection at 15m depth of this mix within a 56m radius circle
• release of the Lagrangian drifters
• following of the Lagrangian drifters and three extractions of 30L water each at 15m depth with PASTIS, as close as possible to the drifters
• analysis of the extracted water with the two cytometers, showing the presence of the beads in the extracted water
A South-Eastward current of 0.2m.s−1 and 11 knots of wind from SW were measured. The fig-ure 18 shows the vessel trajectory within the injection zone, an injection underwater pictfig-ure, the vessel trajectory during the following of the Lagrangian drifters, and the cytogramm showing the significant beads signature. Therefore, despite not-ideal weather and current conditions and the small amount of available beads, this experiment turned out to be a success, proving the feasibility of this totally innovative method for understanding the physical part of the biological carbon pump.
(a) (b)
(c) (d)
Figure 17: Instruments and devices used for the beads experiment: end of the structure for water extraction and injection (a), PASTIS device (b), pneumatic pump scheme (c) and Lagrangian drifters (d). (pictures credit: G´erald Gr´egori)
(a) (b) (c)
(d)
Figure 18: Beads experiment: vessel trajectory within the injection zone (a), injection underwater picture (b), vessel trajectory during the following of the Lagrangian drifters (c), and cytogramm of the extracted water obtained with the ACCURI C6 flow cytometer (d).
10
Glider
The MIO glider (SeaExplorer, AlseaMar) was deployed during the cruise, in order to extract a complementary measurement of the vertical velocities [FrajkaWilliams et al., 2011, Fuda et al., 2013, Margirier et al., 2017]: the pressure and density of the water are evaluated along the profiles, any deviation from the vertical velocity predicted by the glider flight model can be interpreted as an ocean vertical velocity.
The glider was deployed on the first day of the cruise and retrieved on the last day. It followed one of the S3B Sentinel satellite trajectories back and forth, as can be seen in figure 1. The anal-ysis of data has not yet been done for vertical velocities. The first data profiiles of temperature, conductivity, Chl-a and oxygen are shown in figure 19. The effect of the storm is visible on all the plots at a distance around 110 km.
(a) (b)
(c) (d)
Figure 19: Glider profiles as a function of distance and depth: temperature, conductivity, Chl-a, and oxygen.
11
Conclusion and perspectives
The FUMSECK cruise is considered as a success, despite the difficult weather conditions on the second half of the cruise. All the objectives are fulfilled. The whole chain of the MVP data has been tested with the new PC. A configuration has been found to significantly reduce the rotative effect of the big fish. Very promising results have been achieved for the various vertical velocity techniques and gave serious hints for the amelioration of the next prototypes, such as using the FF-ADCP with the Sentinel, and a new prototype of VVP capable of several profiles and with a more precise pressure sensor. The beads experiment was also very promising.
A patent for the ice-release instrument of the VVP has been proposed. Despite the technological profile of the cruise, scientific studies are ongoing on the physics-biology coupling, with 1 to 3 papers foreseen. It represents a solid stone added to the preparation of the future fields campaigns, within the consortium BIOSWOT AdAC [d’Ovidio et al., 2019], foreseen for the launch of the new high-resolution altimetry satellite SWOT.
References
X. Capet, J.C. McWilliams, M.J. Molemaker, and A.F. Shchepetkin. Mesoscale to submesoscale transition in the california current system. J. Phys. Ocean., (38):Part 1: 29–43, Part 2 : 44–64, Part 3 : 2256–2269, 2008.
A.M. Doglioli, F. Nencioli, A.A. Petrenko, J.-L. Fuda, G. Rougier, and N. Grima. A software package and hardware tools for in situ experiments in a lagrangian reference frame. J. Atmos. Ocean. Tech., (30):1945–1950, 2013. doi: 10.1175/JTECH-D-12-00183.1.
F. d’Ovidio, A. Della Penna, T. W. Trull, F. Nencioli, I. Pujol, M. H. Rio, Y.-H. Park, C. Cott, M. Zhou, and S. Blain. The biogeochemical structuring role of horizontal stirring: Lagrangian perspectives on iron delivery downstream of the kerguelen plateau. Biogeosciences Discuss., (12):779–814, 2015.
F. d’Ovidio, A. Pascual, J. Wang, A.M. Doglioli, Z. Jing, S. Moreau, G. Gregori, S. Swart, S. Speich, F. Cyr, B. Lgresy, Y. Chao, L. Fu, and R. Morrow. Frontiers in fine scale in-situ studies: opportunities during the swot fast sampling phase. Front.Mar.Sci., (6):168, 2019. doi: 10.3389/ fmars.2019.00168.
R. Ferrari. A frontal challenge for climate models. Ocean science, (332):316?317, 2011. doi: 10.1126/science.1203632.
R. Ferrari and C. Wunsch. Ocean circulation kinetic energy: reservoirs, sources, and sinks. Annu. Rev. Fluid Mech., (41):253–282, 2009. doi: 10.1146/annurev.fluid.40.111406.102139.
E. FrajkaWilliams, C.C. Eriksen, P.B. Rhines, and R.R. Harcourt. Determining vertical water velocities from seaglider. J. Atmos. Oceanic Technol., (28):1641–1656, 2011. doi: 10.1175/ 2011JTECHO830.1.
J.-L. Fuda, F. Marin, F. Durand, and T. Terre. Diagnosing ocean vertical velocities off new caledonia from a spray glider. Geophysical Research Abstracts, (Vol. 15), 2013.
M. L´evy, P. Klein, and A.M. Treguier. Impact of mesoscale physics on production and sub-duction of phytoplankton in an oligotrophic regime. J. Mar. Res., (59):535–565, 2001. doi: 10.1357/002224001762842181.
A. Mahadevan. The impact of submesoscale physics on primary productivity of plankton. T. Annu. Rev. Mar. Sci., (8):161–184, 2016. doi: 10.1146/annurev-marine-010814-015912.
F. Margirier, A. Bosse, P. Testor, B. L’H´ev´eder, L. Mortier, and D. Smeed. Characterization of convective plumes associated with oceanic deep convection in the northwestern mediterranean from high-resolution in situ data collected by gliders. Journal of Geophysical Research: Oceans, (122):9814–9826, 2017. doi: 10.1002/2016JC012633.
Jr.D.J. McGillicuddy. Mechanisms of physical-biological-biogeochemical interaction at the oceanic mesoscale. Annual Review of Marine Science, (8):125–159, 2016.
J. C. McWilliams. Submesoscale currents in the ocean. Proc. R. Soc, (A 472:20160117), 2016. doi: 10.1098/rspa.2016.0117.
Lucas Merckelbach, David Smeed, and Gwyn Griffiths. Vertical water velocities from underwater gliders. J. Atmos. Oceanic Technol., (27(3)):547–563, 2010.
F. Nencioli, F. d’Ovidio, A.M. Doglioli, and A.A Petrenko. Surface coastal circulation patterns by in-situ detection of lagrangian coherent structures. Geophys. Res. Lett., (Vol.38, L17604), 2011. doi: 10.1029/2011GL048815.
A.A. Petrenko, A.M. Doglioli, F. Nencioli, M. Kersal, Z. Hu, and F. d’Ovidio. A review of the latex project: mesoscale to submesoscale processes in a coastal environment. Ocean Dynam., 2017. doi: 10.1007/s10236-017-1040-9.
A. M. Thurnherr. Vertical velocity from ladcp data. IEEE/OES 10th Current, Waves and Turbu-lence Measurements (CWTM), Monterey, CA, page 198204, 2011. doi: 10.1109/CWTM.2011. 5759552.