A Demo of the Data Civilizer System
The MIT Faculty has made this article openly available.
Please share
how this access benefits you. Your story matters.
Citation
Castro Fernandez, Raul, et al. “A Demo of the Data Civilizer
System.” Proceedings of the 2017 ACM International Conference on
Management of Data - SIGMOD ’17, New York, NY, USA, ACM Press,
2017, pp. 1639–42.
As Published
http://dx.doi.org/10.1145/3035918.3058740
Publisher
Association for Computing Machinery (ACM)
Version
Author's final manuscript
Citable link
https://hdl.handle.net/1721.1/121460
Terms of Use
Creative Commons Attribution-Noncommercial-Share Alike
A Demo of the Data Civilizer System
Raul Castro Fernandez
8Dong Deng
8Essam Mansour
7Abdulhakim A. Qahtan
7Wenbo Tao
8Ziawasch Abedjan
;Ahmed Elmagarmid
7Ihab F. Ilyas
`Samuel Madden
8Mourad Ouzzani
7Michael Stonebraker
8Nan Tang
78MIT CSAIL 7Qatar Computing Research Institute, HBKU ;TU Berlin `University of Waterloo
{dongdeng, raulcf, wenbo, madden, stonebraker}@csail.mit.edu
{emansour, aqhatan, aelmagarmid, mouzzani, ntang}@hbku.edu.qa
[email protected] [email protected]
ABSTRACT
Finding relevant data for a specific task from the numer-ous data sources available in any organization is a daunting task. This is not only because of the number of possible data sources where the data of interest resides, but also due to the data being scattered all over the enterprise and being typically dirty and inconsistent. In practice, data scientists are routinely reporting that the majority (more than 80%) of their e↵ort is spent finding, cleaning, integrating, and ac-cessing data of interest to a task at hand. We propose to demonstrate Data Civilizer to ease the pain faced in ana-lyzing data “in the wild”. Data Civilizer is an end-to-end big data management system with components for data dis-covery, data integration and stitching, data cleaning, and querying data from a large variety of storage engines, run-ning in large enterprises.
1. INTRODUCTION
Enterprises are increasingly turning to data scientists to obtain business value from the vast amount of data within and outside the enterprise. A major impediment for these scientists to do their job is the oft-cited statistics that they spend at least 80% of their time finding, preparing, inte-grating, and cleaning data sets. The remaining 20% is spent doing the desired analytic tasks. Even worse, 80% may be a lower bound, since one data officer from a large pharma-ceutical company estimates this number to be 98%.
We are building Data Civilizer to lower this number by providing an end-to-end system for:
(1) Discovering datasets relevant to the task at hand. (2) Obtaining access to these datasets.
(3) Integrating datasets and deduplicating the result. (4) Stitching together datasets through the best join paths. (5) Cleaning datasets under a limited budget.
(6) Querying datasets that live across di↵erent systems.
Permission to make digital or hard copies of all or part of this work for personal or classroom use is granted without fee provided that copies are not made or distributed for profit or commercial advantage and that copies bear this notice and the full cita-tion on the first page. Copyrights for components of this work owned by others than ACM must be honored. Abstracting with credit is permitted. To copy otherwise, or re-publish, to post on servers or to redistribute to lists, requires prior specific permission and/or a fee. Request permissions from [email protected].
SIGMOD’17, May 14-19, 2017, Chicago, IL, USA
c 2017 ACM. ISBN 978-1-4503-4197-4/17/05. . . $15.00
DOI:http://dx.doi.org/10.1145/3035918.3058740
It comes as no surprise that each of these tasks has received considerable attention in isolation. For example, work in data integration and schema mapping has focused on match-ing the data and meta data of di↵erent data sources [2], while data cleaning solutions have focused primarily on cleaning specific data sources with respect to a certain type of er-rors [5]. Recent polystore proposals [1, 4] have addressed the last challenge of querying data across di↵erent systems. While these point solutions would partially help with the data preparation task faced by a data scientist, an end-to-end system that tackles these problems can benefit from synergies and optimization across modules.
Our work is motivated by several use cases that cover most of the data landscape in real organizations. Merck is a “Big Pharma” that has in excess of 4000 databases, a data lake, uncountable numbers of files and they have interest in a large variety of data o↵ the public web. They report that their data scientists currently spend 98% of their time in the data preparation activities noted above, and have started us-ing our software to reduce this percentage. The MIT Data Warehouse (MIT DWH) has in excess of 2400 tables with typical university information (e.g., students, courses, de-partments, and buildings). Administrators routinely want specific records from this warehouse. For example, an ad-ministrator might want to get the information of all the students in schools of engineering.
We have recently laid out our vision of Data Civilizer in [3]. We now propose to demonstrate a prototype of Data Civilizer. We outline the architectural choices we have made while designing the system in Section 2. We will then demonstrate an end-to-end use case in Section 3.
2. THE ARCHITECTURE
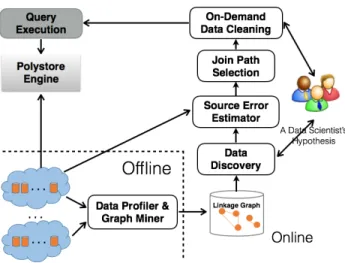
The Data Civilizer system consists of several intercon-nected components. Figure 1 gives an overview of how data scientists use Data Civilizer. Starting with a hypothe-sis, the analyst goes through several steps. These include finding relevant data, stitching them together and spending some time in data cleaning. The goal is to obtain the data required to validate the hypothesis. Data Civilizer has the following modules:
Data Profiler and Graph Miner. This o✏ine module creates the metadata required by the subsequent online mod-ules. It mainly summarizes data contents into an index and relationships among data elements into a linkage graph. Data Discovery. This module allows users to capture their
Figure 1: System Overview
intuition about the desired datasets into a Source Retrieval Query Language (SRQL). SRQL queries are based on a dis-covery algebra for expressing di↵erent disdis-covery needs. Join Path Selection. Given multiple datasets obtained from the previous module, users are usually interested in finding ways to stitch them together and ask meaningful queries. For that purpose, they use an SRQL query to find join paths between tables of interest. When multiple join paths are available — a common situation in large datasets — which join path should we choose? We propose a join path selection algorithm that permits users to choose the most appropriate join path. The algorithm uses the source error estimator to determine the cleanliness of the datasets. On-Demand Cleaning. Cleaning all source tables is in-feasible with large volumes of data. Data Civilizer incor-porates a cleaning module that, given a budget, suggests the best cells to clean for the desired view. This module uses the source error estimator in selecting the cells to clean. Data Querying. Once analysts obtain the necessary datasets, they want to query it. Since this may involve querying several datasets living in di↵erent systems, such as tables in PostgreSQL and files in HDFS, we use a Polystore (RHEEM [1] or BigDAWG [4]) to perform such operation.
2.1 Data Discovery
The discovery component faces two main challenges. One of scale — due to the large amount of data — and one of variety of discovery needs that di↵erent users have. To tame the scale of the problem and retrieve enough in-formation to allow di↵erent discovery needs, the discovery component builds a linkage graph that summarizes informa-tion related to attributes and tables, capturing relainforma-tionships between them. Conceptually, the discovery component has the following three parts (Figure 1):
(I) Data Profiler
This component summarizes each column of each table into a profile which consists of one or more signatures; each sig-nature summarizes the original content of the column into a domain-dependent, compact representation of the original
data. By default, signatures for numerical values consist of a statistical distribution, such as a histogram or KDE, as well as summary statistics. For textual values, the signatures consist of a vector of TF-IDF vectors as well as minhash signatures. Our profiles also contain information about data cardinality, data type, and numerical ranges if applicable. In addition to the profiles, we maintain a global keyword index to facilitate keyword queries. The index maps keywords to columns containing the word in their names, content or ta-ble name — in which case all columns are retrieved. To run at scale, we must read data only once and rely on Opnq algo-rithms. For this, we use a distributed profiler consisting of a pipeline of stages, each implementing an Opnq algorithm to approximately compute the statistics, cardinality as well as to determine data types and other metadata.
(II) Graph Miner
The linkage graph is modeled as a hypergraph. Nodes are attributes in the underlying data and hyperedges link nodes that are part of the same hierarchical organization. For ex-ample, hyperedges can indicate relations, or functional de-pendencies. Such model can express relationships involving either individual nodes or groups of nodes — those con-nected by a hyperedge. Currently, the graph miner finds re-lationships of the following type: column similarity, schema similarity, inclusion dependency, and PK-FK relationship. Metadata information computed by the profiler is kept sep-arately in an index database for efficient retrieval. The edge labels in the graph include metadata about the relationship they represent, e.g., type and score, if any. Computing dif-ferent relationships requires di↵erent time complexities. We categorize them into light relationships, which can be com-puted in sub-quadratic time, and heavy relationships, which need at least quadratic time. The light relationships contain column and schema similarities, as well as candidate PK-FK relationships. The heavy relationships contain a di↵erent flavor of primary key-foreign key (PK-FK) relationships, in-clusion dependencies, and structure similarities.
(III) SRQL Algebra
Users issue discovery queries using our new SRQL alge-bra. SRQL defines several operators such that each operator takes as input columns, tables or keywords and produces a set of datasets. We define five classes of primitives: (i) Edge primitives return the nodes connected with an input column or table. For example, there is an edge primitive to retrieve columns with similar attribute name, or those with similar content. (ii) Hyperedge primitives retrieve the tables that contain a given attribute, or the attributes contained in a given table. There exist hyperedges attributes for each type of hyperedges, e.g., for tables, and functional dependencies. (iii) Path primitives allow to explore the graph through path queries to answer queries such as: are A and B connected through a sequence of PK-FK joins? (iv) Set primitives are the main building blocks to combine the other primitives into SRQL queries. The “and”, “or” and set di↵erence prim-itives operate on sets of columns and tables. (v) Lookup primitives receive keywords and retrieve attributes and ta-bles from the graph that contains the keyword in either their values, column names, or table names.
2.2 Data Stitching and Join Path Selection
We assume that a user has run discovery to find therele-vant datasets. If the user is interested in a composite table containing a particular set of columns that are not avail-able in any single data source, she needs a way to stitch the relevant datasets together. For this purpose, we can use the PK-FK relationships described in the previous section to find a set of possible join paths to materialize the table of interest to the user. However, we still need to choose which of several possible join paths is the best to compute the ta-ble of interest. Since each join path leads to a di↵erent view with di↵erent semantics, quality and size, we first cluster the join paths based on their semantics and then choose the best join path with respect to both cleanliness (view qual-ity) and cardinality (view size). The user will then choose the one with the right semantics.
Join Path Clustering
Each join path is composed of a chain of tables. We use the “subject” column of each table to identify its semantics. We assume that the “subject” column in a table is the one that contains almost all unique values. Then we compare the tables in the chains of two join paths. If each pair of tables has a similar “subject” column, i.e., their domains have a large overlap, we put them into the same cluster as they probably have the same semantics.
Join Path Cleanliness Estimation
To estimate the join path cleanliness, we first need to esti-mate the cleanliness of each source table. To this end, we run multiple semi-automatic error detection tools to detect errors. Since not all the detected errors are true positives, we use the precision of the tools, i.e., the ratio of correctly identified errors, to estimate their cleanliness.
More specifically, suppose a set C of cells from the source tables have been already labeled by a user, either from pre-vious cleaning actions or on-demand for the current query. We need to estimate the cleanliness of the cells detected as errors by one or more tools. We use the sample labeling to for this purpose. More specifically, we estimate the precision p for the errors detected simultaneously by a set of n tools, T1, T2,¨ ¨ ¨ , Tn, by counting the ratio of true error cells in
CX ET1X ET2X ¨ ¨ ¨ X ETn. For any cell c detected
simulta-neously as an error by n tools, we estimate its cleanliness as 1´ p, which gives us a score between 0 and 1. Note that if a cell is not detected to be an error by any tool, we estimate its cleanliness as 1. Then, given a join path, we propagate the estimated cleanliness of all the source tables in the join path to the values in the view and aggregate them as the estimated cleanliness. The basic idea behind the cleanliness propagation is that any cell that participates in any predi-cate will transmit its cleanliness to the other cells within the same row. This is because the cleanliness of these cells will a↵ect the results of the predicate and will further a↵ect the cleanliness of the other cells within the same row.
2.3 On-Demand Data Cleaning
Cleaning all datasets that Data Civilizer has access to is clearly infeasible. In Data Civilizer, we take an approach where cleaning happens on-demand based on the query at hand. More specifically, the actual cleaning of a query result requires feedback from the user on how to change the value of a cell that we estimated to be erroneous. Since users are usually expensive, we limit their involvement to a set budget of cells to be cleaned. Given a user budget, we first need to
find out which cells to clean. If we clean all of the source tables, we may waste budget on irrelevant cells as not all of them will a↵ect the view. If we clean the view, the cleaned data can only be used for the current task and cannot benefit future queries. Thus, Data Civilizer only cleans the source cells that will a↵ect the view; these can be gathered from the cleanliness propagation process. As we cannot clean all of these cells, the next question is which cells to clean first. Our approach chooses the cells that are expected to have the biggest impact over the view. The impact is measured by an objective function that combines both the size and quality of the view. To compute the impact of each individual cell, we reverse the cleanliness propagation process and accumulate the expected cleanliness improvement of the value in the view for all the source cells.
3. DEMONSTRATION OVERVIEW
During the demonstration, the audience will experience several data scenarios. We describe bellow one using the MIT DWH. A data analyst of the MIT DWH receives a request from a customer in the human resources (HR) de-partment. The analyst wants to know which employees at MIT work for degree granting departments — some insti-tutes employ sta↵ but do not grant degrees. The job of the analyst is to scrape through the di↵erent sources of infor-mation available at MIT and find the relevant sources to the question at hand. They then put together a view that contains the necessary information, and fix possible data quality issues, before making the view available to the cus-tomer from HR. This process is time-consuming, brittle to changes in the underlying schemas, error-prone and has to be repeated for each single request. The Data Civilizer demo utilizes RHEEM [1] as a cross-platform execution en-gine in order to manage the information that spans multiple data models and data storages.
3.1 Finding Relevant Data
The discovery component of Data Civilizer allows searching for tables through their names, attributes, or con-tent, as well as through their relationships with other at-tributes and tables, as shown in Figure 2(a). Our system could be queried via a simple keyword search and by in-teracting with the user interface as shown in Figure 2 or directly via SRQL queries. As a first step, it seems useful to kick o↵ the discovery session with a simple search for tables that contain “Employee” in their name. In SRQL, this query is expressed as follows:
res = api.table_name_search("Employee")
A table named Employee directory.csv appears in the out-put. To double check the relevance, we inspect the schema too, so that we quickly gain an idea of its content. With this first successful search, we move onto finding tables that contain information related to “degree”. For that, instead of searching for tables with those keywords in them, we search for attributes named like that.
res = api.schema_name_search("degree")
In this case, the output has a higher cardinality. Many tables appear that contain attributes with the chosen key-words. There are two particular tables that contain an at-tribute “Is Degree Granting” that seems relevant in this case.
Employee
Join Path ID Cardinality Cleanliness Ranking Action
1 6319 0.952536 6019.07 Show
2 8087 0.965219 7805.73 Show
3 8297 0.960039 7965.44 Show
(a) Table and Join Path Selection
Employee
Table ID Row Column Impact Value Action
1 1169 11 0.965677 Unknown Get Row 1 1169 9 0.965677 Not available Get Row 1 9510 11 0.965677 Unknown Get Row 1 6082 7 0.960111 9999999999 Get Row 1 10178 7 0.960059 1111111111 Get Row (b) On-Demand Cleaning Figure 2: Demonstration Overview
However, both tables seem to refer to di↵erent semantics. Which one is the appropriate one? One advantage of the SRQL algebra is that it permits users to incorporate all the intuition they have into a more refined query. For example, we know that the table we are looking for must be associ-ated to departments. We can write this more refined query to capture this intuition:
res1 = api.schema_name_search("degree") res2 = api.table_name_search("department") res3 = api.intersection(res1, res2)
Not only we are interested in tables with attributes related to degrees, but also those that are related to departments, and in particular, the intersection of both. The output of this more refined query seems promising. So we put it apart. We have found so far two tables that seem to be relevant. The next step is to find a strategy to join them together.
3.2 Finding Candidate Views
At this point we have found two tables that seem to con-tain the information we need. Our next step is to join them together into a view that we can use to answer our original question. We can define an SRQL query that finds JOIN PATHS between arbitrary sets of attributes, for example, between two tables, as follows:
drs_t1 = api.drs_from_table("Employee_directory.csv") drs_t2 = api.drs_from_table("Sis_department.csv") res = api.paths_between(
drs_t1, drs_t2, Relation.PKFK, max_hops=2)
The above query is used for join path selection shown in Figure 2(a). The query takes two sets of attributes, repre-senting the source and target tables, respectively, and Data Civilizer finds paths between these sets of attributes ac-cording to a PK-FK relationship. Optionally, we can also define the maximum number of hops we are willing to take. The output of this query is shown in Figure 2(a). There are 3 di↵erent join paths between the tables, or 3 di↵erent ways of creating the view. Which one should we use?
3.3 Choosing the Best View
The join path selection component of Data Civilizer provides the user with a ranking of the suggested join paths based on their cardinality and cleanliness (as explained in Section 2.2). Figure 2(a) shows the suggested join paths
after sorting them based on the cardinality and the clean-liness. The user will select the most relevant join paths to the task at hand.
3.4 On-Demand Cleaning
After selecting a join path, the data in the returned view needs to be cleaned before making any conclusions. For this purpose, a set of dirty cells (selected as described in Sec-tion 2.3) is returned to the user who will clean them up to the available budget. The cleanliness estimation compo-nent of Data Civilizer computes the impact of cleaning each data cell. Data Civilizer gives the user the informa-tion in Figure 2(b) and allows her to retrieve and clean the tuples that include the dirty cells. Since this process may be performed in multiple iterations, once a set of updates are applied to the data, the di↵erent cleanliness scores may change and hence the set of source cells to be cleaned first may also change. Cleaned data is pushed downstream for use by future queries.
4. REFERENCES
[1] D. Agrawal, M. L. Ba, L. Berti-Equille, S. Chawla, A. K. Elmagarmid, H. Hammady, Y. Idris, Z. Kaoudi, Z. Khayyat, S. Kruse, M. Ouzzani, P. Papotti, J. Quian´e-Ruiz, N. Tang, and M. J. Zaki. Rheem: Enabling multi-platform task execution. In SIGMOD 2016.
[2] M. J. Cafarella, A. Y. Halevy, and N. Khoussainova. Data integration for the relational web. PVLDB, 2(1):1090–1101, 2009.
[3] D. Deng, R. C. Fernandez, Z. Abedjan, S. Wang, A. Elmagarmid, I. F. Ilyas, S. Madden, M. Ouzzani, M. Stonebraker, and N. Tang. The Data Civilizer System. In CIDR, 2017.
[4] J. Duggan, A. J. Elmore, M. Stonebraker, M. Balazinska, B. Howe, J. Kepner, S. Madden, D. Maier, T. Mattson, and S. B. Zdonik. The bigdawg polystore system. SIGMOD Record, 44(2):11–16, 2015. [5] E. Rahm and H. H. Do. Data cleaning: Problems and
current approaches. IEEE Data Eng. Bull., 23(4):3–13, 2000.