HAL Id: inserm-01996812
https://www.hal.inserm.fr/inserm-01996812
Submitted on 28 Jan 2019
HAL is a multi-disciplinary open access archive for the deposit and dissemination of sci-entific research documents, whether they are pub-lished or not. The documents may come from teaching and research institutions in France or abroad, or from public or private research centers.
L’archive ouverte pluridisciplinaire HAL, est destinée au dépôt et à la diffusion de documents scientifiques de niveau recherche, publiés ou non, émanant des établissements d’enseignement et de recherche français ou étrangers, des laboratoires publics ou privés.
Microarray Data Using High-Dimensional Cox
Regression Models
Christophe Zemmour, Francois Bertucci, Pascal Finetti, Bernard Chetrit,
Daniel Birnbaum, Thomas Filleron, Jean-Marie Boher
To cite this version:
Christophe Zemmour, Francois Bertucci, Pascal Finetti, Bernard Chetrit, Daniel Birnbaum, et al.. Prediction of Early Breast Cancer Metastasis from DNA Microarray Data Using High-Dimensional Cox Regression Models. Cancer Informatics, Libertas Academica, 2015, 14(Suppl 2), pp.129-138. �10.4137/cin.s17284�. �inserm-01996812�
Introduction
DNA microarray studies identified gene expression signatures predictive of metastatic relapse in patients with early breast cancer.1–3 Full validation of such signatures across
indepen-dent studies needs to overcome difficulties inherent to the use of many methodological differences concerning the meth-ods for measuring mRNA expression levels, the microarray
platforms, the data processing, and analysis methods used to predict the study outcome and classify the patients into low- and high-risk categories.4
In the first major studies published, the authors reduced the set of predictive genes by applying a simple univariate fea-ture selection. For example, van’t Veer et al successfully pre-dicted the 5-year metastatic status in a population of lymph
Prediction of Early Breast Cancer Metastasis from
DNA Microarray Data Using High-Dimensional Cox
Regression Models
Christophe Zemmour
1, françois Bertucci
2,3, Pascal finetti
2, Bernard Chetrit
4, Daniel Birnbaum
2,
thomas filleron
5and Jean-marie Boher
11Département de la Recherche Clinique et de l’Innovation, Unité de Biostatistique et de Méthodologie, Institut Paoli-Calmettes, Marseille, France. 2Département d’Oncologie Moléculaire, Institut Paoli-Calmettes, Centre de Recherche en Cancérologie de Marseille, INSERM, CNRS, Marseille, France. 3Département d’Oncologie Médicale, Institut Paoli-Calmettes, Centre de Recherche en Cancérologie de Marseille, INSERM, CNRS, Marseille, France. 4Centre de Recherche en Cancérologie de Marseille, INSERM, CNRS, Marseille, France. 5Bureau des Essais Cliniques, Cellule Biostatistique, Institut Claudius Regaud, Institut Universitaire du Cancer Toulouse Oncopôle, Toulouse, France. Supplementary Issue: Computer Simulation, Bioinformatics, and Statistical Analysis of Cancer Data and Processes
AbstrAct
bAckground: DNA microarray studies identified gene expression signatures predictive of metastatic relapse in early breast cancer. Standard feature selection procedures applied to reduce the set of predictive genes did not take into account the correlation between genes. In this paper, we studied the performances of three high-dimensional regression methods – CoxBoost, LASSO (Least Absolute Shrinkage and Selection Operator), and Elastic net – to identify prognostic signatures in patients with early breast cancer.
Methods: We analyzed three public retrospective datasets, including a total of 384 patients with axillary lymph node-negative breast cancer. The Amsterdam van’t Veer’s training set of 78 patients was used to determine the optimal gene sets and classifiers using sensitivity thresholds resulting in mis-classification of no more than 10% of the poor-prognosis group. To ensure the comparability between different methods, an automatic selection procedure was used to determine the number of genes included in each model. The van de Vijver’s and Desmedt’s datasets were used as validation sets to evaluate separately the prognostic performances of our classifiers. The results were compared to the original Amsterdam 70-gene classifier.
results: The automatic selection procedure reduced the number of predictive genes up to a minimum of six genes. In the two validation sets, the three models (Elastic net, LASSO, and CoxBoost) led to the definition of genomic classifiers predicting the 5-year metastatic status with similar perfor-mances, with respective 59, 56, and 54% accuracy, 83, 75, and 83% sensitivity, and 53, 52, and 48% specificity in the Desmedt’s dataset. In comparison, the Amsterdam 70-gene signature showed 45% accuracy, 97% sensitivity, and 34% specificity. The gene overlap and the classification concordance between the three classifiers were high. All the classifiers added significant prognostic information to that provided by the traditional prognostic factors and showed a very high overlap with respect to gene ontologies (GOs) associated with genes overexpressed in the predicted poor-prognosis vs. good-prognosis classes and centred on cell proliferation. Interestingly, all classifiers reported high sensitivity to predict the 4-year status of metastatic disease.
conclusIons: High-dimensional regression methods are attractive in prognostic studies because finding a small subset of genes may facilitate the transfer to the clinic, and also because they strengthen the robustness of the model by limiting the selection of false-positive predictive genes. With only six genes, the CoxBoost classifier predicted the 4-year status of metastatic disease with 93% sensitivity. Selecting a few genes related to ontologies other than cell proliferation might further improve the overall sensitivity performance.
keywords: breast cancer, genomics, metastasis, boosting, cross-validation SUPPLEMENT: Computer simulation, Bioinformatics, and statistical analysis of Cancer
Data and Processes
CITATIoN: Zemmour et al. Prediction of early Breast Cancer metastasis from Dna
microarray Data Using High-Dimensional Cox regression models. Cancer Informatics 2015:14(s2) 129–138 doi: 10.4137/CIn.s17284.
RECEIvED: December 03, 2014. RESUBMITTED: march 17, 2015. ACCEPTED foR PUBLICATIoN: march 20, 2015.
ACADEMIC EDIToR: J.T. Efird, Editor in Chief TYPE: original research
fUNDINg: the study was supported by the french Institute for Public Health research
(IRESP, AAR 2013–14). The authors confirm that the funder had no influence over the study design, content of the article, or selection of this journal.
CoMPETINg INTERESTS: Authors disclose no potential conflicts of interest.
CoRRESPoNDENCE: [email protected]
CoPYRIgHT: © the authors, publisher and licensee Libertas academica Limited. this is
an open-access article distributed under the terms of the Creative Commons CC-BY-NC 3.0 License.
Paper subject to independent expert blind peer review by minimum of two reviewers. All
editorial decisions made by independent academic editor. Upon submission manuscript was subject to anti-plagiarism scanning. Prior to publication all authors have given signed confirmation of agreement to article publication and compliance with all applicable ethical and legal requirements, including the accuracy of author and contributor information, disclosure of competing interests and funding sources, compliance with ethical requirements relating to human and animal study participants, and compliance with any copyright requirements of third parties. this journal is a member of the Committee on Publication ethics (CoPe).
node-negative breast cancer patients by first ranking each candidate gene according to the magnitude of its correlation coefficient with the study outcome observed in a training set of 78 randomly selected patients.1 The list of the 70 most-correlated
genes (hereafter called the Amsterdam 70-gene signature) was identified using a leave-one-out cross-validation procedure as the optimal gene set that best predicted the 5-year status of metastatic disease. The resulting prognostic classification was based on the correlation coefficients of the top-ranked 70 genes with the average good-prognosis profile established using the expression profile of the optimal gene set among the patients free of metastatic relapse at 5 years in the training set. For this purpose, patients were then assigned to good-prognosis (low risk) and poor-prognosis (high risk) groups according to an optimized sensitivity threshold resulting in misclassi-fication of not more than 10% of the poor-prognosis group in the training set. The good performance of this 70-gene classifier was first verified in an independent validation set of 19 patients with lymph node-negative breast cancer, then in an independent series of 295 (including 61 from the original training set) consecutive patients with lymph node-negative disease and lymph node-positive disease.2
Later, in 2005, Wang et al identified from a training set of 115 tumors a 76-gene signature predictive of the develop-ment of distant metastasis in patients with lymph node- negative breast cancer.3 Similar to van’t Veer et al, a bootstrap
univariate Cox regression feature selection procedure was conducted for determining the list of genes ranked according to their association with the metastasis-free survival (MFS). The individual relapse scores were first derived by summing individual expressions of candidate genes weighted by their corresponding standardized Cox’s regression coefficients. A list of 76 genes was selected as the optimal gene set by add-ing sequentially the top-ranked genes until a maximum AUC (area under the curve) was reached, of whom 60 genes related to estrogen receptor (ER)-positive patients and 16 genes to ER-negative patients. The threshold relapse score was deter-mined from the ROC (receiver operating characteristic) curve of the training set to ensure 100% sensitivity and the highest specificity. The prognostic value of this 76-gene signature was validated in an independent set of 171 patients with lymph node-negative disease. Like the 70-gene signature, this sig-nature was a strong predictor of the metastatic risk even when corrected for traditional prognostic factors in multivariable analysis and a highly informative tool in predicting patients with early distant metastases. Despite very similar prognostic performances, these 70-gene and 76-gene signatures showed a small gene overlap with only three genes in common.3
Here, we propose to study the performance of three high-dimensional Cox regression models for determining the list of outcome predictive genes and the rules for prognostic classifi-cation: the LASSO (Least Absolute Shrinkage and Selection Operator),5 CoxBoost,6 and Elastic net methods.7 As opposed
to standard multivariable regression analysis, these selection
methods handle high-dimensional regression variables with no prior feature selection step by shrinking all the sion coefficients toward zero, and thus forcing many regres-sion variables to be exactly zero. Such shrinkage and stepwise regression methods have been shown by many authors to out-perform the simple dimension reduction methods for survival prediction from microarray data.8–12 To our knowledge, the
accuracy and predictive performances in independent vali-dation sets of classifiers derived from high-dimensional Cox regression models have been less studied.
In this article, we have used a systematic approach for training an entire classifier based on three such modeling strategies on the well-known original van’t Veer dataset. The selection of predictive genes and the rules associated with the prognostic classifier were developed in the training set selected by van’t Veer et al, thus allowing a direct compari-son with the well-established Amsterdam 70-gene signature yet used in clinical routine in several countries. The internal van’t Veer’s validation dataset and two external validation sets (van de Vijver’s and Desmedt’s datasets) were used to evaluate the diagnostic accuracy, the predictive performances, and the classifier transferability into clinic.
Materials and Methods
breast cancer datasets. We downloaded three ret-rospective datasets of node-negative early breast cancer samples profiled using oligonucleotide microarrays (Supple-mentary Table 1). Gene expression and histoclinical data were retrieved from National Center for Biotechnology Informa-tion Gene Expression Omnibus (NCBI GEO) database and authors’ websites. Only samples from women with all the following annotations available were selected for the present study: patients’ age, pathological tumor size and grade, ER and V-ERB-B2 avian erythroblastic leukemia viral oncogene homolog 2 (ERBB2) statutes, and follow-up.
The van’t Veer’s dataset included 97 patients (78 in the training set and 19 in the validation set),1 46 of whom
devel-oped distant metastasis within 5 years. The van de Vijver’s data-set included 151 patients (61 of whom were also in the van’t Veer’s study),2 40 of whom developed distant metastasis within
5 years. The Desmedt’s dataset included 197 patients,13 of whom
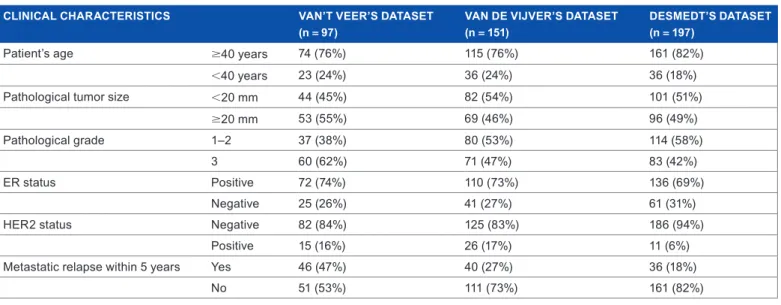
36 developed distant metastasis within 5 years. The three data-sets included a total of 384 unique pretreatment samples, whose histoclinical characteristics are summarized in Table 1.
gene expression data processing. The three datasets used two different oligonucleotide-based technological plat-forms (Agilent and Affymetrix). Before analysis, data were processed. First, we mapped hybridization probes. Agilent probes annotations were retrieved and updated using both SOURCE (http://smd.stanford.edu/cgi-bin/source/source-Search) and EntrezGene (Homo sapiens gene information db, release from 09/12/2008, ftp://ftp.ncbi.nlm.nih.gov/ gene/), whereas Affymetrix annotations were updated using NetAffx Annotation files (www.affymetrix.com; release from
Prediction of early breast cancer metastasis
01/12/2008). All probes were then mapped based on their EntrezGeneID. When multiple probes represented the same GeneID, the one with the highest variance was selected to represent the GeneID in the corresponding dataset.
Second, each dataset was normalized separately. For the two Agilent sets, we applied quantile normalization to available processed data. For the Affymetrix set, we applied robust mul-tichip average (RMA) to the raw data with the non-parametric quantile algorithm as normalization parameter.14 Quantile
normalization and RMA were done in R using Bioconductor and associated packages. As the dataset used for training the models were the van’t Veer’s one, we also proceeded with these data, as the authors, to a final selection of the probes signifi-cantly regulated, namely, with at least a two-fold difference in more than five tumors.1 After these processing steps, data were
analyzed. To avoid biases related to immunohistochemistry (IHC) across different institutions and to increase the amount of informative data, the expression statutes (negative/positive) of ER, progesterone receptor (PR), and ERBB2 were defined using mRNA expression data of ESR1, PGR, and ERBB2 genes, respectively, as previously described.15
genomic prognostic classifier selection using high-dimensional cox models. High-high-dimensional Cox regression models. The CoxBoost algorithm is a stepwise selection method, which starts from the null model and updates the estimate of only one regression coefficient at each step, the one that most improves a first-order approximation of a penalized log-partial likelihood of a Cox model, under a defined condition of shrinkage. Once selected, the estimators remain in the model and the dimension is incremented by one at each step. The iterative nature of the boosting method allows to stop the process at the step in which the model better explains the data while accounting for the potential correlations between variables, retaining only the most relevant predictors, whereas setting the others to zero.
Both LASSO and Elastic net methods shrink the estimates of the regression coefficients toward zero relative to the maximum likelihood estimates by maximizing a penali-zed log-partial likelihood function using penalty functions. Applying L1 penalty, the LASSO method tends to select a few set of predictive genes with little shrinkage, whereas Elas-tic net, by weighting L1 and L2 penalty functions, tends to set fewer regression coefficients to be exactly zero and to apply more shrinkage to the remaining coefficients.
Choice of tuning parameters. To ensure the comparability between different methods, we used an automatic selection procedure to set the parameters and to determine the number of predictive genes to be included in each model.8 The gene
expression levels were treated as continuous values in these models.
For the CoxBoost model, we used the cross-validation routine optimCoxBoostPenalty implemented in the package CoxBoost for R version 1.416 to first determine the optimal
penalty (amount of shrinkage), with a k-fold equal to 5. Once this parameter was determined, the other tuning parameter of the algorithm, namely, the number of boosting steps to per-form, was selected via the function cv.CoxBoost, with also a k-fold equal to 5. The dimension of the selected multivariate Cox model was finally set by the principal routine CoxBoost.
For the LASSO and Elastic net methods, the regulariza-tion parameter λ was chosen via the cross-validaregulariza-tion routine cv.glmnet before running the main algorithm implemented in the R package glmnet version 1.9–8,17,18 with a k-fold equal to 5.
The other tuning parameter of the Elastic net method, the mixing parameter α, which determines the balance between the L1 and L2 penalties, was set to a default value of 0.5 in order to have a more flexible alternative to the LASSO procedure.
Prognosis prediction. For each selected multivariate model, a classifier predicting the risk of metastatic relapse was based
Table 1. Clinical characteristics in the three breast cancer datasets.
CLINICAL CHARACTERISTICS vAN’T vEER’S DATASET
(n = 97) vAN DE vIjvER’S DATASET (n = 151) DESMEDT’S DATASET (n = 197)
Patient’s age $40 years 74 (76%) 115 (76%) 161 (82%)
,40 years 23 (24%) 36 (24%) 36 (18%)
Pathological tumor size ,20 mm 44 (45%) 82 (54%) 101 (51%)
$20 mm 53 (55%) 69 (46%) 96 (49%)
Pathological grade 1–2 37 (38%) 80 (53%) 114 (58%)
3 60 (62%) 71 (47%) 83 (42%)
er status Positive 72 (74%) 110 (73%) 136 (69%)
Negative 25 (26%) 41 (27%) 61 (31%)
Her2 status Negative 82 (84%) 125 (83%) 186 (94%)
Positive 15 (16%) 26 (17%) 11 (6%)
metastatic relapse within 5 years Yes 46 (47%) 40 (27%) 36 (18%)
on the linear predictor given by the model. Following van’t Veer et al,1 the threshold for discriminating between predicted
poor prognosis vs. good prognosis was determined as the sen-sitivity threshold (defined as the proportion of actual poor-prognosis patients assigned to the predicted poor-poor-prognosis class) resulting in misclassification of no more than 10% of the poor-prognosis group in the training set.
In the first step, each method was applied and the mod-els were trained in the original van’t Veer’s training set of 78 patients,1 34 of whom showed metastatic relapse within
5 years. In the second phase, the methodology was repeated in the same training set of 78 patients, but applied only to the 10,002 genes shared by the van’t Veer’s, van de Vijver’s, and Desmedt’s genomics platforms to make possible the applica-tion of defined multigene predictors in their entirety on the two latter datasets for testing their robustness.
strategy for assessing and comparing performances of the prognostic classifiers. The clinical endpoint was the MFS, defined as the duration from the date of diagnosis of breast cancer to the date of metastatic relapse and censored after 5 years of follow-up. The predictive ability and the robustness of the classifiers were first assessed on the original van’t Veer’s validation set (19 patients). We will refer to this validation as internal validation. In the second step, they were evaluated in the independent van de Vijver’s and Desmedt’s datasets.2,13 We will refer to this validation step as external
validation. The sample classifications based on the 70-gene signature were retrieved for the three datasets in their respec-tive original publications and served as a benchmark classifi-cation of tumor samples.
Prognostic evaluation criteria. The main evaluation crite-ria of each classifier, including the 70-gene signature, in each validation set were its sensitivity, specificity, and accuracy in term of prediction of metastatic relapse at 5 years. The sensi-tivity was defined as the proportion of actual relapses within 5 years attributed to the poor-prognosis class. The specificity was defined as the proportion of patients remaining relapse-free at 5 years attributed to the good-prognosis class. The accuracy was defined as the proportion of patients attributed to the prognostic class corresponding well to their actual status.
Other prognostic evaluation criteria were the hazard ratios (HRs) for metastatic relapse in the predicted poor-prognosis class vs. good-prognosis class, unadjusted and adjusted for the classical prognostic histoclinical variables. The latter were dichotomized as follows: thresholds were 40 years for the patients’ age and 20 mm for the pathological tumor size, whereas the pathological grade was treated as #2 vs. 3 and the ER and Human Epidermal Growth Factor Receptor-2 (HER2) statutes as negative vs. positive. Survivals were calcu-lated using the Kaplan–Meier method, and curves were com-pared with the log-rank test. HRs were estimated with 5% confidence intervals using the standard Cox regression model. We also assessed the concordance of classifications based on
the four models by using two-way contingency-table analyses and Fisher’s exact test.
Biological coherence. To explore the biological pathways linked to our classifiers in breast cancer, we applied Gene Set Enrichment Analysis (GSEA) (http://www.broadinstitute. org/gsea/) for comparing the expression profiles of pre-dicted poor-prognosis vs. good-prognosis classes in the van de Vijver’s and Desmedt’s datasets.19 Analysis was limited to
the gene ontology (GO) gene sets (list C5) from the Molecu-lar Signatures database (http://www.broadinstitute.org/gsea/ msigdb). Before analysis, each dataset was filtered to remove probes with low and poorly measured expression and standard deviation inferior to 0.25 log2 units, resulting in 11,184 and 12,712 genes, respectively. We used the signal-to-noise metric for ranking these filtered genes, weighted enrichment statistic for computing enrichment score (ES) of each gene set tested, and 1000 phenotype permutations to evaluate significance. Gene sets were retained as significant at the 5% level with a false discovery rate (FDR) under 25%.
results
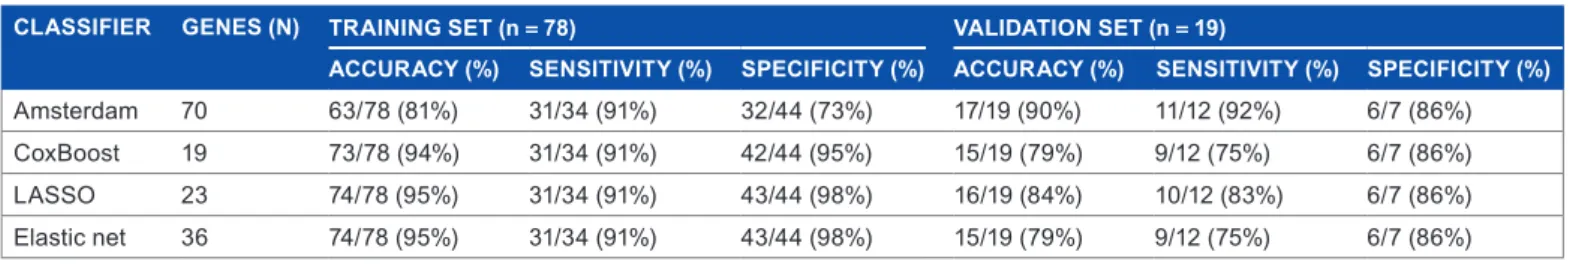
Internal performances and validation of the prognos-tic classifiers. CoxBoost, LASSO, and Elasprognos-tic net applied to the van’t Veer’s training set (78 samples) identified prognostic models of 19, 23, and 36 genes, respectively, whose lists are nested, except for two genes of the CoxBoost model, which are not included in the two latter lists (data not shown). Each model was then applied to classify these 78 samples. As expected, the performances were excellent (Table 2): accuracy, sensitivity, and specificity of classifications were, respectively, 94, 91, and 95% for the CoxBoost model, 95, 91, and 98% for the LASSO model, and 95, 91, and 98% for the Elastic net model. For comparison, the Amsterdam 70-gene signature showed 78% accuracy, 91% sensitivity, and 68% specificity.
The predictive performance of our models was then tested in the internal validation set (n = 19 patients). The 5-year metastatic relapse was predicted by all four classifiers with two–four out of 19 incorrect classifications. The Cox-Boost and Elastic net models classified the patients exactly in the same groups (79% accuracy, 75% sensitivity, and 86% specificity). The LASSO classifier showed performances (84% accuracy, 83% sensitivity, and 86% specificity) similar to those of the Amsterdam 70-gene signature (90% accuracy, 92% sen-sitivity, and 86% specificity) for 5-year MFS on the validation set (Table 2). The estimated HRs for metastatic relapse in the predicted poor-prognosis class as compared to the predicted good-prognosis class were 5.34 [1.39–20.44] (P = 0.007) for the CoxBoost model, 6.59 [1.41–30.91] (P = 0.007) for the LASSO model, 5.34 [1.39–20.44] (P = 0.007) for the Elas-tic net, and 8.93 [1.89–42.21] (P = 0.001) for the Amsterdam 70-gene signature.
external validation and performances of the prognos-tic classifiers. The same methodology was repeated in the same training set (78 samples), but limited to the 10,002 genes
Prediction of early breast cancer metastasis
common to the genomics platforms used in the van’t Veer’s, van de Vijver’s, and Desmedt’s datasets, to define genomic predictors applicable in their entirety on the two external vali-dation datasets. The optimal number of genes was smaller than previously, with 6, 18, and 29 genes for CoxBoost, LASSO, and Elastic net, respectively (Supplementary Table 2), but showed clear overlap with the corresponding gene lists above identified in the van’t Veer’s learning set (data not shown). These 6-, 18-, and 29-gene classifiers also showed strong over-lap when compared together: the six genes included in the CoxBoost model were included in the 18 genes of the LASSO model, which were all but one included in the 29-gene Elastic net model. Each classifier was then applied to the two external validation sets separately, and its performances were tested.
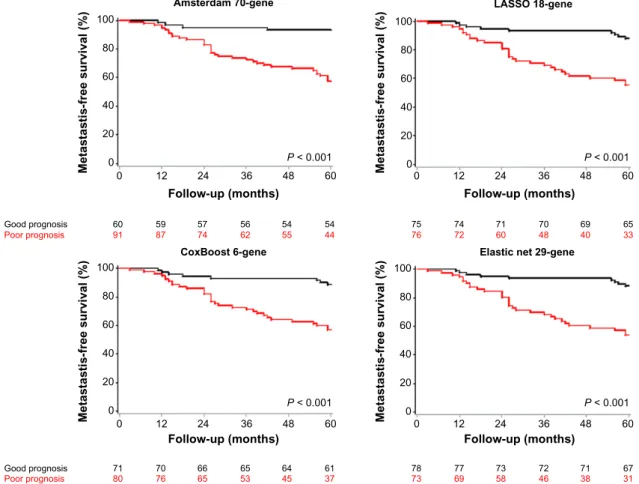
van de Vijver’s dataset. Results of sensitivity, specificity, and accuracy in the van de Vijver’s population are shown in Table 3. CoxBoost, LASSO, and Elastic net kept good and comparable performances, while reaching until 62% in speci-ficity for Elastic net. The CoxBoost, LASSO, and Elastic net classifiers were quite accurate (63, 64, and 66%, respec-tively). Particularly, the Elastic net signature was stable in terms of sensitivity. These results obtained in a larger inde-pendent validation set confirmed the robustness of our clas-sifiers and suggested similar performances between them. HRs for metastatic relapse in the predicted poor-prognosis class as compared to the predicted good-prognosis class were 4.57 [2.1–9.95] (P , 0.001) for the CoxBoost model, 4.58 [2.18–9.66] (P , 0.001) for the LASSO model, and 4.94 [2.35–10.41] (P , 0.001) for the Elastic net model. The Amsterdam 70-gene classifier was also highly significant, with a HR equal to 7.57 [2.69–21.29]. When observing the related survival curves (Fig. 1), it appeared that the CoxBoost, LASSO, and Elastic net classifiers were able to detect a large number of actual relapses regularly observed within 5 years,
while misclassifying some patients with actual relapse close to the 5-year timepoint by attributing them to the predicted good-prognosis class. Models according to higher weight in this later period would be probably more accurate to predict the metastasis relapse around the 5-year perspective. This observation can be related to the fact that the classifiers are linked to proliferation functions. The CoxBoost, LASSO, and Elastic net classifiers were also highly significant in mul-tivariate models, with HRs above 3.61 (Table 4). Particularly, they were more significant while having HRs inferior to that of the Amsterdam 70-gene signature. The low specificity of the Amsterdam signature may explain its high and more variable HRs.
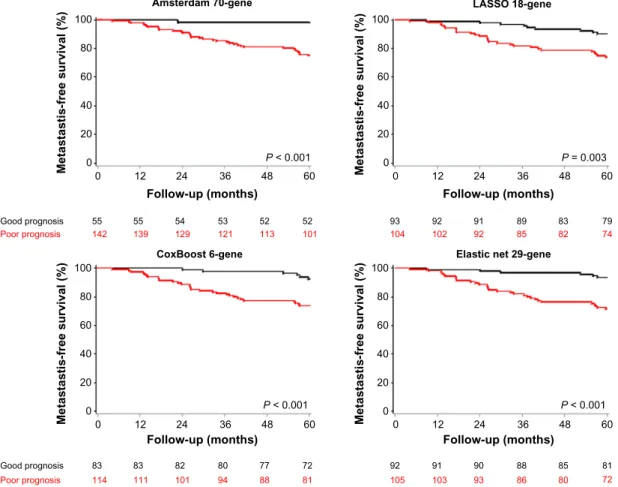
Desmedt’s dataset. In the Desmedt’s set (Table 3), the CoxBoost, LASSO, and Elastic net classifiers had again a good sensitivity (83, 75, and 83%, respectively), while having a specificity above 50% for LASSO and Elastic net (52 and 53%, respectively). The latter classifier remained the most accurate (59%), outperforming by 14% the very sensi-tive (97%) Amsterdam 70-gene signature that was 45% accurate. The univariate HRs for metastatic relapse were 4.14 [1.72–9.95] (P , 0.001) for the CoxBoost classifier, 2.96 [1.39–6.3] (P = 0.003) for the LASSO classifier, 4.95 [2.06–11.89] (P , 0.001) for the Elastic net classifier, and 15.19 [2.08–110.88] (P , 0.001) for the Amsterdam 70-gene signature. The related MFS curves (Fig. 2) had a similar pat-tern to their van de Vijver’s dataset counterparts, with some patients misclassified close to the 5-year timepoint. The Elastic net classifier was again more significant in the multi-variate model (Table 4) than the Amsterdam 70-gene classi-fier (P = 0.003 and P = 0.005, respectively), while having HRs inferior but less variable. Especially, the other two classifiers (CoxBoost and LASSO) were also confirmed in a multivariate model on this external validation dataset.
Table 2. Prognostic performances of the four classifiers in the van’t Veer’s training (n = 78) and internal validation (n = 19) sets.
CLASSIfIER gENES (N) TRAININg SET (n = 78) vALIDATIoN SET (n = 19)
ACCURACY (%) SENSITIvITY (%) SPECIfICITY (%) ACCURACY (%) SENSITIvITY (%) SPECIfICITY (%)
amsterdam 70 63/78 (81%) 31/34 (91%) 32/44 (73%) 17/19 (90%) 11/12 (92%) 6/7 (86%)
CoxBoost 19 73/78 (94%) 31/34 (91%) 42/44 (95%) 15/19 (79%) 9/12 (75%) 6/7 (86%)
Lasso 23 74/78 (95%) 31/34 (91%) 43/44 (98%) 16/19 (84%) 10/12 (83%) 6/7 (86%)
elastic net 36 74/78 (95%) 31/34 (91%) 43/44 (98%) 15/19 (79%) 9/12 (75%) 6/7 (86%)
Table 3. Prognostic performances of the four classifiers in the external validation sets.
CLASSIfIER gENES (N) vAN DE vIjvER’S DATASET (n = 151) DESMEDT’S DATASET (n = 197)
ACCURACY (%) SENSITIvITY (%) SPECIfICITY (%) ACCURACY (%) SENSITIvITY (%) SPECIfICITY (%)
amsterdam 70 92/151 (61%) 36/40 (90%) 56/111 (50%) 89/197 (45%) 35/36 (97%) 54/161 (34%)
CoxBoost 6 95/151 (63%) 32/40 (80%) 63/111 (57%) 107/197 (54%) 30/36 (83%) 77/161 (48%)
Lasso 18 97/151 (64%) 31/40 (78%) 66/111 (59%) 111/197 (56%) 27/36 (75%) 84/161 (52%)
concordance of predictions and biological signifi-cance of the classifiers. We compared the concordances of predictions (prognostic classifications) based on the three models and the 70-gene signature using two-way contingency-table analyses in each external validation set. All the compari-sons yielded significant correlations (P , 0.001, Fisher’s exact test). The concordance rates (Supplementary Table 3) between our three classifiers ranged from 87 to 94% in the van de Vijver’s samples and 76 to 92% in the Desmedt’s samples, with the Elastic net model having the highest level of correlation with the two other models in each dataset. The concordance rates between each of our classifiers and the 70-gene classifier ranged from 73 to 75% in the van de Vijver’s samples and 63 to 66% in the Desmedt’s samples.
Such high concordance rates were rather expected bet-ween our three classifiers given the strong overlap betbet-ween the three gene lists (Supplementary Table 2). We also compared the genes included in our three models with the 48 unique named genes present in the 70-gene signature (Supplementary Table 4): four genes out of six (67%) of the CoxBoost classi-fier were included within the 48 genes (8%), six genes out of 18 (33%) of the LASSO classifier were included within the 48 genes (13%), and seven genes out of 29 (24%) of the Elastic net classifier were included within the 48 genes (15%).
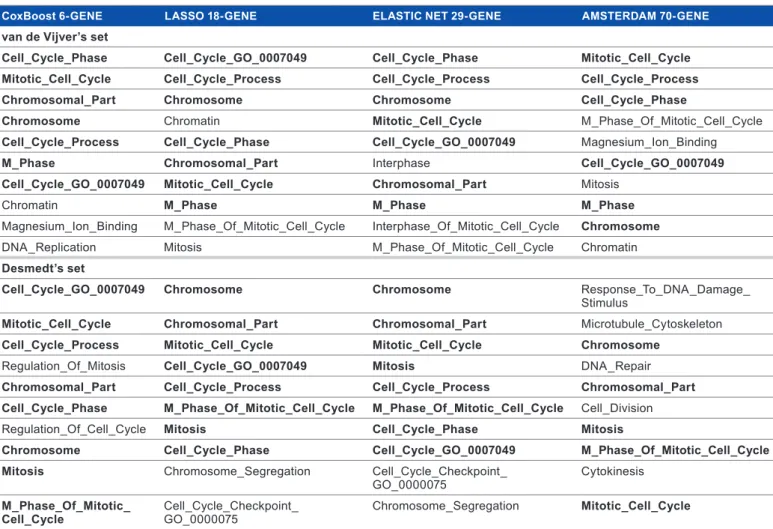
No GO analysis could be applied directly to our three clas-sifiers because of the low number of genes included. We thus applied GSEA to each classification in each external validation dataset. In all analyses, the significant ontologies were associ-ated with genes overexpressed in the predicted poor-prognosis class and by far the most represented ones were related to cell proliferation, including for example “cell cycle phase,” “cell cycle process,” “mitotic cell cycle,” “M phase,” “interphase,” “DNA replication,” and “mitosis.” Table 5 shows the top 10 GOs. As expected given the strong gene overlap, the overlap between these three classifiers regarding the overrepresented GOs was very important (Supplementary Fig. 1). More interestingly, a similar strong overlap was observed with the GOs overrepre-sented with the 70-gene signature, despite a much smaller gene overlap. Clearly, these results suggested that our three classifi-ers were biologically relevant and associated with the same bio-logical phenotype, mainly cell proliferation, which was higher in the predicted poor-prognosis classes.
discussion
In their pioneered work, van’t Veer et al used microarrays to generate the transcriptional profile of 97 early breast cancers and identified a 70-gene signature predictive of the early development of distant metastasis, even when corrected for the Amsterdam 70-gene 100 Metastastis-free survival (%) 80 60 40 20 0 0 Good prognosis 60 59 57 56 54 54 87 91 74 62 55 44 7675 7472 7160 4870 4069 6533 Poor prognosis 12 24 36 Follow-up (months) P < 0.001 60 48 LASSO 18-gene Metastastis-free survival (%) 0 12 24 36 Follow-up (months) P < 0.001 60 48 CoxBoost 6-gene 100 Metastastis-free survival (%) 80 60 40 20 0 0 Good prognosis 71 70 66 65 64 61 76 80 65 53 45 37 7378 7769 7358 4672 3871 6731 Poor prognosis 12 24 36 Follow-up (months) P < 0.001 60 48
Elastic net 29-gene
100 Metastastis-free survival (%) 80 60 40 20 0 0 12 24 36 Follow-up (months) P < 0.001 60 48 100 80 60 40 20 0
figure 1. MFS curves for the four classifiers in the van de Vijver’s external validation set. Kaplan–Meier curves are shown for the Amsterdam 70-gene
signature (top left), the LASSO classifier (top right), the CoxBoost classifier (bottom left), and the Elastic net classifier (bottom right). P-values are estimated using the log-rank test.
Prediction of early breast cancer metastasis main histoclinical prognostic factors.1 Their work was a major
breakthrough leading to the definition of several prognostic expression signatures with similar performances in untreated breast cancer patients and other cancer diseases.
Since these pioneering studies, survival prediction has been subject to much research during the last few years. High-dimensional Cox regression models have been shown to outperform the simple variable selection methods for survival prediction from gene expression data, from a multivariate point of view.8–12 However, to our knowledge, the performance of
high-dimensional Cox regression models for the definition of prognostic gene signatures has been less studied in the litera-ture. In this paper, we have aimed at adding a step of classifier derivations from the selected models and we have studied the performance of such methods for developing an entire predic-tive signature for 5-year MFS from the van’t Veer’s dataset.
The objective of this study was to conduct an unbiased comparison of three different prognostic classifiers derived using three different high-dimensional Cox regression models. Prior to analysis, an automatic selection procedure was used to determine the number of predictive genes to be included in each model to ensure the comparability between the dif-ferent methods and ascertain that all methods are tuned to predict well on novel data.8 We do not strictly recommend
this approach, but the selection of the penalty via k-fold cross-validation and setting other tuning parameters to default val-ues permit a fair comparison between the different methods. More flexibility in the choice of the default parameterization may be desirable in practice because it may strongly affect the predictive performance of each method. This is also true for the determination of the cut-off value to predict the poor- and good-prognosis classes. The choice of optimal tuning para-meters is out of scope of the present manuscript, but still rep-resents a critical issue to be fully investigated.
The choice to determine the class membership using a cutoff value for the linear predictor resulting in a misclassifica-tion not superior to 10% of the actual poor-prognosis patients in the van’t Veer’s training set was also supported by the aim to select the patients who will most benefit from a chemo-therapy prescription. In other situations, an overall accuracy or an AUC represent better alternative measures to assess the overall performance or to predict the class membership (poor vs. good prognosis).
The three different strategies applied to the van’t Veer’s training set (78 samples) identified 19, 23, and 36 predic-tive genes, whose lists are almost nested. Five-year pre-diction accuracies computed in the internal validation set (n = 19) were close and quite good. The predictive ability and the transferability of the different modeling strategies for building an entire prognosis classifier were also validated in two additional independent datasets, on the basis of the 10,002 genes common to the van’t Veer’s, van de Vijver’s, and Desmedt’s datasets. The five-fold cross-validation procedure identified 6, 18, and 29 as the optimal number of predictive
T ab le 4 . M ul tiv ar ia te a na ly se s f or 5 -y ea r M FS i n t he e xt er na l v al id at io n s et s. C LA SSI fI ER PA TI EN T’ S A g E (, 40 YE A R S) PA TH o Lo g ICA L TU M o R SI zE ( $ 20 mm ) PA TH o Lo g ICA L TU M o R g R A D E ( 3) ER ST AT U S (N Eg AT Iv E) H ER 2 ST AT U S (P o SI TI vE ) SI g N AT U R E ( PR ED IC TE D Po o R P R o g N o SI S) H A zA R D R AT Io [9 5% C I] p H A zA R D R AT Io [9 5% C I] p H A zA R D R AT Io [9 5% C I] p H A zA R D R AT Io [9 5% C I] p H A zA R D R AT Io [9 5% C I] p H A zA R D R AT Io [9 5% C I] p va n d e vi jve r’s d at as et ( n = 15 1) a m st er da m 7 0-ge ne 1. 28 [ 0. 66 –2 .4 8] 0. 47 3. 27 [ 1. 54 –6 .9 7] 0. 00 2 1. 07 [ 0. 47 –2 .4 ] 0. 88 0. 96 [ 0. 49 –1 .9 ] 0. 91 1. 58 [ 0. 77 –3 .2 4] 0. 22 5. 21 [ 1. 62 –1 6. 7] 0. 006 C ox B oo st 6 -g en e 1. 39 [ 0. 72 –2 .6 9] 0. 33 3. 59 [ 1. 71 –7 .5 ] , 0. 001 1. 66 [ 0. 77 –3 .5 7] 0. 20 0. 73 [ 0. 35 –1 .5 4] 0. 41 2. 24 [ 1. 08 –4 .6 4] 0. 03 4. 03 [ 1. 75 –9 .3 ] 0. 001 La s s o 1 8-ge ne 1. 62 [ 0. 83 –3 .1 6] 0.1 6 3. 31 [ 1. 59 –6 .8 7] 0. 00 1 1. 64 [ 0. 76 –3 .5 7] 0. 21 0. 74 [ 0. 35 –1 .5 8] 0. 44 1. 79 [ 0. 87 –3 .6 8] 0.1 2 3. 61 [ 1. 61 –8 .1 ] 0. 00 2 e la st ic n et 2 9-ge ne 1. 51 [ 0. 78 –2 .9 3] 0. 23 3. 19 [ 1. 55 –6 .5 8] 0. 00 2 1. 61 [ 0. 75 –3 .4 6] 0. 23 0. 76 [ 0. 36 –1 .5 9] 0. 46 1. 82 [ 0. 88 –3 .7 5] 0.1 0 3. 65 [ 1. 63 –8 .1 7] 0. 00 2 D es m ed t’s d at as et ( n = 19 7) a m st er da m 7 0-ge ne 1. 43 [ 0. 64 –3 .1 9] 0. 39 1 [ 0. 51 –1 .9 6] 0. 99 1. 92 [ 0. 93 –3 .9 9] 0. 08 1. 73 [ 0. 86 –3 .4 9] 0.1 2 2. 47 [ 0. 86 –7 .0 8] 0. 09 17 .0 3 [ 2. 31 –1 25 .5 8] 0. 00 5 C ox B oo st 6 -g en e 1. 38 [ 0. 62 –3 .0 7] 0. 43 0. 89 [ 0. 45 –1 .7 7] 0.7 5 1. 5 [ 0. 7– 3. 22 ] 0. 30 1. 27 [ 0. 61 –2 .6 4] 0. 52 1. 53 [ 0. 52 –4 .5 ] 0. 44 3. 2 [ 1. 24 –8 .2 1] 0. 02 La s s o 1 8-ge ne 1. 31 [ 0. 59 –2 .9 2] 0. 51 0. 82 [ 0. 41 –1 .6 5] 0. 58 1. 91 [ 0. 89 –4 .0 6] 0. 09 1. 06 [ 0. 47 –2 .3 9] 0. 88 1. 91 [ 0. 63 –5 .7 3] 0. 25 2. 57 [ 1. 09 –6 .0 7] 0. 03 e la st ic n et 2 9-ge ne 1. 26 [ 0. 56 –2 .8 ] 0. 58 0. 9 [ 0. 45 –1 .8 ] 0.7 6 1. 59 [ 0. 74 –3 .4 ] 0. 24 1. 05 [ 0. 5– 2. 22 ] 0. 89 1. 67 [ 0. 57 –4 .9 2] 0. 35 4. 09 [ 1. 6– 10 .4 5] 0. 00 3
Amsterdam 70-gene 100 Metastastis-free survival (%) 80 60 40 20 0 0 Good prognosis 55 55 54 53 52 52 139 142 129 121 113 101 93 92 91 89 83 79 102 104 92 85 82 74 Poor prognosis 12 24 36 Follow-up (months) P < 0.001 60 48 LASSO 18-gene 100 Metastastis-free survival (%) 80 60 40 20 0 0 12 24 36 Follow-up (months) P = 0.003 60 48 CoxBoost 6-gene 100 Metastastis-free survival (%) 80 60 40 20 0 0 Good prognosis 83 83 82 80 77 72 111 114 101 94 88 81 92 91 90 88 85 81 103 105 93 86 80 72 Poor prognosis 12 24 36 Follow-up (months) P < 0.001 60 48
Elastic net 29-gene
100 Metastastis-free survival (%) 80 60 40 20 0 0 12 24 36 Follow-up (months) P < 0.001 60 48
figure 2. MFS curves for the four classifiers in the Desmedt’s external validation set. Kaplan–Meier curves are shown for the Amsterdam 70-gene
signature (top left), the LASSO classifier (top right), the CoxBoost classifier (bottom left), and the Elastic net classifier (bottom right). P-values are estimated using the log-rank test.
genes for the CoxBoost, LASSO, and Elastic net methods, respectively.
The three high-dimensional Cox regression models with automatic selection of the tuning parameter by cross-validation led to the definition of prognostic signatures with similar predictive ability, added significant prognostic information to that provided by the classical parameters. With quite small sets of genes, the CoxBoost, LASSO, and Elastic net methods outperformed the Amsterdam 70-gene signature in terms of accuracy (see Table 3). The Amsterdam 70-gene signature remains the most sensitive predictor. In our opinion, our results highlight the relative poor speci-ficity performance of the Amsterdam 70-gene signature, which tends to overestimate the proportion of patients with recurrence at 5 years. Finding a small subset of genes not only facilitates the transfer to the clinics but also limits the selection of false-positive predictive genes. With only six genes, the classifier derived from the CoxBoost model and the Amsterdam 70-gene signature had similar perfor-mance in terms of sensitivity until 4 years (93% sensitivity). This suggests that further improvements can be achieved by adapting weighted Cox regression methods to high- dimensional microarray data.20 Selecting genes predictive of
late recurrences could likely improve the overall performance
of genomic classifiers, and thus help the clinicians to bet-ter tailor adjuvant chemotherapy to their patients. Our study was designed to illustrate the attractiveness of high-dimensional Cox regression models. We used an auto-matic selection procedure to control the number of predictive genes to be included in each model. Even if such a procedure follows some good statistical principles, we do not fully rec-ommend its use. More flexibility in the choice of the default parameterization may be desirable in practice because it may strongly affect the predictive performance of each method. This is also true for the determination of the cutoff value to predict the poor- and good-prognosis classes. Here, the choice to use the value resulting in a misclassification not superior to 10% of the actual poor-prognosis patients in the training set to predict the class membership was supported by the aim to select the patients who will most benefit from a chemotherapy prescription. In other situations, an overall accuracy or an AUC is a better alternative measure to assess the overall performance or predict the class membership. In a perspective to determine more accurate signatures, ensemble methods aggregating models trained on different samples may capture nonlinear relationship21 and ensure better
trans-ferability.22 Despite all these limitations, our work supports
Prediction of early breast cancer metastasis Table 5. List of top 10 ontological terms of GO overrepresented (GSEA) for the four classifiers in the external validation sets.
CoxBoost 6-gENE LASSo 18-gENE ELASTIC NET 29-gENE AMSTERDAM 70-gENE
van de vijver’s set
Cell_Cycle_Phase Cell_Cycle_go_0007049 Cell_Cycle_Phase Mitotic_Cell_Cycle
Mitotic_Cell_Cycle Cell_Cycle_Process Cell_Cycle_Process Cell_Cycle_Process
Chromosomal_Part Chromosome Chromosome Cell_Cycle_Phase
Chromosome Chromatin Mitotic_Cell_Cycle m_Phase_of_mitotic_Cell_Cycle
Cell_Cycle_Process Cell_Cycle_Phase Cell_Cycle_go_0007049 magnesium_Ion_Binding
M_Phase Chromosomal_Part Interphase Cell_Cycle_go_0007049
Cell_Cycle_go_0007049 Mitotic_Cell_Cycle Chromosomal_Part mitosis
Chromatin M_Phase M_Phase M_Phase
magnesium_Ion_Binding m_Phase_of_mitotic_Cell_Cycle Interphase_of_mitotic_Cell_Cycle Chromosome
Dna_replication mitosis m_Phase_of_mitotic_Cell_Cycle Chromatin
Desmedt’s set
Cell_Cycle_go_0007049 Chromosome Chromosome response_to_Dna_Damage_
stimulus
Mitotic_Cell_Cycle Chromosomal_Part Chromosomal_Part microtubule_Cytoskeleton
Cell_Cycle_Process Mitotic_Cell_Cycle Mitotic_Cell_Cycle Chromosome
regulation_of_mitosis Cell_Cycle_go_0007049 Mitosis Dna_repair
Chromosomal_Part Cell_Cycle_Process Cell_Cycle_Process Chromosomal_Part
Cell_Cycle_Phase M_Phase_of_Mitotic_Cell_Cycle M_Phase_of_Mitotic_Cell_Cycle Cell_Division
regulation_of_Cell_Cycle Mitosis Cell_Cycle_Phase Mitosis
Chromosome Cell_Cycle_Phase Cell_Cycle_go_0007049 M_Phase_of_Mitotic_Cell_Cycle
Mitosis Chromosome_segregation Cell_Cycle_Checkpoint_
Go_0000075 Cytokinesis
M_Phase_of_Mitotic_
Cell_Cycle Cell_Cycle_Checkpoint_ Go_0000075 Chromosome_segregation Mitotic_Cell_Cycle
Notes: the Go ontological terms are ordered from top to bottom by their increasing Gsea normalized enrichment score (nes). those written in bold are common to the four classifiers.
predicting the status of breast cancer metastasis from breast DNA microarray data.
Author contributions
Conceived and designed the methods: CZ, FB, PF, DB, BC, TF, JMB. Analyzed the data: CZ, FB, PF, DB, BC, TF, JMB. Provided preprocessed genomics data and cluster support for calculation: PF, FB, BC. Wrote the first draft of the manuscript: CZ, FB, PF, DB, BC, TF, JMB. Contributed to the writing of the manuscript: CZ, FB, PF, JMB. Agreed with manuscript results and conclu-sions: CZ, FB, PF, DB, BC, TF, JMB. Jointly developed the struc-ture and arguments for the paper: CZ, PF, FB, JMB. Made critical revisions and approved the final version: CZ, FB, PF, DB, BC, TF, JMB. All authors reviewed and approved the final manuscript.
supplementary Files
supplementary table 1. Description of the three breast cancer datasets.
supplementary table 2. Gene lists of the CoxBoost 6-gene, LASSO 18-gene and Elastic net 29-gene classifiers.
supplementary table 3. Concordant classification rates between the four classifiers in the external validation sets.
supplementary table 4. Gene overlap between the gene lists of the four classifiers.
supplementary Figure 1. Venn diagrams showing the overlap between the GO ontological terms overrepresented (GSEA) in the four classifiers in the external validation sets.
The number of significant ontologies is indicated between brackets.
reFerences
1. van’t Veer LJ, Dai H, van de Vijver MJ, et al. Gene expression profiling predicts clinical outcome of breast cancer. Nature. 2002;415(6871):530–6.
2. Van de Vijver MJ, He YD, van’t Veer LJ, et al. A gene-expression signature as a predictor of survival in breast cancer. N Engl J Med. 2002;347(25):1999–2009. 3. Wang Y, Klijn JG, Zhang Y, et al. Gene-expression profiles to predict
dis-tant metastasis of lymph-node-negative primary breast cancer. Lancet. 2005; 365(9460):671–9.
4. Bertucci F, Finetti P, Cervera N, Maraninchi D, Viens P, Birnbaum D. Gene expression profiling and clinical outcome in breast cancer. OMICS. 2006;10(4):429–43.
5. Tibshirani R. The lasso method for variable selection in the Cox model. Stat
Med. 1997;16(4):385–95.
6. Tutz G, Binder H. Generalized additive modeling with implicit variable selec-tion by likelihood-based boosting. Biometrics. 2006;62(4):961–71.
7. Zou H, Hastie T. Regularization and variable selection via the elastic net.
J R Stat Soc Ser B. 2005;67:301–20.
8. Bøvelstad HM, Nygård S, Størvold HL, et al. Predicting survival from micro-array data – a comparative study. Bioinformatics. 2007;23(16):2080–7.
9. De Bin R, Sauerbrei W, Boulesteix AL. Investigating the prediction ability of survival models based on both clinical and omics data: two case studies. Stat
Med. 2014;33(30):5310–29.
10. Kaneko S, Hirakawa A, Hamada C. Gene selection using a high-dimensional regression model with microarrays in cancer prognostic studies. Cancer Inform. 2012;11:29–39.
11. van Wieringen W, Kun D, Hampel R, Boulesteix A. Survival prediction using gene expression data: a review and comparison. Comput Stat Data Anal. 2009;53:1590–603.
12. Waldmann P, Meszaros G, Gredler B, Fuerst C, Solkner J. Evaluation of the lasso and the elastic net in genome-wide association studies. Front Genet. 2013;4:270.
13. Desmedt C, Piette F, Loi S, et al; TRANSBIG Consortium. Strong time dependence of the 76-gene prognostic signature for node-negative breast can-cer patients in the TRANSBIG multicenter independent validation series. Clin
Cancer Res. 2007;13(11):3207–14.
14. Irizarry RA, Hobbs B, Collin F, et al. Exploration, normalization, and sum-maries of high density oligonucleotide array probe level data. Biostatistics. 2003;4(2):249–64.
15. Lehmann BD, Bauer JA, Chen X, et al. Identification of human triple-negative breast cancer subtypes and preclinical models for selection of targeted therapies.
J Clin Invest. 2011;121(7):2750–67.
16. Binder H. Cox models by likelihood based boosting for a single survival endpoint or competing risks. R Package Version 1.4. 2013. Available at: http://CRAN.R-project.org/package=CoxBoost. [Ref Type: Online Source].
17. Friedman J, Hastie T, Tibshirani R. Regularization paths for generalized linear models via coordinate descent. J Stat Softw. 2010;33(1):1–22.
18. Friedman J, Hastie T, Simon N, Tibshirani R. Lasso and elastic-net regularized generalized linear models. R Package Version 1.9–8. 2014. Available at: http:// CRAN.R-project.org/package=glmnet. [Ref Type: Online Source].
19. Subramanian A, Tamayo P, Mootha VK, et al. Gene set enrichment analysis: a knowledge-based approach for interpreting genome-wide expression profiles.
Proc Natl Acad Sci U S A. 2005;102(43):15545–50.
20. Schemper M. Cox analysis of survival data with non-proportional hazard func-tions. Statistician. 1992;41:455–65.
21. Ishwaran H, Kogalur U, Blackstone E, Lauer M. Random survival forests. Ann
Appl Stat. 2008;2:841–60.
22. Michiels S, Koscielny S, Hill C. Prediction of cancer outcome with microarrays: a multiple random validation strategy. Lancet. 2005;365(9458):488–92.