HAL Id: hal-01477817
https://hal.archives-ouvertes.fr/hal-01477817
Submitted on 19 Feb 2020HAL is a multi-disciplinary open access archive for the deposit and dissemination of sci-entific research documents, whether they are pub-lished or not. The documents may come from
L’archive ouverte pluridisciplinaire HAL, est destinée au dépôt et à la diffusion de documents scientifiques de niveau recherche, publiés ou non, émanant des établissements d’enseignement et de
Cerebrovascular pathology during the progression of
experimental Alzheimer’s disease
Patrizia Giannoni, Margarita Arango-Lievano, Ines das Neves, Marie-Claude
Rousset, Kévin Baranger, Santiago Rivera, Freddy Jeanneteau, Sylvie
Claeysen, Nicola Marchi
To cite this version:
Patrizia Giannoni, Margarita Arango-Lievano, Ines das Neves, Marie-Claude Rousset, Kévin Baranger, et al.. Cerebrovascular pathology during the progression of experimental Alzheimer’s disease. Neuro-biology of Disease, Elsevier, 2016, 88, pp.107-117. �10.1016/j.nbd.2016.01.001�. �hal-01477817�
Cerebrovascular pathology during the progression
of experimental Alzheimer’s disease
Patrizia Giannoni1, 2, 3, Margarita Arango-Lievano1, 2, 3, Ines Das Neves1, 2, 3, Marie-Claude Rousset1, 2, 3, Kevin Barranger4, Santiago Rivera4, Freddy Jeanneteau1, 2, 3, Sylvie Claeysen1,
2, 3 and Nicola Marchi1, 2, 3
1CNRS, UMR-5203, Institut de Génomique Fonctionnelle, F-34000 Montpellier, France 2Inserm, U1191, F-34000 Montpellier, France
3Université de Montpellier, UMR-5203, F-34000 Montpellier, France 4NICN, Aix-Marseille Université, CNRS, UMR7259, Marseille, France
Running title: CAA and microvascular inflammation in 5xFAD mice
Keywords: CAA, microvascular inflammation, Alzheimer, 5xFAD Number of pages: 29
Number of words: 4.251 Number of Figures: 7 Tables: 1
Supplemental Movies: 3
Corresponding Authors: Dr. Nicola Marchi, nicola.marchi@igf.cnrs.fr. Dr. Sylvie Claeysen; sylvie.claeysen@igf.cnrs.fr. Laboratory of Cerebrovascular Mechanisms of Brain Disorders, Institut de Génomique Fonctionnelle, CNRS UMR5203, INSERM U661, Université Montpellier 1, 2, Montpellier, 141 rue de la Cardonille, 34094 Montpellier, Cedex 5, France.
Acknowledgements : Supported by: Fédération pour la Recherche sur le Cerveau (to NM); French Research National Agency ANR (ANR-12-BSV4-008-01 ADAMGUARD to SC). Supported by France Alzheimer and LECMA grants (to SC and SR). KB was supported by A*Midex (Aix-Marseille Université Initiatives of Excellence). IPAM and confocal MRI platform (Montpellier, France)
Highlights
5xFAD mice show CAA on leptomeningeal and penetrating vessels
Parenchymal microvascular damage paralleled plaque formation in fronto-parietal cortices, later affecting the hippocampus
Inflammatory IBA1/GFAP reactivity topographically overlapped with microdomains of vascular damage and parenchymal plaques.
Microvascular inflammatory changes in 5xFAD mice were multicellular, accompanied by PDGFRβ+
Abstract
Clinical and experimental evidence point to a possible role of cerebrovascular dysfunction in Alzheimer's Disease (AD). The 5xFAD mouse model of AD expresses human amyloid precursor protein and presenilin genes with mutations found in AD patients. It remains unknown whether amyloid deposition driven by these mutations is associated with cerebrovascular changes.
5xFAD and wild type mice (2 to 12 months old; M2 to M12) were used.
Thinned skull in vivo 2-photon microscopy was used to determine Aβ accumulation on leptomeningeal or superficial cortical vessels over time. Parenchymal microvascular damage was assessed using FITC-microangiography. Collagen-IV and CD31 were used to stain basal lamina and endothelial cells. Methoxy-XO4, Thioflavin-S or 6E10 were used to visualize Aβ accumulation in living mice or in fixed brain tissues. Positioning of reactive IBA1 microglia and GFAP astrocytes at the vasculature was rendered using confocal microscopy. Platelet-derived growth factor receptor beta (PDGFRβ) staining was used to visualize perivascular pericytes.
In vivo 2-photon microscopy revealed Methoxy-XO4+ amyloid perivascular deposits on leptomeningeal and penetrating cortical vessels in 5xFAD mice, typical of cerebral amyloid angiopathy (CAA). Amyloid deposits were visible in vivo at M3 and aggravated over time. Progressive microvascular damage was concomitant to parenchymal Aβ plaque accumulation in 5xFAD mice. Microvascular inflammation in 5xFAD mice presented with sporadic FITC-albumin leakages at M4 becoming more prevalent at M9 and M12. 3D colocalization showed inflammatory IBA1+ microglia
pericytes was significantly decreased at M4 in the fronto-parietal cortices, with a trend decrease observed in the other structures. At M9-M12, PDGFRβ+
pericytes displayed hypertrophic perivascular ramifications contiguous to reactive microglia.
Cerebral amyloid angiopathy and microvascular inflammation occur in 5xFAD mice concomitantly to parenchymal plaque deposition. The prospect of cerebrovascular pharmacology in AD is discussed.
Introduction
Alzheimer’s disease (AD) is the most common form of dementia. Beta-amyloid (Aβ) deposition in plaques is a hallmark of AD, both in genetic and sporadic forms. The role of cerebrovascular dysfunction in AD was clinically proposed (Hofman et al., 1997, Luchsinger et al., 2005, Hayden et al., 2006). The cerebrovasculature, including large leptomeningeal-penetrating and parenchymal microvessels, plays a key role in maintaining the physiological neuro-vascular coupling (Abbott et al., 2006, Abbott et al., 2010). Clinical data indicate cerebral amyloid angiopathy (CAA) in AD patients, characterized by pathological Aβ deposits on leptomeningeal and large penetrating cortical vessels (Herzig et al., 2004). In addition, the progression of microvascular damage was proposed as a marker of clinical AD (Breteler, 2000b, a, Marchesi, 2011). AD and CAA are intertwined as parenchymal amyloid is cleared via bulk flow drainage along the basement membranes of vessels. CAA in AD indicates reduced amyloid clearance from the brain parenchyma (Weller et al., 2008, Weller et al., 2009, Carare et al., 2014). Mechanisms of CAA development also include altered amyloid transport across the endothelium and failure of amyloid degradation (Attems, 2005, Carare et al., 2008, Miners et al., 2008, Weller et al., 2008, Deane et al., 2009, Hawkes and McLaurin, 2009, Zlokovic et al., 2010, Carare et al., 2013, Keable et al., 2015).
The topography and timing of cerebrovascular changes in human AD remain difficult to assess (Kester et al., 2014). The latter question can be addressed using AD models mimicking genetic Aβ deposition (Mineur et al., 2005, Howlett, 2011, Bilkei-Gorzo, 2014). Data on the status of the cerebrovasculature in AD exist, however longitudinal studies are uncommon (Janota et al., 2015b). Available
2014) or an increase in cerebrovascular permeability in aging Tg2576 AD mice (Ujiie et al., 2003).
Cerebrovascular integrity is the result of a multicellular interplay. For instance, pericytes partake in cerebrovascular assembly and functions (Armulik et al., 2010, Bell et al., 2010, Armulik et al., 2011, Winkler et al., 2011, Park et al., 2013). Proof-of
principle data showed that genetic invalidation of pericyte signaling in mice favors
neurovascular pathology (Bell et al., 2010, Winkler et al., 2010). In addition, while parenchymal inflammation represents a phenotype of AD progression, data on microvascular signs of inflammation in experimental AD are sporadic. Interestingly, platelet derived growth factor receptor beta (PDGFRβ+
) cells were proposed to participate in tissue scarring and inflammation together with astroglial or microglial cells (Fernandez-Klett et al., 2013).
We investigated whether Aβ deposition driven by familial forms of AD is associated with cerebrovascular dysfunctions. We assessed the development of cerebral amyloid angiopathy (CAA) and signs of microvascular inflammation occurring in 5xFAD mice (Oakley et al., 2006). In vivo longitudinal 2-photon microscopy and ex-vivo fluorescent microangiography were used to assess all vascular structures. Aβ accumulation was visualized using 6E10 or Thioflavin-S ex
vivo and by methoxy-XO4 in vivo. In our study microvascular inflammation was
defined as albumin leakage associated with pericyte and IBA1/GFAP+ cells rearrangement overtime.
Material and Methods
Animals
Animal experiments were carried out in accordance with the Directive by the Council of the European Communities of November 24, 1986 (86/609/EEC) and approved protocols (00846.01, 00651.01). All efforts were made to minimize animal suffering and to reduce the number of mice used. 5xFAD mice overexpress human APP (695) harboring the Swedish (K670N, M671L), Florida (I716V) and London (V717I) familial AD (FAD) mutations and human Presenilin1 (PS1) harboring the two FAD mutations M146L and L286V (Oakley et al., 2006). Expression of both transgenes is regulated by neuronal-specific elements of the mouse Thy1 promoter. The 5XFAD strain (C57/Bl6) genetic background was maintained by crossing hemizygous transgenic mice with C57/bl6 breeders (Janvier, Le Genest-Saint-Isle, France). 5xFAD heterozygous transgenic mice were used for the experiments and WT littermates as controls. All animals were genotyped by PCR using tail genomic DNA (Oakley et al., 2006). Transgenic and WT mice were bred in our animal facility, had access to food and water ad libitum and were housed under a 12h light-dark cycle at 22–24◦C. Female 5xFAD mice were used in this study. For each experiment, the age of mice is indicated in months. A total of n = 36 WT and n = 36 5xFAD mice were used. In particular, n = 4 WT and n = 5 5xFAD mice were assigned to the two-photon study. The remaining mice were sacrificed at M2, M4, M9 or M12 (M: months) and were intracardially perfused with PBS or injected with FITC-albumin. Specifically: n = 11 WT and n = 8 5xFAD at 2 months, n = 8 WT and n = 8 5xFAD at 4 months, n = 8 WT and n = 8 5xFAD at 9 months and n = 6 WT and n = 7 5xFAD at 12 months.
Thinned-skull in vivo 2-photon imaging and image processing
5xFAD mice (n = 5) were injected IP with 10 mg/Kg methoxy-XO4 (Tocris Bioscience, Lille, Bioscience) 48 hours prior to imaging as described by (Klunk et al., 2002). Longitudinal imaging was performed at 3, 4 and 5 or 8 months of age under ketamine / xylazine anesthesia through a thinned skull window on head restrained mice (Yang et al., 2010). Animals were injected i.v. with 50 µl of 25 mg/ml 70KDa Fluorescein isothiocyanate-dextran (Sigma-Aldrich) for vessel visualization. A Zeiss LSM7 2-photon microscope coupled to a Ti:sapphire laser (Spectra physics) was used; methoxy-XO4 was imaged using 750 nm excitation (max intensity 10 mW), blue and green photodetectors respectively, and a 20X objective (NA 1.0, W Apocromat, Zeiss) 20X images and relative four 40X volumes (212 x 212 x 180-220 µm) were taken at each image session for each mouse using a 1 μm step. A detailed map of the pial surface vasculature was taken for subsequent identification of the imaging region. Imaris 8.0 was used for 3D vessel reconstructions and to quantify CAA at the leptomeningeal and superficial cortical vessels and parenchymal Aβ accumulation overtime. Methoxy-XO4+ objects were rendered in the respective 3D domains allowing detailing of position (see Supplemental Movie). Methoxy-XO4 was quantified in each 40X quadrant. FITC vascular maps were used to identify perivascular (CAA) or parenchymal amyloid (plaques), based on the distance from the vessels and morphology (see Figure 1). We defined two populations of amyloid deposits that were manually selected in the 3D domain (Imaris 8.0). Volumes were then automatically calculated (µm3).
Fluorescent microangiography and FITC+ vessel quantification
Animals (5xFAD and WT) were injected intracardially with 250-300 µL FITC-Albumin solutions (Sigma-Aldrich; 25 mg/ml in PBS) and brains were removed after 1-2 minutes. Brains were fixed (immersion) in 4% formalin for at least 48 hours before processing at the vibratome. Slices were cut at 30µm and stored at -20°C in cryo-protective media. Microvessel quantification was carried out using coronal slices from FITC albumin perfused brains. A fluorescence microscope (Zeiss AxioImager Z1) was used to acquire images (10X). Structures corresponding to frontal cortex, anterior and lateral parietal cortex, hippocampus and entorhinal cortex were chosen for each sample (coordinates from bregma: frontal cortex = 2,04 mm, parietal cortexes and hippocampus = -3.24 mm, entorhinal cortex = -5,04 mm). For each animal, n = 3 slices/region were mounted and one image was acquired per side from each region (2 months: n = 5 WT and n = 4 5xFAD; 4 months: n = 4 WT and n = 6 5xFAD; 9 months: n = 4 WT and 4 5xFAD; 12 months: n = 3 WT and n = 4 5xFAD; 6 images / animal). FIJI was used for image processing. Images were converted into 8-bit grayscale mode and colors were inverted. Image scale was set to 1.58 pixels/µm. Brightness and contrast levels were adjusted to decrease background noise. Vessels were further enhanced by applying a median filter with the radius set to 2 or 3 pixels, depending on the clarity of the image. The FIJI skeleton plugin was applied to each image for vessel recognition. Data sets including vessel length and branch identity were obtained through the Analyze Skeleton function of the same plugin. Data were then processed using Microsoft Excel or Origin Microcal 8.0. Data for lines shorter than 10 µm were excluded Total FITC+ vessel length and total number of vessels for each image was then automatically calculated.
Immunohistochemistry and quantifications
Amyloid plaque staining. Formalin-fixed slices were washed in PBS and
mounted on gelatin-coated slides. After drying, slides were immersed for 10 minutes in a solution of thioflavin-S (1% in PBS) and sequentially dehydrated in ethanol 70°, 80°, 95° and 100° (two minutes each). Slices were immersed for five minutes in two solutions of xylene, and a non-aqueous mounting medium (EUKITT) was used before adding coverslips. Image acquisition (10X) was performed using an AxioImager Z1 microscope (Carl Zeiss). Data are represented as number of particles per mm2 and averaged from two different measurements (ImageJ).
Inflammation. IBA1 (ionized calcium-binding adapter molecule 1) and GFAP
(glial fibrillary acidic protein) staining was performed on PBS-perfused brains. Slices (free-floating) were washed in PBS and a blocking solution was added for 1 h (PBS; 3% BSA; 0,1% Triton X-100). Sections were incubated with anti-GFAP antibody (polyclonal rabbit anti-glial fibrillary acidic protein, Z0334, 1:1000, Dako, Les Ullis, France) or anti-IBA1 antibody (polyclonal rabbit anti-ionized calcium binding adapter molecule 1, 019-19741, 1:2000, Wako Chemicals GmbH, Neuss, Germany) overnight at 4°C. A secondary antibody (Alexafluor 594 goat anti-rabbit, A11012, 1:1000, Life Technologies, Saint Aubin, France) was added for 1 h. Hoechst staining was used for the detection of cell nuclei (1:1000 from a 1 mg/mL stock) with 15 minutes of incubation. All slices were finally mounted on poly-lysine slides and cover slipped. Images (20X) were acquired maintaining constant exposure for all samples across single experiments. We used at least 2 sections for each mouse (2 months: n = 6 WT and n = 4 5xFAD; 9 months: 4 WT and n = 4 5xFAD; 12 months: n = 3 WT and n = 3 5xFAD).
Vessels. Basal lamina was stained using Collagen IV (polyclonal rabbit
anti-collagen IV antibody, ab6586, 1:100, Abcam,). Staining was performed as previously described (Cifuentes et al., 2015), using an antigen retrieval technique based on citrate buffer (pH = 6). CD31 (ab56299, 1:100 proteinaseK antigen retrieval as suggested by the vendor, Abcam) was used to stain endothelial cells.
Pericytes. PDGFR staining was performed on PBS or FITC-albumin perfused mice, as described above, with the exception of the blocking solution (0.25% Triton X100 and 20% goat serum in PBS). The primary antibody (polyclonal rabbit anti-PDGFR, ab32570, 1:100, Abcam,) was incubated overnight. A primary mouse monoclonal anti-PDGFRβ (ab69506, 1:100, Abcam,) was used for colocalization studies with IBA1 and GFAP. Four images were acquired per animal from 5 regions of interest. Images were processed using FIJI (ImageJ). FITC-albumin images were stacked with their corresponding DAPI and PDGFRβ images (16-bit color; scale: 3.16 pixels/µm). Vessels were traced with a freehand line tool and length data were collected using the ROI Manager tool. The number of perivascular PDGFRβ-positive cells on vessels was then manually counted and divided by the corresponding length of each vessel (data expressed as number of cells/µm). In the perivascular PDGFRβ-positive cell quantification, each point corresponds to a single vessel (Figure 7B1). Vessels without perivascular PDGFRβ-positive cells were not included in the box chart. However, a bar graph was plotted to convey changes in the number of vessels without perivascular PDGFRβ-positive cells between 2 and 12 month-old mice (Figure 7B). Confocal microscopy (LSM780) was used for acquisition. Double- or triple-labeled images from each region of interest were obtained: green 480–534 nm, red 575–620 nm, blue 415–470 nm. The objectives and the pinhole setting were
unchanged during the acquisition of all images (40X). Post-acquisition processing and 3D reconstruction were performed using ZEN 2 (Blue Edition, Zeiss).
Statistical analysis
We used Origin 8.0 (Origin Lab, Northampton, MA, USA) or GraphPad Prism 6.0a (GraphPad Software, La Jolla, CA, USA) for statistical analyses. One-way ANOVA (Bonferroni correction) was used on paired populations (e.g, WT vs. TG or 2 months vs. 4, 9, 12 months). Data that were not normally distributed (Shapiro-Wilk normality test) were analyzed using non-parametric Kruskal-Wallis test. P < 0.05 was considered statistically significant. Data are expressed using a Statistical Box Chart (mean ± SD or ± SE, 5% and 95% percentile; single data distribution).
Results
Progressive CAA in 5xFAD mice
5xFAD mice were imaged using thinned skull 2-photon microscopy amenable for the visualization of constant regions of interest in living animals (Yang et al., 2010). Each mouse underwent 3 imaging sessions (methoxy-XO4 and FITC-dextrans) during the progression of the pathology. Injection of methoxy-XO4 in WT littermate confirmed the absence of endogenous amyloid depositions (data not
shown). In 5xFAD mice we found perivascular Aβ accumulation on leptomeningeal
and penetrating vessels, typical of CAA (Figure 1A and A1). Detailed 2-photon images show abundant perivascular methoxy-XO4 staining concomitant to parenchymal Aβ plaques (Figure 1B, B1 and C). Note the anatomical proximity of the intraluminal FITC signal and methoxy-XO4+ accumulation. Methoxy-XO4+ amyloid impinging the intraluminal FITC was also detected (Figure 1C1-C2) Supplemental Movie 1 further details the position of methoxy-XO4+ amyloid in relation to intravascular FITC-Dextrans.
The percentage of large caliber vessels displaying CAA is quantified in Figure 2. The number of plaques was also determined (Figure 2B). Note that one mouse did not develop CAA within the cortical volume analyzed (Figure 2A) while different extents of CAA volumes were measured across mice (Figure 2C-D). Timing of CAA accumulation was also variable between mice and could be detected as early as 3 months of age (Figure 2C). CAA was greater as compared to parenchyma plaques evaluated in the same 3D regions of interest (Figure 2C-D). A linear correlation
Progressive microvascular damage in 5xFAD mice
Parenchymal microvessels were visualized using FITC-albumin angiography (FITC+ vessels; Table 1). Aging exerted an effect as WT mice displayed either significant or a trend decrease in FITC+ microvessel length overtime (asterisks in Table 1). Changes were more pronounced in 5xFAD mice as compared to wild type (# sign in Table 1). Differences in FITC+ microvessel length reflected structural modifications possibly associated with leakages. Figure 3A shows examples of age dependent FITC+ microvascular changes concomitant to Aβ deposition in 5xFAD mice. Parietal cortices in 5xFAD mice displayed a reduction in microvascular length as early as M2 and M4 (Table 1), paralleling subcortical intraneuronal Aβ deposits at M2 (Jawhar et al., 2012) and parenchymal Aβ at M4 (Oakley et al., 2006). Reduction in FITC+ microvessels was aggravated at M9 and M12 (Table 1, Figure 3A). Microcapillary leakages were significant at M9 in 5xFAD mice as compared to WT (Figure 3B-B2). Microvascular structures were further analyzed co-localizing FITC-albumin and collagen IV (Figure 3C-C1). Occasional absence of FITC intravascular signal in collagen-IV positive vessels was detected in the cortex (Figure 3C2). The latter result is in accordance with clinical data showing inconsistent perfusion or blood flow deficit in AD patients (Verclytte et al., 2015). Figure 4A-A2 shows examples of methoxy-XO4 perivascular accumulation on collagen IV+ and CD31+ pial and penetrating vessels. Consistent with clinical data (Weller et al., 2008, Weller et al., 2009), we found that a limited number of microvessels displayed CAA (examples in Figure 4B-B1), while microvascular activated/amoeboid IBA1+ microglia was common (Figure 6). Conversely, CAA was obvious on larger caliber vessels (Figure 1). Taken together, our results support progressive vascular pathology in 5xFAD
Topography and timing of vascular changes, inflammation and Aβ accumulation
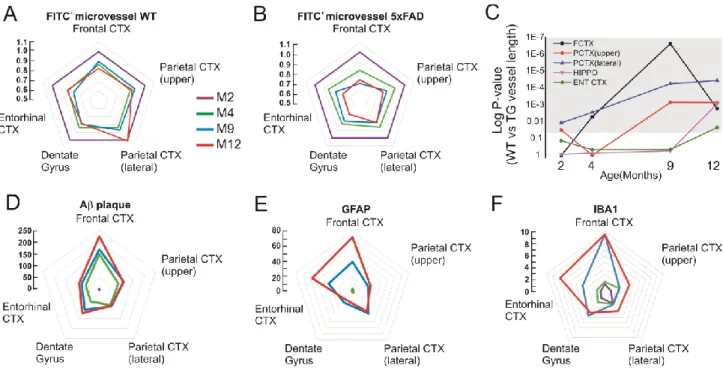
Radar charts (Figure 5) and raw data in Table 1 summarize regional and time dependent vascular-inflammatory responses detected by FITC-albumin leakage, IBA1 and GFAP reactivity. Radar charts also emphasize the patterns of FITC+ microvascular damage relative to aging in WT (Figure 5A) or to disease progression in 5xFAD mice (Figure 5B). In our model, microvascular changes occurred earlier in the fronto-parietal cortices of 5xFAD as compared to the dentate gyrus or the entorhinal cortex (Figure 5C). This is in accordance with previous reports where Aβ plaque accumulation in 5xFAD mice was demonstrated to be favored in the cortices, while appearing in the dentate gyrus only at later stages (Oakley et al., 2006). Progressive inflammation corresponds to microvascular damage and parenchymal Aβ accumulation overtime (Figure 5D-F).
Microvascular inflammation
A series of immunofluorescent 3D reconstructions were performed delineating microvascular inflammatory changes during AD progression. In our study the term microvascular inflammation refers to microdomains of albumin leakages and redistribution of parenchymal inflammatory cells. Table 1 provides regional and age dependent quantifications of IBA1 and GFAP immunoreactivity, expressed as fold increase of 5xFAD/WT. Results show a typical progression of parenchymal inflammatory signs, as reported earlier (Giannoni et al., 2013). 5xFAD mice displayed amoeboid IBA1+ cells proximal to FITC-albumin microvascular leakages (dotted lines in Figure 6A, B-B2) and accumulation of ramified microglia at the perivascular wall (Figure 6C-C2). Microvascular damage was associated with IBA1 reactivity and
accumulation at the microvascular wall was limited (see examples in Figure 4B). We also found PDGFRβ+
-IBA1+ cellular aggregates corresponding to or proximal to the microvasculature (Figure 6D-D2). Z-stacks show lack of PDGFRβ and GFAP colocalization (Figure 6E). Despite of the contiguous positioning of PDGFRβ and IBA1 immunoreactivity on microvessels, our results do not suggest localization of the two markers in the same cell (Figure 6F).
We quantified perivascular pericytes modifications occurring overtime in 5xFAD mice. M2 5xFAD mice displayed typical PDGFRβ pericyte morphology, including organized ramifications lining the perivascular wall (Figure 7A and Supplemental Movie 2; (Bell et al., 2010)). The total number of microvessels anatomically associated with PDGFRβ pericytes was reduced at M4 (Figure 7B). PDGFRβ pericytes coverage was also decreased (Figure 7B1). Microvessel counting is provided for each region (Figure 7B), while Table 1 provides raw data. 3D confocal reconstruction illustrates an example of pericyte loss (Figure 7A). Interestingly, M12 5xFAD mice displayed an increased number of PDGFRβ+ soma. PDGFRβ+
pericytes were characterized by hypertrophic or disorganized ramifications (Figure 7A and Supplemental Movie 3). These data suggest pericyte degradation and rearrangement during microvascular inflammation and Aβ accumulation.
Discussion
Our results indicate that mutations in 5xFAD mice drive CAA and microvascular inflammatory damage. In particular we found: i) progressive CAA on leptomeningeal and penetrating vessels; ii) sporadic perivascular amyloid accumulations on parenchymal microvessels; iii) parenchymal microvascular damage initially paralleling plaque accumulation in fronto-parietal cortices, later affecting the hippocampus; iii) inflammatory IBA1/GFAP reactivity topographically associated to microdomains of vascular damage and plaques in 5xFAD mice. Microvascular inflammatory changes in 5xFAD mice were multicellular also accompanied by PDGFRβ+
pericytes loss and rearrangement over time.
Cerebrovascular pathophysiology in AD
Our study supports a pathological contribution of all segments of the cerebrovasculature in AD progression (Herzig et al., 2004, Winkler et al., 2011, Janota et al., 2015a, Janota et al., 2015b, Montagne et al., 2015a, Montagne et al., 2015b). When Aβ deposition is genetically favored, as in 5xFAD mice, significant vascular changes occurred at the parenchymal microvasculature and leptomeningeal or penetrating vessels. In vivo 2-photon microscopy showed progressive CAA in 5xFAD mice, characterized by perivascular amyloid deposition, possibly corresponding to the tunica media/adventitia, on large caliber vessels. The latter was previously unreported (Xu et al., 2014) potentially due to the limitations associated with conventional immunohistochemistry as compared to longitudinal 2-photon
al., 2015) (Thal et al., 2008). It remains to be investigated whether, in our model, CAA and parenchymal plaque accumulation are pathologically connected (Dorr et al., 2012, Lai et al., 2015). CAA may reflect age-related amyloid accumulation in the parenchyma, leading to modifications of the neuronal homeostasis and functions (Weller et al., 2008, Weller et al., 2009). Perivascular CAA on larger vessels suggests a failed amyloid elimination along the perivascular pathways and into the lymphatic drainage (Lai et al., 2015). Accumulating evidence support the pathophysiological role of impaired amyloid clearance in AD (Iliff et al., 2012, Iliff et al., 2015)
We also found incipient microvascular changes in the fronto-parietal structures (Table 1) where Aβ deposits were demonstrated to initiate (Oakley et al., 2006). However, we did not find consistent amyloid accumulation (CAA) on parenchymal microvessels. Our results are consistent with previous reports showing decreased tight-junction proteins at the microvasculature in eight month-old 5xFAD mice (Kook et al., 2012). Time-dependent microvascular damage was also recently reported in APP/PS1 mice (Janota et al., 2015b). Our data also revealed the effect of aging on microvascular integrity. The comparison between WT and 5xFAD indicated that Aβ accumulation leads to aggravated microvascular damage (Table 1 and Figure 4A-B). Additional evidence is in support of cerebrovascular pathology in AD, including the localized production of metalloproteinase and vascular transcytosis affecting amyloid clearance (Kook et al., 2012, Kook et al., 2013). Additionally, experimental models of AD displayed regional hypoperfusion, possibly due to decreased capillary density around plaques or to a lower cerebral metabolic demand (Klohs et al., 2014).
cortex, although the phenotype was milder (Elder et al., 2010). Conversely, lack of widespread vascular damage was reported in human tau, ApoE and SOD1 mouse lines (Bien-Ly et al., 2015). Dissimilar techniques were used to evaluate vascular integrity across reports. One limitation of our study is the lack of identification of arterial vs venous segments. Recent evidence indicated venular degeneration involved in experimental AD (Lai et al., 2015).
Microvascular inflammatory changes in AD
The progression of parenchymal inflammation is a hallmark of human and experimental AD (Heppner et al., 2015). We found microvascular pockets of inflammation, defined by IBA1/GFAP reactivity, FITC-albumin leaks and PDGFRβ+
cell rearrangement (Figures and 6). Microvascular changes were adjacent to parenchymal plaques. As plaque accumulation in 5xFAD is genetically driven, microvascular inflammation is likely to be the result of uncontrolled parenchymal amyloid accumulation leading to microvascular damage, installing a vicious pro-inflammatory cycle. Aggregates of IBA1 and PDGFRβ+
cells were also detected in the proximity of microvessels (Figure 5B) suggesting a multicellular inflammatory response. It remains to be investigated whether an anti-inflammatory intervention could be beneficial. Interestingly, infiltrating neutrophils have been proposed to participate in the pathophysiology of experimental AD. In particular, blood neutrophils infiltrate the brain localizing around meningeal and cortical vessels in 4 months old 5xFAD mice (Zenaro et al., 2015). Prophylactic depletion of neutrophils was associated with memory improvement in 5xFAD mice (Zenaro et al., 2015), further stressing the therapeutic potential of cell-specific anti-inflammatory cerebrovascular
inconsistent therapeutic effects of non-steroidal anti-inflammatory drugs (Trepanier and Milgram, 2010, Breitner et al., 2011, Gupta et al., 2015).
We found loss of perivascular PDGFRβ pericytes simultaneous to parenchymal microvascular changes and plaque accumulation. This is in agreement with the finding that impaired PDFGRβ signaling in mice promotes loss of microvascular integrity during aging (Bell et al., 2010). Moreover, cerebrovascular damage has been implicated in the development of secondary neuronal degenerative changes (Winkler et al., 2011). Along this line, we found that M9 to M12 5xFAD mice displayed hypertrophic PDGFRβ+
cell ramifications, suggesting possible cell reactivity at the damaged microvasculature. Hypertrophic PDGFRβ+
pericyte processes were also reported in Tg2576 mice with late-stage AD, resulting in an increased, although disorganized, perivascular coverage (Park et al., 2013). Interestingly, soluble PDGFRβ levels were elevated in the CSF of subjects affected by mild cognitive impairment (Montagne et al., 2015a). Increased CSF PDGFRβ levels have been proposed as a marker of pericyte damage (Sagare et al., 2015). We speculate that PDGFRβ levels may reflect ongoing pathological cell reactivity, as soluble PDGFRβ could be released upon cleavage. Our data indicate a response of PDGFRβ+
pericytes in 5xFAD mice and, perhaps, a possible late-stage attempt in vascular protection against localized inflammation. The latter phenomenon remains to be investigated.
Final remarks
role of cerebrovascular damage in experimental (Ujiie et al., 2003, Bell et al., 2010, Kook et al., 2012, Kook et al., 2013, Marques et al., 2013, Do et al., 2014, Janota et al., 2015a, Janota et al., 2015b, Zenaro et al., 2015) and clinical AD (Attems, 2005, Weller et al., 2008, Deane et al., 2009, Marchesi, 2011, Carare et al., 2014). Specific cerebrovascular protective strategies could be paired with available AD therapeutic approaches.
TABLE 1. Summary of cell or fluorescent signal quantification (* WT vs 5xFAD; # age within groups; p<0.05. See methods for statistic).
Area Age Months (n = mice number) FITC+ Vessel WT (µm) FITC+ Vessel 5xFAD (µm) GFAP (fold increase compared to WT) IBA1 (fold increase compared to WT) Thio S Plaques (plaques/ mm2) PDGFRβ (perivascular pericytes/µm of single vessel) Frontal Cortex 2 (n=4) 11693,17 +224,98 11690,97 +299,30 3,48 +0,64 1,43 +0,15 0 0,0208 +6,63E-4 4 (n=6) 10218,67# +190,48 9414,69*# +196,70 4,51 +0,72 1,79 +0,37 149,71 +18,07 0,0176# +8,97E-4 9 (n=4) 10530,04 +262,24 7821,21*# +325,88 39,53 +6,42 9.52 +3.28 168,42 +11,44 0,0226 +9,34E-4 12 (n=4) 9677,72 +344,13 8266,29* +252,62 72,63 +8,64 9,56 2,13 224,40 +21,54 0,0300 +9,41E-4 Parietal Cortex upper 2 (n=4) 10948,46 +195,14 10325,78* +196,27 0,99 +0,35 1,04 +0,33 0 0,0244 +6,77E-4 4 (n=6) 9167,79# +165,10 9150,47# +200,56 2,02 +0,33 2,47 +0,64 84,34 +8,80 0,0162# +9,19E-4 9 (n=4) 9789,55 +388,04 8212,69*# +226,32 22.04 +11.56 2,55 0,51 110,56 +10,17 0,0193 +8,41E-4 12 (n=4) 9449,05 +350,16 7828,15* +279,34 25,25 +2,07 4,24 +0,53 106,33 +7,20 0,0321 +9,41E-4 Parietal Cortex lateral 2 (n=4) 9976,08 +328,55 8768,74 * +313,99 1,57 +0,44 2,15 +0,59 0 0,0274 +8,08E-4 4 (n=6) 8414,51# +177,81 7538,00*# +220,75 3,28 +0,63 2,26 +0,26 79,17 +21,08 0,0172# +8,34E-4 9 (n=4) 8668,98 +282,47 7026,60* +224,88 36,66 +20,07 2,34 +0,23 100,86 +6,03 0,02036 +9,61E-4 12 (n=4) 10135,02# +673,80 6976,46* +324,54 33,42 +5,77 3,68 +0,28 83,37 +7,20 0,0354 +1,02E-3 Dentate Gyrus 2 (n=4) 9862,23 +161,20 9905,20 +129,60 1,34 +0,30 1,04 +0,36 0 0,0213 +9,23E-4 4 (n=6) 8243,86# +150,42 8164,24# +144,99 1,12 +0,21 1,93 +0,34 61,49 +4,78 0,0204 +9,63E-4 9 (n=4) 7907,99# +140,06 7737,63 +212,15 17,77 +4,84 4,60 +0,86 92,03 +6,25 0,02025 +1,2E-3 12 (n=4) 7783,76# +232,89 6844,48*# +135,19 14,16 +1,28 4,04 +0,59 121,87 +5,67 0,0308 +1,10E-3 Entorhi nal Cortex 2 (n=4) 7930,20 +136,52 7538,78 +226,73 1,22 +0,12 0,74 +0,03 0 0.01524 ±7,18E-4 4 (n=6) 6591,05# +133,73 6429,83# +168,40 1,43 +0,43 1,40 +0,36 60,20 +11,77 0.01566 ±6,826E-4 9 (n=4) 6126,21 +262,23 5826,52 +275,90 33,78 +7,28 3,83 +0,56 106,25 +10,60 0.01761 ±1.033E-3 12 (n=4) 6630,29 +607,02 5194,76* +144,08 57,00 +9,58 7,74 +0,84 89,08 +3,77 0.02218 ±1.11E-3
Figure 1. Evidence for CAA progression in 5xFAD mice. A-A1) Examples of in vivo 2-photon microscopy indicate progressive CAA and amyloid plaques accumulation (methoxy-XO4 rendered in red; yellow arrows and arrowheads) in leptomeningeal and large penetrating cortical vessels (FITC-dextran rendered in white). B-B1 and C) Examples of perivascular amyloid deposits typical of CAA. Dotted lines in B and C delimit the FITC+ intravascular space (blood stream). Note the anatomical distance and alignment between FITC+ and methoxy-XO4+ signals (B). C1-C2) Examples of CAA deposits impinging the FITC+ intravascular signal (arrows). See also Supplemental Movie 1.
Figure 2. Mouse specific 2-photon microscopy quantifications. A) Number of CAA+ vessels (%) overtime and B) absolute number of plaques. C-D) Increase of CAA and plaque volume (µm3) was quantified for each animal over time during 2-photon sessions. Note that in the cortical regions analyzed the CAA volume was greater than plaque volume. E) Significant correlation between CAA and plaque appearance over time (linear regression, Pearson’s r).
Figure 3. Progressive microvascular pathology and leakage in 5xFAD mice. A) Example of parenchymal Aβ accumulation (purple) over time (M2 to M12) corresponding to microvascular damage (FITC-albumin, rendered in white). See Table 1 for regional and age dependent quantifications. B-B1) Microvascular leakages (arrowheads) appeared at M4 in 5xFAD mice, becoming common at M9 and M12 (B1-B2). C1) Adjacent cortical radial vessels (collagen-IV) displayed different pattern of intraluminal FITC-albumin, suggestive of irregular vascular perfusion. See text for details. C and C2) Z-stack confocal reconstructions of microvascular damage (dotted lines). FITC+ cells (green arrow) proximal to microvessels were observed in some cases, further supporting albumin extravasation.
Figure 4 A-A2) Ex-vivo immunostaining performed at the end of the 2-photon protocol in 5xFAD mice. Methoxy-XO4 immunoreactivity was confirmed in pial and penetrating vessels (collagen-IV and CD31). B-B1) Examples of sporadic CAA in parenchymal microvessels. Reactive IBA1+ microglia were adjacent to the microvessels (see also Figure 6). B2) Plaques were widespread at M5, typically associated with IBA1 reactivity.
Figure 5. Radar graphs of microvascular damage and inflammation during AD pathophysiology. Each corner in the pentagon corresponds to a specific brain region while aging is color coded. Y axis indicates: i) fold changes FITC+ microvascular length in M4, M9 and M12 as compared to M2 mice (WT in A; 5xFAD in B); ii) fold changes of plaque accumulation and inflammation in 5xFAD vs. WT (D, E and F). A-B) FITC+ microvascular changes during aging in WT and 5xFAD mice (see Table 1 for raw data and statistics). C) Microvascular reduction was significantly increased in 5xFAD specifically in the fronto-parietal cortices at M2-M4, while hippocampus and entorhinal cortex were affected at M12 in 5xFAD as compared to WT animals.
Grey shadow indicates p < 0.05. D-F) Topography and fold changes of Aβ accumulation and
Figure 6. Microvascular leakage defines pro-inflammatory sites. A-B) Parenchymal FITC+ microvascular damage (dotted lines) was associated with IBA1 inflammation and not CAA, while plaques (Methoxy-O4) were abundant. B-B2) Amoeboid IBA1+ microglia overlaps with regions of FITC-albumin parenchymal extravasation (dotted lines). C-C2) Ramified microglia lining the microvessels. D-D2) Multicellular assembly was observed at the microvasculature, consisting with IBA1+ microglial and PDGFRβ+ pericytes. E-F) Z-stack images indicating the lack of colocalization between perivascular (arrows) GFAP, IBA1 and PDGFRβ. Note the presence of parenchymal cell aggregates (arrowhead) positive for PDGFRβ and IBA1.
Figure 7. Perivascular pericytes changes overtime. A) Examples of age dependent PDGFRβ+ (rendered in white)
pericyte changes (DAPI rendered in purple) in the fronto-parietal cortex. Note the appearance of hypertrophic perivascular ramification at M9-M12. B) Percentage of total microvessels associated with PDGFRβ+ pericytes. Raw data inside bar graphs
refers to raw vessel counting (vessel-pericytes/total vessels). Data presented are age (M2 to M12) and region specific. B1) Individual microvessels (indicated as single data point) and pericyte coverage expressed in function of vessel length (µm). Note the significant decrease in pericyte number and coverage at M4, corresponding to plaque accumulation (Table 1). Each data point indicates the number of PDGFRβ+ pericytes (soma)
per µm of individually counted microvessel (see Methods for
details). Pericytes coverage was increase at M12 (non-parametric Kruskal-Wallis test. p<0.05).
References
Abbott NJ, Patabendige AA, Dolman DE, Yusof SR, Begley DJ (2010) Structure and function of the blood-brain barrier. Neurobiology of disease 37:13-25.
Abbott NJ, Ronnback L, Hansson E (2006) Astrocyte-endothelial interactions at the blood-brain barrier. Nature reviews Neuroscience 7:41-53.
Armulik A, Genove G, Betsholtz C (2011) Pericytes: developmental, physiological, and pathological perspectives, problems, and promises. Developmental cell 21:193-215. Armulik A, Genove G, Mae M, Nisancioglu MH, Wallgard E, Niaudet C, He L, Norlin J,
Lindblom P, Strittmatter K, Johansson BR, Betsholtz C (2010) Pericytes regulate the blood-brain barrier. Nature 468:557-561.
Attems J (2005) Sporadic cerebral amyloid angiopathy: pathology, clinical implications, and possible pathomechanisms. Acta neuropathologica 110:345-359.
Bell RD, Winkler EA, Sagare AP, Singh I, LaRue B, Deane R, Zlokovic BV (2010) Pericytes control key neurovascular functions and neuronal phenotype in the adult brain and during brain aging. Neuron 68:409-427.
Bien-Ly N, Boswell CA, Jeet S, Beach TG, Hoyte K, Luk W, Shihadeh V, Ulufatu S, Foreman O, Lu Y, DeVoss J, van der Brug M, Watts RJ (2015) Lack of Widespread BBB Disruption in Alzheimer's Disease Models: Focus on Therapeutic Antibodies. Neuron 88:289-297.
Bilkei-Gorzo A (2014) Genetic mouse models of brain ageing and Alzheimer's disease. Pharmacology & therapeutics 142:244-257.
Breitner JC, Baker LD, Montine TJ, Meinert CL, Lyketsos CG, Ashe KH, Brandt J, Craft S, Evans DE, Green RC, Ismail MS, Martin BK, Mullan MJ, Sabbagh M, Tariot PN, Group AR (2011) Extended results of the Alzheimer's disease anti-inflammatory prevention trial. Alzheimer's & dementia : the journal of the Alzheimer's Association 7:402-411.
Breteler MM (2000a) Vascular involvement in cognitive decline and dementia. Epidemiologic evidence from the Rotterdam Study and the Rotterdam Scan Study. Annals of the New York Academy of Sciences 903:457-465.
Breteler MM (2000b) Vascular risk factors for Alzheimer's disease: an epidemiologic perspective. Neurobiology of aging 21:153-160.
Carare RO, Bernardes-Silva M, Newman TA, Page AM, Nicoll JA, Perry VH, Weller RO (2008) Solutes, but not cells, drain from the brain parenchyma along basement membranes of capillaries and arteries: significance for cerebral amyloid angiopathy and neuroimmunology. Neuropathology and applied neurobiology 34:131-144.
Carare RO, Hawkes CA, Jeffrey M, Kalaria RN, Weller RO (2013) Review: cerebral amyloid angiopathy, prion angiopathy, CADASIL and the spectrum of protein elimination failure angiopathies (PEFA) in neurodegenerative disease with a focus on therapy. Neuropathology and applied neurobiology 39:593-611.
Carare RO, Hawkes CA, Weller RO (2014) Afferent and efferent immunological pathways of the brain. Anatomy, function and failure. Brain, behavior, and immunity 36:9-14. Cifuentes D, Poittevin M, Dere E, Broqueres-You D, Bonnin P, Benessiano J, Pocard M,
Mariani J, Kubis N, Merkulova-Rainon T, Levy BI (2015) Hypertension accelerates the progression of Alzheimer-like pathology in a mouse model of the disease. Hypertension 65:218-224.
Deane R, Bell RD, Sagare A, Zlokovic BV (2009) Clearance of amyloid-beta peptide across the blood-brain barrier: implication for therapies in Alzheimer's disease. CNS &
Do TM, Alata W, Dodacki A, Traversy MT, Chacun H, Pradier L, Scherrmann JM, Farinotti R, Calon F, Bourasset F (2014) Altered cerebral vascular volumes and solute transport at the blood-brain barriers of two transgenic mouse models of Alzheimer's disease. Neuropharmacology 81:311-317.
Dorr A, Sahota B, Chinta LV, Brown ME, Lai AY, Ma K, Hawkes CA, McLaurin J, Stefanovic B (2012) Amyloid-beta-dependent compromise of microvascular structure and function in a model of Alzheimer's disease. Brain : a journal of neurology 135:3039-3050.
Elder GA, Gama Sosa MA, De Gasperi R (2010) Transgenic mouse models of Alzheimer's disease. The Mount Sinai journal of medicine, New York 77:69-81.
Fernandez-Klett F, Potas JR, Hilpert D, Blazej K, Radke J, Huck J, Engel O, Stenzel W, Genove G, Priller J (2013) Early loss of pericytes and perivascular stromal cell-induced scar formation after stroke. Journal of cerebral blood flow and metabolism : official journal of the International Society of Cerebral Blood Flow and Metabolism 33:428-439.
Giannoni P, Gaven F, de Bundel D, Baranger K, Marchetti-Gauthier E, Roman FS, Valjent E, Marin P, Bockaert J, Rivera S, Claeysen S (2013) Early administration of RS 67333, a specific 5-HT4 receptor agonist, prevents amyloidogenesis and behavioral deficits in the 5XFAD mouse model of Alzheimer's disease. Frontiers in aging neuroscience 5:96.
Gupta PP, Pandey RD, Jha D, Shrivastav V, Kumar S (2015) Role of traditional nonsteroidal anti-inflammatory drugs in Alzheimer's disease: a meta-analysis of randomized clinical trials. American journal of Alzheimer's disease and other dementias 30:178-182.
Hawkes CA, McLaurin J (2009) Selective targeting of perivascular macrophages for clearance of beta-amyloid in cerebral amyloid angiopathy. Proceedings of the National Academy of Sciences of the United States of America 106:1261-1266.
Hayden KM, Zandi PP, Lyketsos CG, Khachaturian AS, Bastian LA, Charoonruk G, Tschanz JT, Norton MC, Pieper CF, Munger RG, Breitner JC, Welsh-Bohmer KA, Cache County I (2006) Vascular risk factors for incident Alzheimer disease and vascular dementia: the Cache County study. Alzheimer disease and associated disorders 20:93-100.
Heppner FL, Ransohoff RM, Becher B (2015) Immune attack: the role of inflammation in Alzheimer disease. Nature reviews Neuroscience 16:358-372.
Herzig MC, Winkler DT, Burgermeister P, Pfeifer M, Kohler E, Schmidt SD, Danner S, Abramowski D, Sturchler-Pierrat C, Burki K, van Duinen SG, Maat-Schieman ML, Staufenbiel M, Mathews PM, Jucker M (2004) Abeta is targeted to the vasculature in a mouse model of hereditary cerebral hemorrhage with amyloidosis. Nature neuroscience 7:954-960.
Hofman A, Ott A, Breteler MM, Bots ML, Slooter AJ, van Harskamp F, van Duijn CN, Van Broeckhoven C, Grobbee DE (1997) Atherosclerosis, apolipoprotein E, and prevalence of dementia and Alzheimer's disease in the Rotterdam Study. Lancet 349:151-154.
Howlett DR (2011) APP transgenic mice and their application to drug discovery. Histology and histopathology 26:1611-1632.
Iliff JJ, Goldman SA, Nedergaard M (2015) Implications of the discovery of brain lymphatic pathways. The Lancet Neurology 14:977-979.
facilitates CSF flow through the brain parenchyma and the clearance of interstitial solutes, including amyloid beta. Science translational medicine 4:147ra111.
Janota C, Lemere CA, Brito MA (2015a) Dissecting the Contribution of Vascular Alterations and Aging to Alzheimer's Disease. Molecular neurobiology.
Janota CS, Brites D, Lemere CA, Brito MA (2015b) Glio-vascular changes during ageing in wild-type and Alzheimers disease-like APP/PS1 mice. Brain research.
Jawhar S, Trawicka A, Jenneckens C, Bayer TA, Wirths O (2012) Motor deficits, neuron loss, and reduced anxiety coinciding with axonal degeneration and intraneuronal Abeta aggregation in the 5XFAD mouse model of Alzheimer's disease. Neurobiology of aging 33:196 e129-140.
Keable A, Fenna K, Yuen HM, Johnston DA, Smyth NR, Smith C, Salman RA, Samarasekera N, Nicoll JA, Attems J, Kalaria RN, Weller RO, Carare RO (2015) Deposition of amyloid beta in the walls of human leptomeningeal arteries in relation to perivascular drainage pathways in cerebral amyloid angiopathy. Biochimica et biophysica acta. Kester MI, Goos JD, Teunissen CE, Benedictus MR, Bouwman FH, Wattjes MP, Barkhof F,
Scheltens P, van der Flier WM (2014) Associations between cerebral small-vessel disease and Alzheimer disease pathology as measured by cerebrospinal fluid biomarkers. JAMA neurology 71:855-862.
Klohs J, Rudin M, Shimshek DR, Beckmann N (2014) Imaging of cerebrovascular pathology in animal models of Alzheimer's disease. Frontiers in aging neuroscience 6:32.
Klunk WE, Bacskai BJ, Mathis CA, Kajdasz ST, McLellan ME, Frosch MP, Debnath ML, Holt DP, Wang Y, Hyman BT (2002) Imaging Abeta plaques in living transgenic mice with multiphoton microscopy and methoxy-X04, a systemically administered Congo red derivative. Journal of neuropathology and experimental neurology 61:797-805. Kook SY, Hong HS, Moon M, Ha CM, Chang S, Mook-Jung I (2012)
Abeta(1)(-)(4)(2)-RAGE interaction disrupts tight junctions of the blood-brain barrier via Ca(2)(+)-calcineurin signaling. The Journal of neuroscience : the official journal of the Society for Neuroscience 32:8845-8854.
Kook SY, Seok Hong H, Moon M, Mook-Jung I (2013) Disruption of blood-brain barrier in Alzheimer disease pathogenesis. Tissue barriers 1:e23993.
Kovari E, Charidimou A, Herrmann FR, Giannakopoulos P, Bouras C, Gold G (2015) No neuropathological evidence for a direct topographical relation between microbleeds and cerebral amyloid angiopathy. Acta neuropathologica communications 3:49.
Lai AY, Dorr A, Thomason LA, Koletar MM, Sled JG, Stefanovic B, McLaurin J (2015) Venular degeneration leads to vascular dysfunction in a transgenic model of Alzheimer's disease. Brain : a journal of neurology 138:1046-1058.
Luchsinger JA, Reitz C, Honig LS, Tang MX, Shea S, Mayeux R (2005) Aggregation of vascular risk factors and risk of incident Alzheimer disease. Neurology 65:545-551. Marchesi VT (2011) Alzheimer's dementia begins as a disease of small blood vessels,
damaged by oxidative-induced inflammation and dysregulated amyloid metabolism: implications for early detection and therapy. FASEB journal : official publication of the Federation of American Societies for Experimental Biology 25:5-13.
Marques F, Sousa JC, Sousa N, Palha JA (2013) Blood-brain-barriers in aging and in Alzheimer's disease. Molecular neurodegeneration 8:38.
Miners JS, Baig S, Palmer J, Palmer LE, Kehoe PG, Love S (2008) Abeta-degrading enzymes in Alzheimer's disease. Brain pathology 18:240-252.
Mineur YS, McLoughlin D, Crusio WE, Sluyter F (2005) Genetic mouse models of Alzheimer's disease. Neural plasticity 12:299-310.
Montagne A, Barnes SR, Sweeney MD, Halliday MR, Sagare AP, Zhao Z, Toga AW, Jacobs RE, Liu CY, Amezcua L, Harrington MG, Chui HC, Law M, Zlokovic BV (2015a) Blood-brain barrier breakdown in the aging human hippocampus. Neuron 85:296-302. Montagne A, Pa J, Zlokovic BV (2015b) Vascular plasticity and cognition during normal
aging and dementia. JAMA neurology 72:495-496.
Oakley H, Cole SL, Logan S, Maus E, Shao P, Craft J, Guillozet-Bongaarts A, Ohno M, Disterhoft J, Van Eldik L, Berry R, Vassar R (2006) Intraneuronal beta-amyloid aggregates, neurodegeneration, and neuron loss in transgenic mice with five familial Alzheimer's disease mutations: potential factors in amyloid plaque formation. The Journal of neuroscience : the official journal of the Society for Neuroscience 26:10129-10140.
Park L, Zhou J, Zhou P, Pistick R, El Jamal S, Younkin L, Pierce J, Arreguin A, Anrather J, Younkin SG, Carlson GA, McEwen BS, Iadecola C (2013) Innate immunity receptor CD36 promotes cerebral amyloid angiopathy. Proceedings of the National Academy of Sciences of the United States of America 110:3089-3094.
Sagare AP, Sweeney MD, Makshanoff J, Zlokovic BV (2015) Shedding of soluble platelet-derived growth factor receptor-beta from human brain pericytes. Neuroscience letters 607:97-101.
Thal DR, Griffin WS, Braak H (2008) Parenchymal and vascular Abeta-deposition and its effects on the degeneration of neurons and cognition in Alzheimer's disease. Journal of cellular and molecular medicine 12:1848-1862.
Trepanier CH, Milgram NW (2010) Neuroinflammation in Alzheimer's disease: are NSAIDs and selective COX-2 inhibitors the next line of therapy? Journal of Alzheimer's disease : JAD 21:1089-1099.
Ujiie M, Dickstein DL, Carlow DA, Jefferies WA (2003) Blood-brain barrier permeability precedes senile plaque formation in an Alzheimer disease model. Microcirculation 10:463-470.
Verclytte S, Lopes R, Lenfant P, Rollin A, Semah F, Leclerc X, Pasquier F, Delmaire C (2015) Cerebral Hypoperfusion and Hypometabolism Detected by Arterial Spin Labeling MRI and FDG-PET in Early-Onset Alzheimer's Disease. Journal of neuroimaging : official journal of the American Society of Neuroimaging.
Weller RO, Preston SD, Subash M, Carare RO (2009) Cerebral amyloid angiopathy in the aetiology and immunotherapy of Alzheimer disease. Alzheimer's research & therapy 1:6.
Weller RO, Subash M, Preston SD, Mazanti I, Carare RO (2008) Perivascular drainage of amyloid-beta peptides from the brain and its failure in cerebral amyloid angiopathy and Alzheimer's disease. Brain pathology 18:253-266.
Winkler EA, Bell RD, Zlokovic BV (2010) Pericyte-specific expression of PDGF beta receptor in mouse models with normal and deficient PDGF beta receptor signaling. Molecular neurodegeneration 5:32.
Winkler EA, Bell RD, Zlokovic BV (2011) Central nervous system pericytes in health and disease. Nature neuroscience 14:1398-1405.
Xu F, Kotarba AE, Ou-Yang MH, Fu Z, Davis J, Smith SO, Van Nostrand WE (2014) Early-onset formation of parenchymal plaque amyloid abrogates cerebral microvascular amyloid accumulation in transgenic mice. The Journal of biological chemistry 289:17895-17908.
Yang G, Pan F, Parkhurst CN, Grutzendler J, Gan WB (2010) Thinned-skull cranial window technique for long-term imaging of the cortex in live mice. Nature protocols
5:201-Zenaro E, Pietronigro E, Bianca VD, Piacentino G, Marongiu L, Budui S, Turano E, Rossi B, Angiari S, Dusi S, Montresor A, Carlucci T, Nani S, Tosadori G, Calciano L, Catalucci D, Berton G, Bonetti B, Constantin G (2015) Neutrophils promote Alzheimer's disease-like pathology and cognitive decline via LFA-1 integrin. Nature medicine 21:880-886.
Zlokovic BV, Deane R, Sagare AP, Bell RD, Winkler EA (2010) Low-density lipoprotein receptor-related protein-1: a serial clearance homeostatic mechanism controlling Alzheimer's amyloid beta-peptide elimination from the brain. Journal of neurochemistry 115:1077-1089.