HAL Id: inserm-01071449
https://www.hal.inserm.fr/inserm-01071449
Submitted on 14 Oct 2014
HAL is a multi-disciplinary open access
archive for the deposit and dissemination of
sci-entific research documents, whether they are
pub-lished or not. The documents may come from
teaching and research institutions in France or
abroad, or from public or private research centers.
L’archive ouverte pluridisciplinaire HAL, est
destinée au dépôt et à la diffusion de documents
scientifiques de niveau recherche, publiés ou non,
émanant des établissements d’enseignement et de
recherche français ou étrangers, des laboratoires
publics ou privés.
in Alzheimer’s disease
Landel Véréna, Baranger Kévin, Virard Isabelle, Loriod Béatrice,
Khrestchatisky Michel, Santiago Rivera, Benech Philippe, François Féron
To cite this version:
Landel Véréna, Baranger Kévin, Virard Isabelle, Loriod Béatrice, Khrestchatisky Michel, et al..
Tem-poral gene profiling of the 5XFAD transgenic mouse model highlights the importance of microglial
activation in Alzheimer’s disease. Molecular Neurodegeneration, BioMed Central, 2014, 9, pp.33.
�10.1186/1750-1326-9-33�. �inserm-01071449�
R E S E A R C H A R T I C L E
Open Access
Temporal gene profiling of the 5XFAD transgenic
mouse model highlights the importance of
microglial activation in Alzheimer’s disease
Véréna Landel
1*, Kévin Baranger
1,2, Isabelle Virard
1, Béatrice Loriod
3,4, Michel Khrestchatisky
1, Santiago Rivera
1,
Philippe Benech
1†and François Féron
1†Abstract
Background: The 5XFAD early onset mouse model of Alzheimer’s disease (AD) is gaining momentum. Behavioral,
electrophysiological and anatomical studies have identified age-dependent alterations that can be reminiscent of
human AD. However, transcriptional changes during disease progression have not yet been investigated. To this
end, we carried out a transcriptomic analysis on RNAs from the neocortex and the hippocampus of 5XFAD female
mice at the ages of one, four, six and nine months (M1, M4, M6, M9).
Results: Our results show a clear shift in gene expression patterns between M1 and M4. At M1, 5XFAD animals
exhibit region-specific variations in gene expression patterns whereas M4 to M9 mice share a larger proportion of
differentially expressed genes (DEGs) that are common to both regions. Analysis of DEGs from M4 to M9 underlines
the predominance of inflammatory and immune processes in this AD mouse model. The rise in inflammation,
sustained by the overexpression of genes from the complement and integrin families, is accompanied by an
increased expression of transcripts involved in the NADPH oxidase complex, phagocytic processes and IFN-γ
related pathways.
Conclusions: Overall, our data suggest that, from M4 to M9, sustained microglial activation becomes the
predominant feature and point out that both detrimental and neuroprotective mechanisms appear to be at play in
this model. Furthermore, our study identifies a number of genes already known to be altered in human AD, thus
confirming the use of the 5XFAD strain as a valid model for understanding AD pathogenesis and for screening
potential therapeutic molecules.
Keywords: Transcriptome, Hippocampus, Neocortex, Neuro-immune processes, Inflammation, Interferon, Oxidative
stress, GTPase signaling, Microglia, Phagocytosis
Background
Significant progress has been made uncovering the role
of specific genes in Alzheimer’s disease (AD), yet little is
known about the global molecular changes leading to
neurodegeneration and brain dysfunction. One drawback
comes from the fact that brain tissue from AD patients
only becomes available post mortem, i.e. at very late
stages of the disease. For this reason, transgenic AD
mouse models are precious tools to gain insight into the
spatio-temporal changes that may affect molecular
cas-cades involved in disease progression.
The 5XFAD mouse model used in this study bears five
mutations linked to familial forms of AD and recapitulates
in a few months the main features of AD [1]. All these
mutations act in an additive manner to boost the
pro-duction of β-amyloid (Aβ) peptides, resulting from the
processing of amyloid precursor protein (APP), in
particu-lar the 42 amino acid form, Aβ42 [2-6]. Compared with
other models, 5XFAD mice display AD features much
earlier. Though they do not present a clear tau pathology,
they develop cerebral amyloid plaques and gliosis as early
as 2 months of age [1]. Electrophysiological studies
* Correspondence:[email protected]
†
Equal contributors
1Aix Marseille Université, CNRS, NICN UMR 7259, 13916 Marseille, France
Full list of author information is available at the end of the article
© 2014 Landel et al.; licensee BioMed Central Ltd. This is an Open Access article distributed under the terms of the Creative Commons Attribution License (http://creativecommons.org/licenses/by/4.0), which permits unrestricted use, distribution, and reproduction in any medium, provided the original work is properly credited. The Creative Commons Public Domain Dedication waiver (http://creativecommons.org/publicdomain/zero/1.0/) applies to the data made available in this article, unless otherwise stated.
Landel et al. Molecular Neurodegeneration 2014, 9:33 http://www.molecularneurodegeneration.com/content/9/1/33
detected hippocampal synaptic dysfunctions in M6 5XFAD
animals, concomitant with synaptic loss and memory
defi-cits [7-22]. Progressive neuronal death has been described
from M9 onwards in cortical layer 5 neurons and
subicu-lum of 5XFAD mice [12,23], a characteristic that is absent
in most AD mouse models.
How these pathophysiological alterations correlate
with global spatio-temporal changes in gene expression
remains to be thoroughly evaluated. Few prior
trans-criptomic studies examined AD mouse models, usually
at a single time point or in a single brain region [24-29].
Only two studies investigated the transcriptome of
5XFAD mice, one using RNA-seq in frontal cortex and
cerebellum of 7 week-old transgenic mice [30], the other
using whole-brain next-generation sequencing to
com-pare young (M3-6) versus old (M12) mice from 5XFAD
and Tg4-42 strains [31].
Here, we carried out a longitudinal transcriptomic
study on two major brain regions affected in AD, the
hippocampus and the neocortex, obtained from 5XFAD
female mice at presymptomatic (M1), prodromal-like
(M4) and symptomatic stages (M6 and M9) of the
pa-thology. We investigated how genes with a modulated
expression are involved in functional networks through
the use of two text-mining based softwares (Ingenuity
and PredictSearch). Among the genes involved in these
networks, a bibliographic search was performed to
iden-tify those reported in AD patients.
Our results indicate a tremendous shift in the
tran-scriptional profile between M1 and M4 in both the
cortex and hippocampus of 5XFAD mice, mainly
charac-terized by an increase in inflammatory and immune
markers. Moreover, they emphasize the predominant
activation of microglia and transcriptional activities
induced by interferon-γ (IFN-γ), likely through the
expression of interferon regulatory factor 8 (IRF8),
which stands out as a key transcriptional regulator in
our study. The main IRF8 target pathways include
anti-gen processing, antianti-gen presentation and phagosome
maturation, associated with a modulation of GTPase
sig-naling. Interestingly, a high number of dysregulated
genes are associated to AD, confirming that the 5XFAD
model mirrors, at an early age, many aspects of this
neu-rodegenerative disease.
Results and discussion
Temporal distribution of dysregulated genes reveals
dramatic changes from M4 onwards
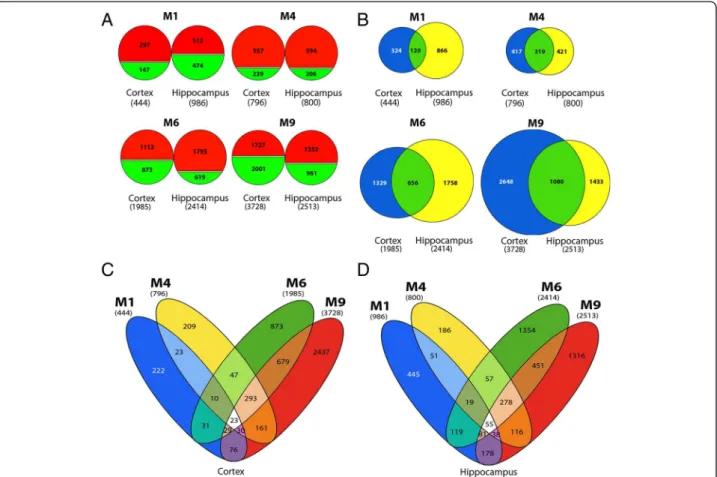
Figure 1 summarizes the global screening of gene
ex-pression analysis of cortex and hippocampus from
5XFAD compared with wild type mice at M1, M4, M6
and M9. The number of differentially expressed genes
(DEGs) increases with age in both tissues (Figure 1A)
with a drastic increase between M4 and M6 when
considering the number of up- and down-regulated
genes (Figure 1A and B).
At M1, twice as many genes are dysregulated in the
hippocampus as in the cortex (Figure 1A), suggesting
that distinct alterations occur in these two regions at
that early stage, as described at the histological level [1].
Additionally, we observed many shared DEGs between
cortex and hippocampus (Figure 1B), in particular at
M4, when nearly 50% of the DEGs are common to both
brain regions. By contrast, at M1, only 12% of the genes
modulated in hippocampus overlap with those found in
cortex (Figure 1B).
In order to evaluate the specificities at each studied
stage, we looked at overlapping and non-overlapping
DEGs in transgenic animals, from M1 to M9, separately
in cortex and hippocampus. Interestingly, the expression
of only 23 genes from the cortex and 55 from the
hippo-campus (Figure 1C and D, white areas) is modulated
across all ages (Additional file 1: Table S1). Strikingly,
the expression of an important number of genes (293 for
the cortex; 278 for the hippocampus; Figure 1C and D,
light orange areas) is altered through M4 to M9. Among
those, 183 DEGs at M4, M6 and M9 are common to
both tissues (Additional file 2: Table S2). Most of these
genes are upregulated; only 3 of these DEGs show
de-creased expression at all three ages and in both regions,
while 176 display an increased expression and 4 are
in-consistently either up- or down-regulated in cortex or
hippocampus (Additional file 2: Table S2).
DEG-related functions support alterations in inflammation
pathways and behavior
To investigate whether these quantitative changes might
reflect alterations of specific processes and/or pathways
contributing to disease progression, we looked at the most
upregulated genes in both tissues over time (Figure 2)
using Ingenuity Pathway Analysis (IPA). Six out of the top
ten upregulated genes from the cortex and four from the
hippocampus at M4 also appear among the top ten
upreg-ulated genes at M6 and M9 (Figure 2). Inflammation and
immunomodulation are the main affected processes in
these tissues, as illustrated by changes in expression of
Clec7a
(coding for the dectin-1 protein), Cst7 (cystatin F),
Itgax
(Cd11c) and genes encoding chemokines Ccl3, Ccl4,
Ccl6 and the glial fibrillary acidic protein (Gfap) (Table 1).
In contrast to these overlaps, the top ten upregulated
genes in M1 animals are fundamentally distinct from
those found in older animals (Figure 2). Only the
trans-thyretin (Ttr) gene, encoding a transporter of thyroxin
and retinol, is strongly upregulated in the cortex at both
M1 and M4 (Figure 2). Ttr, previously identified as
up-regulated in the frontal cortex of young, presymptomatic
5XFAD mice [30,31], is able to bind and sequester Aβ
peptide, thereby preventing its aggregation and plaque
formation [32-34]. The finding that high levels of Ttr
pre-cede plaque deposition is corroborated by another study
performed on Tg2576 transgenic mice, a model in which
plaque deposition does not occur until M12 [35].
More-over, Ttr was identified as a physiological target of APP,
since its expression is increased by soluble extracellular
APP processed products [34]. Interestingly, Klotho (Kl),
encoding a hormone involved in aging processes such as
oxidative stress and calcium homeostasis [36-38], was
similarly dysregulated. Both genes exhibit a similar
ex-pression profile in our transcriptomic study (Table 1),
con-firming that Ttr and Kl are co-regulated APP targets. In
the cortex, their expression decreases progressively from
M4 to M6 to reach, at M9, expression levels below those
of wild type mice. Conversely, in the hippocampus of
5XFAD mice, their expression is repressed at M1 and
up-regulated at M9. Such differential expression patterns may
highlight distinct temporally-regulated protective
capaci-ties, as observed in cultures of oxygen- and
glucose-deprived astrocytes from cortex and hippocampus [39].
IPA was then undertaken to investigate the most
af-fected networks during the time course of disease
pro-gression. When considering all DEGs at M4, M6 and
M9 (after the onset), processes associated to the
dys-regulated genes mainly relate to inflammatory and
im-mune responses (Figure 3A). As an example, Figure 3B
maps some genes associated to the complement, major
histocompatibility complexes (MHCs) and toll-like
re-ceptors (TLRs).
Such a presence of immune markers in the hippocampus
and cortex of the 5XFAD mice is not surprising since they
are produced in neurons, astrocytes and resident microglia.
In a healthy brain, they illustrate the “neuro-immune”
system that exists in the central nervous system, where, for
instance, complement cascade tags neurons destined to
destruction [40]. With age and repeated insults, these
processes may spiral out of control and lead to
degene-ration. Through the upregulation of inflammatory/immune
markers, the 5XFAD brain recapitulates the dysfunction of
the resident immune network seen in AD [41,42].
Figure 1 Overview of gene expression profiles in cortex and hippocampus of 5XFAD mice, at 4 different ages, reveals a shift in expression patterns between M1 and M4. (A) Number of up- (red) and down- (green) regulated genes in cortex and hippocampus of 5XFAD mice compared with wild type animals at M1, M4, M6 and M9. Total number of DEGs for each brain region at each age is reported in brackets. (B) Number of overlapping and non-overlapping DEGs in cortex (blue) and hippocampus (yellow) at M1, M4, M6 and M9. The center of the Venn diagram (green) illustrates the proportion of shared DEGs between both brain regions. (C and D) Number of shared and specific DEGs across all ages in cortex (C) and hippocampus (D). Analysis was based on the total number of DEGs, both up- and down-regulated at each age. Fold change (FC) cut-off used for above analyses was −1.5 > FC > 1.5 when comparing signals from 5XFAD mice with wild type controls.
Landel et al. Molecular Neurodegeneration 2014, 9:33 Page 3 of 18 http://www.molecularneurodegeneration.com/content/9/1/33
Figure 2 The top ten most up-regulated genes at each age, in cortex and hippocampus, illustrate the alteration of inflammatory and immune processes from M4 onwards. Venn diagrams representing the top ten up-regulated genes in cortex (A) and hippocampus (B) of 5XFAD mice at M1 (blue), M4 (yellow), M6 (green) and M9 (red). Genes are listed by rank of fold change, the cut-off for analysis being FC > 1.5 when comparing gene probe signals from 5XFAD with wild type mice. Note that only Ttr dysregulation is present at both M1 and M4 in the cortex while the other 9 genes are specific to M1. However, at M4, M6 and M9, 60% and 40% of these genes are consistently dysregulated in the cortex and the hippocampus, respectively.
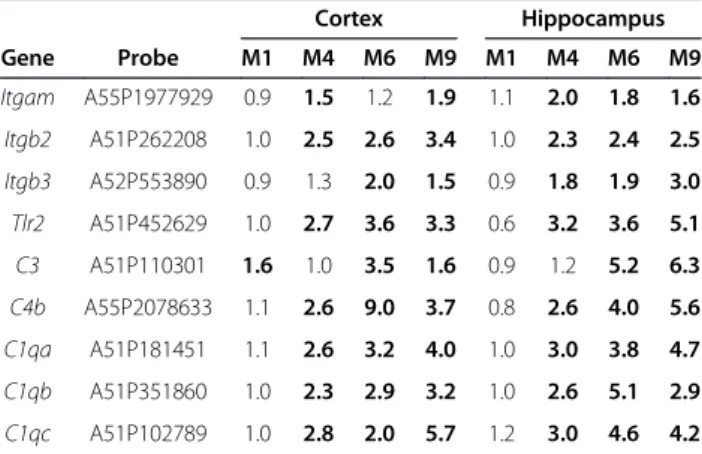
Table 1 Upregulated genes with their fold change related to inflammation and immune processes in the cortex and
hippocampus of 5XFAD mice at M1, M4, M6 and M9
Cortex Hippocampus Gene Probe M1 M4 M6 M9 M1 M4 M6 M9 Clec7a A51P246653 0.8 12.1 35.0 30.9 1.1 15.9 32.2 32.5 Cst7 A51P137419 1.0 74.7 63.5 140.2 1.3 100.5 118.4 145.8 Itgax A51P303424 0.7 16.3 13.4 19.6 0.8 16.1 14.8 23.2 Ccl3 A51P140710 1.0 15.8 14.7 15.4 0.6 11.3 7.3 17.3 Ccl6 A51P460954 1.4 12.4 9.4 13.4 1.4 13.7 10.8 9.7 Gfap A55P2157245 1.1 3.4 6.1 4.4 1.1 2.2 3.0 5.4 Gfap A52P52303 1.1 5.2 8.4 5.0 1.1 2.8 3.1 4.5 Gfap A55P2157250 1.2 8.1 8.6 11.8 0.9 4.0 8.0 3.5 Ccl4 A51P509573 0.9 9.0 7.3 9.9 0.9 12.7 10.7 11.3 Ttr A65P19832 12.2 8.7 2.5 0.7 0.2 1.2 1.0 1.5 Kl A52P439358 2.9 3.0 1.2 0.5 0.2 1.2 0.6 2.2
Figure 3 (See legend on next page.)
Landel et al. Molecular Neurodegeneration 2014, 9:33 Page 5 of 18 http://www.molecularneurodegeneration.com/content/9/1/33
In addition to inflammatory and immune changes, IPA
identified functional links between genes affected from
M6 onwards and neurological and psychological diseases
(Figure 3A). Changes in genes associated with impaired
cognitive functions are found to be a significant feature
of M9. This is consistent with published studies
repor-ting abnormal behaviors in 5XFAD mice starrepor-ting at M6
and strongly consolidated by M9 [7,12,13,19,20,43,44].
These observations suggest that disrupting the
intri-cate balance between neurons and surrounding immune
cells may lead to neuronal dysfunction and cognitive
de-terioration [45,46].
Establishment of neuroinflammation through activation
of complement
A dramatic increase in inflammation stands out as the
most striking transcriptomic result. Neuroinflammation
is a well-known hallmark of AD and is characterized by
the activation of astrocytes and microglia, which appears
in the 5XFAD mouse model near and concomitantly to
amyloid plaques [1]. In various types of brain insults,
peripheral leukocytes infiltrate the injured brain [47-49]
and intensify the neuroinflammatory response through
pro-inflammatory mediators, free radicals, lipid
peroxi-dation and oxidative stress [50-52]. Their infiltration is
mediated, in part, by CD11/CD18 integrins expressed in
neutrophils and monocytes/macrophages.
In our study, in addition to Cd11c-encoding gene
Itgax, genes such as Itgam, Itgb3, and Itgb2, encoding
re-spectively Cd11, Cd61 and Cd18, are all overexpressed
in the 5XFAD mice (Table 2). Most of these integrins
are transcriptionally induced by IL-1β and/or Aβ
through TLR2-mediated signaling [53]. In keeping with
this, we found an upregulated expression of Tlr2 at M4,
M6 and M9 (Table 2). Increases in transcript levels of
inflammatory markers such as Cd11b, Il-1β, Tnf-α and
Tlr2
have already been observed in 6 months old 5XFAD
mice [54].
Moreover, the expression of several members of the
complement, known immune effectors, is also
upregu-lated, such as C3, C4, C1qa, C1qc and C1qb, which are
all overexpressed in the cortex of AD patients [55].
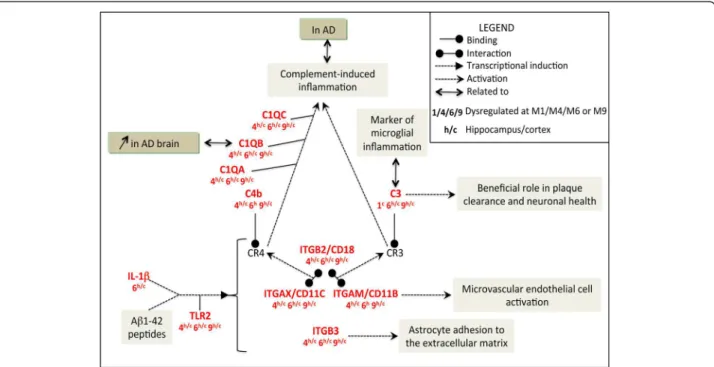
CD18 interacts with CD11b or CD11c to form the C3
receptor (CR3) and C4 receptor (CR4), respectively. C3
and C4 ligands bind to their cognate receptors, C3R
and C4R (Figure 4). Activation of these receptors is
reportedly part of the complement-induced
inflam-mation in AD mouse models and patients [56-61] and
influences microglia to adopt protective or deleterious
phenotypes in AD [31,62].
On the whole, our results point to a major raise in
in-flammation in the 5XFAD brain, linked to complement
activation and presumably to immune cell infiltration,
reminiscent of similar findings in AD patients and other
mouse models [63-68].
Altered expression of interferon gamma-induced genes
In a second approach, we applied more stringent criteria
for gene selection (see Materials and methods) to
iden-tify functional networks highly modulated in our model:
we focused on genes upregulated in both hippocampus
and cortex, from M4 to M9 or at consecutive time
points (M4/M6 and M6/M9). We then explored the
published data on these dysregulated genes to map out
the molecular and cellular players at stake. To this end,
we used IPA as well as PredictSearch, another software
for the design of functional networks [69-74]. This
com-bined analysis reveals numerous IFN-γ-induced genes,
which belong to a larger set of genes known as
inter-feron stimulated genes or ISGs (Figure 5). However, we
did not observe any change in IFN-γ gene expression in
our study. Although post-transcriptional regulation
can-not be excluded, we can postulate that IFN-γ
transcrip-tion occurs either transiently in brain cells or outside
(See figure on previous page.)
Figure 3 Metabolic pathways associated to gene dysregulation in 5XFAD cortex and hippocampus at M4, M6 and M9: common versus age-specific processes. Biological functions and metabolic pathways associated to gene expression dysregulation were identified using Ingenuity Pathway Analysis (IPA). (A) Data from both the cortex and hippocampus were analyzed as one dataset and the main metabolic pathways affected were clustered according to age (M4, blue; M6, yellow; M9, red). The metabolic pathways affected across all three ages are represented in white and are related to inflammatory and immune responses. (B) The main metabolic pathway affected at M4, M6 and M9 relates to infectious disease, cellular function and antigen presentation.
Table 2 Upregulated genes related to complement
activation in the cortex and hippocampus of 5XFAD mice
at M1, M4, M6 and M9
Cortex Hippocampus Gene Probe M1 M4 M6 M9 M1 M4 M6 M9 Itgam A55P1977929 0.9 1.5 1.2 1.9 1.1 2.0 1.8 1.6 Itgb2 A51P262208 1.0 2.5 2.6 3.4 1.0 2.3 2.4 2.5 Itgb3 A52P553890 0.9 1.3 2.0 1.5 0.9 1.8 1.9 3.0 Tlr2 A51P452629 1.0 2.7 3.6 3.3 0.6 3.2 3.6 5.1 C3 A51P110301 1.6 1.0 3.5 1.6 0.9 1.2 5.2 6.3 C4b A55P2078633 1.1 2.6 9.0 3.7 0.8 2.6 4.0 5.6 C1qa A51P181451 1.1 2.6 3.2 4.0 1.0 3.0 3.8 4.7 C1qb A51P351860 1.0 2.3 2.9 3.2 1.0 2.6 5.1 2.9 C1qc A51P102789 1.0 2.8 2.0 5.7 1.2 3.0 4.6 4.2Figure 4 The complement-induced inflammation pathway: an important mediator of neuroinflammatory processes from M4 onwards. This functional network was designed using the text-mining software, PredictSearch, based on more stringent criteria than for the above figure: only upregulated DEGs (with a FC > 1.5) found in both the cortex and hippocampus and at consecutive time points (M4/M6; M6/M9 or M4/M6/M9) were considered for analysis. Top right corner: legend for Figures 4, 5, 6, 7.
Figure 5 A large proportion of upregulated genes belong to the family of IFNγ-induced genes: engagement of inflammatory, immune, autophagic and phagocytic pathways. Legend for this figure is located in the top right corner of Figure 4.
Landel et al. Molecular Neurodegeneration 2014, 9:33 Page 7 of 18 http://www.molecularneurodegeneration.com/content/9/1/33
the brain, in peripheral blood cells. IFN-γ can be
pro-duced in the brain by glial cells [75]. However, several
reports argue in favor of T cell infiltration in AD [63,64].
In post mortem AD brain, peripheral T cells cluster
around plaques in areas of important gliosis [76-78].
Disruption of the blood-brain barrier has been reported
in M8 5XFAD mice [79]. A recent study also
demon-strates that a significant infiltration of T cells occurs in
the brain of APP/PS1 transgenic mice and that these
cells secrete IFN-γ [80]. In the same study, transferring
Aβ-specific Th1 cells to APP/PS1 mice increased
micro-glial activation and Aβ deposition and worsened
cog-nitive performances in the Morris water maze. These
observations warrant more studies to test the hypothesis
that, in the 5XFAD brain, infiltrated T cells may
poten-tially release IFN-γ, activate microglia and stimulate
ex-pression of IFN-γ induced genes.
As described below, these genes are involved in the
regulation of different processes, including immunity,
in-flammation and GTPase signaling (Figure 5).
Concerning the potential role of the immune system,
major histocompatibility complex (MHC) genes are
expressed in microglia upon cytokine stimulation in the
inflamed brain [81] and both MHC class I and II are
known to be upregulated in sporadic forms of human
AD [82]. A role for MHC class II genes in the 5XFAD
mice is supported by the parallel increase in the
expres-sion of Cd74 (Figure 5), which acts both as chaperone
for MHC class II molecules and as receptor for MIF
(macrophage migration inhibitory factor). CD74 is also
increased in AD cases compared with age-matched
con-trols, notably in neurofibrillary tangles-bearing neurons,
amyloid plaques and microglia [83]. Thus, expression
of MHC class II genes highlight the predominance of
microglia activation in the 5XFAD mice. In response to
IFN-γ, a rise in microglial MHC class II genes may
enhance antigen presentation to T cells, which, in turn,
might contribute to immune-mediated damages to
neu-rons. Interestingly, at least at a certain stage of the
dis-ease, Cd74 expression may also denote a protective
effect. Indeed, interaction of CD74 with MIF promotes a
cell survival pathway and its interaction with APP blocks
Aβ production [84,85].
In our analysis, a second large cluster of genes induced
by IFN-γ and dysregulated in 5XFAD brain encodes
pro-teins with GTPase activity (Figure 5), such as Irgm1 and
Irgm2 (members of the Immunity-Related GTPase
fam-ily M [86]), Igtp/Irgm3 (IFN-γ induced GTPase), and
Iigp1/Irga6 (interferon induced GTPase 1). Moreover,
the expression of another GTPase gene, Gvin1 (very
large interferon inducible 1) and two members of the
guanylate-binding protein genes, Gbp2 and Gbp3, is also
higher in 5XFAD animals. GBPs belong to another
fam-ily of GTPases and are the most abundant proteins that
accumulate in fibroblasts or macrophages in response to
IFN-γ stimulation [87]. A number of other GTPases, not
described to be regulated by IFN-γ, but related to TGF-β
activity, are also overexpressed in our model.
GTPases such as Irgm1 regulate, during ischemic
stroke, survival and neuronal autophagy [88], a process
that eliminates dysfunctional cell components using
ly-sosomes. Irgm1 exacerbates experimental auto-immune
encephalomyelitis by promoting disruption of the
blood-brain and blood-cerebrospinal fluid barriers [89]. In
addition to controling cell death or survival [90-92],
murine IRGs affect protein aggregate formation and
clearance [93,94] and altogether, these functions engage
the autophagic pathway [91].
A possible involvement of autophagy in 5XFAD animals
is also supported by the increased expression of known
tar-gets of Tfeb, a transcriptional factor involved in lysosomal
biogenesis [95,96]. These Tfeb targets include Gusb
(beta-glucuronidase), Naglu, Hexa, Hexb, and Ctsd [95,97], which
are greatly expressed in the 5XFAD mice from M4 to M9
in both cortex and hippocampus (Table 3). Interestingly,
the expression of Gusb was upregulated in Aβ-resistant
cells and might illustrate a protective effect against Aβ
toxicity [98]. Moreover, a role for presenilins in regulating
lysosomal function has been demonstrated [97] and several
lines of evidence suggest that endosomes/lysosomes are
in-volved in Aβ production [99,100]. Thus, our results
high-light the possible activation of the endosomal/lysosomal
system in the 5XFAD brain, in keeping with observations in
this model [101] and in human AD brains [102].
Potential role of IRF8 in the expression of interferon
gamma-regulated genes
We next explored in more detail which pathways were
ac-tivated immediately downstream of IFN-γ in the 5XFAD
brain. As detailed below, we discovered an unexpected
downstream effector of IFN-γ: Interferon Regulatory
Factor 8 (IRF8). Induction of MHC class I genes by IFN-γ
generally depends on the JAK/STAT pathway that targets
the ISRE (Interferon Stimulating Response Element) motif
[103]. By contrast, the expression of MHC class II genes
requires that the transcriptional factor CIITA forms a
complex with DNA-binding factors targeting the MHC
class II promoter [104]. The increased expression of both
MHC class I and II genes observed in 5XFAD mice
sug-gests that the two IFN-γ-signaling pathways are altered.
However, among the factors known to participate in these
pathways, only Stat3 and Socs3 display a significant
upreg-ulated expression in both tissues of 5XFAD mice, and not
before M9. Therefore, it can be assumed that novel
path-ways explain the major rise in IFN-γ-induced genes.
Among interferon-stimulated genes, it is noteworthy
that genes encoding transcription factors Irf5 and Irf8
are highly upregulated in the 5XFAD mice, from M4 to
M9 (Figure 5). Irf8 stands out as a particularly
inte-resting effector of IFN-γ. Expressed predominantly in
hematopoietic cells and further increased upon
treat-ment with IFN-γ [105-107], Irf8 is required to propagate
pro-inflammatory signals and to activate microglia [108].
IRF8 also instructs myeloid progenitors to become
mononuclear phagocytes [109,110]. A combination of
genome-wide methods already confirmed the crucial
role of IRF8 in regulating early immune response,
in-cluding phagosome maturation, antigen processing and
presentation [111,112]. Interestingly, 5XFAD mice
over-express most of the Irf8 target genes supporting these
processes (Figure 5). This strongly suggests that Irf8
ac-counts for the IFN-γ regulated processes described here
and therefore represents a key player in the 5XFAD
pathology.
Alternatively, IRF8 expression can also be induced
through TGF-β [113], which is highly overexpressed in
5XFAD mice, along with transcripts for its receptors,
Tgfbr1
and Tgfbr2 (Table 3). This pathway inhibits
mac-rophages and suppresses microglial expression of MHC
antigens [114,115], and its activation in 5XFAD brain
might therefore be a protective response against
sus-tained microglial activation.
Involvement of NADPH oxidase (NOX) complex in
microglial activation
The NOX complex contributes to persistent microglial
activation and reactive oxygen species production, which
leads to an increase in oxidative stress, regarded as an
early sign of AD pathophysiology [116,117]. Moreover,
studies on different AD mouse models, including
5XFAD mice, reported increased levels of oxidative
damage, which appear before Aβ deposition and
there-fore constitute an early event in disease pathogenesis
[24,44,118,119]. Actually, a recent proteomic analysis
re-vealed that the most affected biological processes in M4
5XFAD hippocampus include cell redox homeostasis
and response to oxidative stress [120].
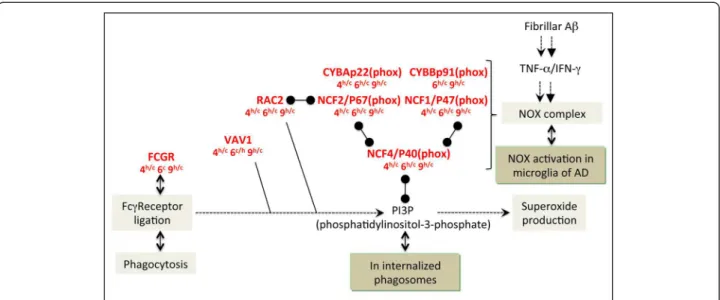
In our study, most of the genes encoding NOX
compo-nents as well as NOX associated factors, Fc receptors, Vav
and Rac2, are overexpressed as early as M4 in 5XFAD
mice (Figure 6). Of note, genes encoding the NOX
sub-units as well as Fcgr1a/CD64 (Fc fragment of IgG
recep-tor, high affinity 1a) are regulated by IFN-γ [107,121-123].
Their co-expression is in line with the observation
that clustering of Fcγ receptors activates VAV proteins
(Rho/Rac guanine nucleotide exchange factors), leading to
robust superoxide generation through NOX [124-126].
Several studies provide strong evidence for the
in-volvement of NOX and its downstream oxidative
sig-naling pathway in the toxic effects elicited by Aβ. In AD
brains, Aβ is thought to act on NOX in microglial cells,
which produce neurotoxic superoxide [127]. Aβ also
in-duces oxidative stress in hippocampal astrocytes through
a mechanism sensitive to NOX inhibitors [128].
According to these observations, NOX activation can
occur in either microglia or astrocytes. However, it is
likely that, in our model, NOX is predominantly
acti-vated in microglia. Indeed, in addition to MHC class II
Table 3 Upregulated genes, fold changes, and associated functional categories for genes consistently dysregulated
from M4 to M9
Cortex Hippocampus Gene Probe M1 M4 M6 M9 M1 M4 M6 M9 Gusb A51P211491 0.9 2.5 3.2 3.2 1.1 3.0 3.6 3.9 Lysosomal biogenesis Naglu A52P504361 1.0 2.1 2.1 2.2 0.8 1.7 2.2 2.0 Hexa A51P282667 1.1 1.9 2.0 2.3 1.2 1.7 2.3 2.4 Hexb A51P453111 1.0 2.5 2.0 3.2 0.9 2.8 2.0 3.3 Ctsd A65P13209 1.1 3.0 4.4 2.4 0.9 2.8 3.8 3.1 Tgfb1 A51P390715 1.1 1.8 1.7 2.3 0.8 2.3 2.6 1.6 TGF-β signaling Tgfbr1 A51P2137206 1.1 1.5 1.7 1.7 0.8 1.6 1.4 1.9 Tgfbr2 A51P450573 1.0 1.9 2.1 2.3 1.0 2.2 2.0 3.7 Aif1 A51P400543 1.0 2.1 2.4 2.2 1.0 2.5 2.3 2.9Markers of microglial activation Ptprc A55P1990324 1.0 2.0 1.7 2.0 1.0 2.0 2.1 2.5 Cd86 A55P1971951 0.9 1.8 2.3 2.5 1.1 2.5 3.0 3.5 Cd14 A51P172853 1.0 2.7 3.2 3.8 1.0 2.6 3.6 3.3 Igf1 A55P2031631 0.9 2.6 2.0 5.1 1.0 3.0 3.0 4.2 Protective activities Osmr A51P319460 0.9 1.6 2.7 3.1 0.7 2.5 3.0 5.3 Grn A51P192800 0.9 2.5 2.3 2.6 1.1 2.2 3.0 2.5
Fold changes are indicated in bold when FC > 1.5.
Landel et al. Molecular Neurodegeneration 2014, 9:33 Page 9 of 18 http://www.molecularneurodegeneration.com/content/9/1/33
genes and Cd74, markers of microglial inflammation
are strongly overexpressed in 5XFAD mice (Table 3),
notably Aif1/Iba1, Ptprc/Cd45, Cd68, Cd86 and Cd14
[83,129-131]. In line with the microglial origin of NOX
activation, expression of the Fcγ receptor-encoding
genes is found around senile plaques and in ramified
microglia, throughout the cortex and the white matter
of normal and AD brains [132]. Furthermore, RAC2,
which controls NOX activation by preferentially
inter-acting with the NCF2/p67(phox) NOX subunit [133], is
largely predominant in human phagocytes [134].
Microglial phagocytosis
Microglia/brain macrophages constitute about 12% of the
cells in the central nervous system, and, in addition to
antigen presentation, exhibit phagocytosis. Microglia can
phagocytose Aβ fibrils in vitro and in vivo [135].
Never-theless, Aβ phagocytosis is inefficient in AD brain despite
the presence of abundant activated microglia [136]. One
possible explanation may be that exposure of microglia to
fibrillar Aβ in vitro can induce mechanisms distinct from
those used by classical phagocytic receptors, FCGR1 and
FCGR3, or complement receptors (Figure 7). This novel
Figure 6 Increased expression of genes involved in the NADPH oxidase complex. Legend for this figure is located in the top right corner of Figure 4.
Figure 7 Increased microglial activation and induction of associated neuroprotective signaling pathways. Legend for this figure is located in the top right corner of Figure 4.
phagocytosis would require the interaction of microglia
with CD36, ITGB6, and CD47 [137].
Phagocytosis of Aβ by microglia can be also mediated
by CD14 [138], which is detected in brains of AD patients,
or by CSF1 (macrophage colony stimulating factor 1) and
its receptor, CSF1R (Figure 7). Interestingly, Csf1r
sig-naling in injured neurons facilitates protection and
sur-vival [139]. The Csf1/Csf1r complex co-signals through
Tyrobp, which, together with its receptor, Trem2, activates
signal transduction leading to brain myelination and
in-flammation [140]. The signaling involving Csf1/Csf1r/
Trem2/Tyrobp likely plays a role in the 5XFAD
physio-pathology since all the corresponding genes are strongly
upregulated from M4 to M9 in cortex and hippocampus
(Figure 7). Moreover, recent reports show that rare
TREM2
variants predispose to AD [141,142] and Trem2
mRNA and protein are increased in a transgenic mouse
model of AD [141]. It has been proposed that these
changes represent a response to rising levels of Aβ [141].
Localized to microglia around plaques and neurons in AD
models, Trem2 controls two signaling pathways that
regu-late the reactive phenotype in microglia (Figure 7). The
first of these pathways couples increases in Trem2
expres-sion on microglia with enhanced phagocytosis [143-145].
This could lead to the removal of cell debris and the
clear-ance of Aβ in AD and promote the alternative “protective”
activation state of microglia. The second Trem2 signaling
pathway suppresses inflammatory reactivity and represses
cytokine production and secretion [144], notably
TLR-and FcR-induced TNF production [146,147]. Thus, in
addition to its protective role by activating phagocytosis of
apoptotic neurons and Aβ, the predominant role of the
TYROBP/TREM2 complex might be to inhibit, rather
than to activate, the innate immune system.
Altogether, these transcriptional changes indicate that,
in 5XFAD mice, microglial activation and the resulting
phagocytosis are predominant processes, which are
already initiated at M4 and maintained at least until M9.
Other neuroprotective activities
The 5XFAD transcriptomic data identified numerous
genes involved in neuroprotective pathways. In addition to
those already discussed, we found an upregulation of genes
encoding Igf1 (insulin growth factor 1), Osmr (oncostatin
M receptor) and Grn/Pgrn (granulin) (Table 3).
Insulin and IGF1 signaling is disturbed in AD brain and
in 5XFAD hippocampus [120,148,149]. Igf1 can either
protect or increase LPS-induced damage in the developing
rat brain [150]. A possible explanation for these apparently
contradictory observations may be that modulation of
the cellular response to oxidative stress by Igf1 is
cell-dependent [151]. Contrary to what has been observed in
neurons [152], astrocyte-specific overexpression of IGF-1
protects hippocampal neurons [153].
Neuroprotection can also be elicited through OSM
(oncostatin M), a cytokine with anti-inflammatory
activ-ities. In response to IL-1β or TNF-α, astrocytes produce
prostaglandin E2, which then induces Osm expression in
microglia [154]. Upon binding to a complex formed
be-tween its receptor, OSMR, and gp130 [155], OSM can in
turn attenuate expression of IL-1β or TNF-α [156].
There-fore communications between microglia and astrocytes
may account for the balance of protective and destructive
actions by these cells. Although Osm expression levels
were similar in 5XFAD and wild type mice, elevated
expression of Osmr might increase the constitutive Osm
activity detected in neurons, astrocytes and microglia
[154]. Besides, the protective effect of Osm on neuronal
cell death is mediated by the Jak/Stat3 signaling pathway
[157]. In the 5XFAD brain, this neuroprotective effect may
be attenuated through the OSM-induced upregulation of
Socs3, a known inhibitor of Jak/Stat signaling [157].
Finally, GRN/PGRN, an AD marker [158], is involved in
the modulation of the neuroinflammatory response.
Sup-porting this role, microglia display increased Grn/Pgrn
ex-pression following a variety of acute and chronic insults to
the central nervous system [159]. Grn/Pgrn can increase
endocytosis of extracellular peptides such as Aβ and
af-fects microglial proliferation, recruitment, differentiation,
activation and phagocytosis [159]. Grn/Pgrn is a potent
in-hibitor of TNF-α and promotes the upregulation of
anti-inflammatory cytokines such as Il-4, Il-10 and Il-5 [159].
Direct interaction of GRN/PGRN with the TNF receptor
also blocks the pro-inflammatory actions of TNF-α [160].
However, GRN/PGRN can be cleaved by extracellular
proteinases such as MMP-9, −12 and −14 to produce
granulin/GRN peptides, which increase the expression of
IL-1β, IL-8 and TNF-α [161,162]. Therefore, a balance
between PGRN and its processed form GRN may
deter-mine the contributions of certain cell types or subtypes to
neuroprotection or neuroinflammation and their impact
on the 5XFAD pathophysiology.
Limitations of the study
The aim of this study was to provide an overview of the
main networks affected in 5XFAD brain, as revealed by
intensive data mining on dysregulated genes observed in
transcriptomic profiles. Such a global approach
deter-mines tendencies based on the design of networks rather
than confirms individual gene modulation at the
tran-script or protein levels. Given the stringent criteria
chosen to filter our data, most of the genes within the
described networks are significantly modulated in both
hippocampus and cortex from M4 to M9. Investigating
the role of non-shared DEGs at given time points and
analyzing specificities of each brain region is beyond the
scope of this study, but deserves further investigation in
order to elucidate the precise molecular mechanisms at
Landel et al. Molecular Neurodegeneration 2014, 9:33 Page 11 of 18 http://www.molecularneurodegeneration.com/content/9/1/33
play. Importantly, many DEGs and several signaling
pathways, associated to AD, have been found to be
mis-expressed in the 5XFAD model by two independent
studies [30,31].
Further understanding of the signaling pathways
af-fected in this mouse model, with the aim to link it to
human AD, would entail broadening the study to
ad-ditional brain regions. The entorhinal cortex, for
in-stance, is known to be the site of early neuron loss in
human AD and has recently been shown to be affected
by amyloid deposition, as early as 2 months of age in
both female and male 5XFAD mice [163].It would
there-fore be of great interest to investigate the transcriptomic
profile of this brain region in future studies.
The study would also benefit from a comparison of
transcriptomic profiles between female and male mice.
Female 5XFAD animals are more affected at the
histo-logical and behavioural levels than male mice [9,163],
possibly as a consequence of decreased estrogen levels.
Variations in estrogen levels can directly impact on
tran-scriptomic profiles through modulation of the genome
and signaling pathways. In the current study, IPA
ana-lysis revealed a large proportion of DEGs potentially
reg-ulated by estrogens and one of their receptors, ESR1
(data not shown). We also observed a dysregulated
expression of genes directly linked to the effects of
testosterone, reinforcing the idea that differential gene
modulation during the time course of the disease could
occur between male and female mice. Future studies
should take hormonal impact into consideration.
Finally, based on the data presented here and in
pre-vious studies, there is no doubt that a fine understanding
of pathogenesis necessitates deciphering early molecular
events. As a result, it would be of great importance to
enlarge the current study to a finely tuned time window
that spans for M1 to M4, when histological markers
start developing.
Despite such considerations, the data presented here
offers, for the first time, the possibility to understand
time-dependent variations in the inflammatory and
im-mune pathways of the 5XFAD model. Altogether, these
data confirm that this transgenic model, along with
the generated dataset, is a valuable public resource for
screening potential therapeutic molecules targeting
dys-regulated functions in AD.
Materials and methods
Animals
We used 5XFAD transgenic mice, which overexpress
two transgenes bearing five mutations linked to familial
AD: human APP (Swedish mutation K670N, M671L;
Florida mutation I716V; London mutation V717I) and
human presenilin 1 (PSEN1 M146L, L286V), under
tran-scriptional control of the mouse Thy1 promoter. 5XFAD
lines from the B6SJL genetic background were
main-tained by crossing hemizygous transgenic mice with
B6SJL F1 breeders. These mice exhibit AD-related
symp-toms earlier than other animal models and amyloid
de-position starts in the cortex and subiculum at 2 months
of age [1]. Heterozygous female 5XFAD transgenic
ani-mals and wild type controls were obtained after breeding
of progenitors purchased from the Jackson Laboratory.
Genotyping was performed by PCR analysis of tail DNA
in order to detect the human APP gene. Animal
experi-ments were approved by the Ethics Committee of the
Medical Faculty of Marseille and were carried out in
ac-cordance with the guidelines published in the European
Communities Council Directive of November 24, 1986
(86/609/EEC). All efforts were made to reduce animal
suffering and the number of mice.
RNA isolation
Brain tissues were collected from wild type and
trans-genic 5XFAD mice (n = 3 per group). At different
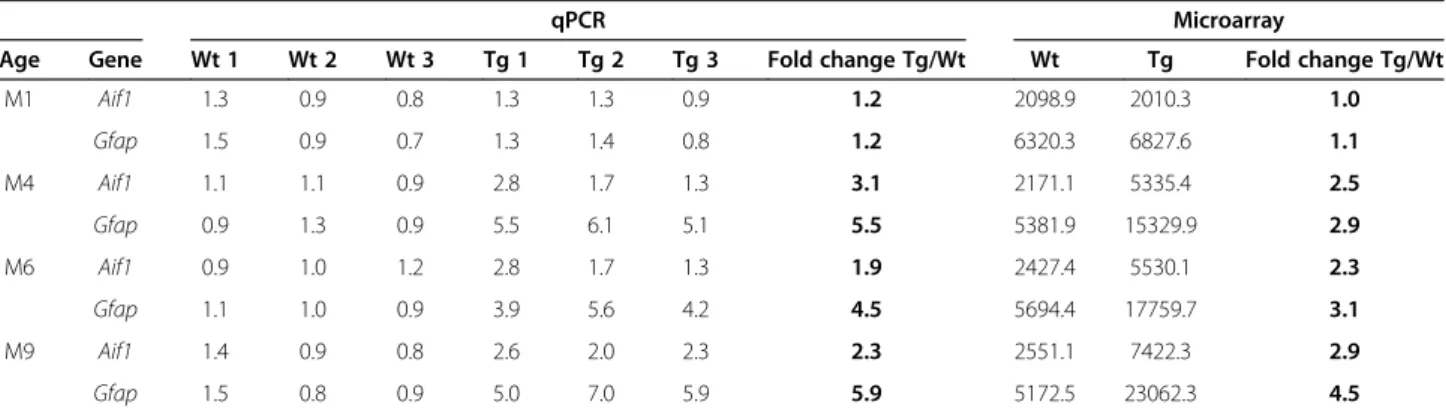
Table 4 RT qPCR results for two genes known to be upregulated in 5XFAD mice: comparison with the microarray
results
qPCR Microarray
Age Gene Wt 1 Wt 2 Wt 3 Tg 1 Tg 2 Tg 3 Fold change Tg/Wt Wt Tg Fold change Tg/Wt M1 Aif1 1.3 0.9 0.8 1.3 1.3 0.9 1.2 2098.9 2010.3 1.0 Gfap 1.5 0.9 0.7 1.3 1.4 0.8 1.2 6320.3 6827.6 1.1 M4 Aif1 1.1 1.1 0.9 2.8 1.7 1.3 3.1 2171.1 5335.4 2.5 Gfap 0.9 1.3 0.9 5.5 6.1 5.1 5.5 5381.9 15329.9 2.9 M6 Aif1 0.9 1.0 1.2 2.8 1.7 1.3 1.9 2427.4 5530.1 2.3 Gfap 1.1 1.0 0.9 3.9 5.6 4.2 4.5 5694.4 17759.7 3.1 M9 Aif1 1.4 0.9 0.8 2.6 2.0 2.3 2.3 2551.1 7422.3 2.9 Gfap 1.5 0.8 0.9 5.0 7.0 5.9 5.9 5172.5 23062.3 4.5
Before performing the microarray experiment, RNA from each wild type (Wt) and each transgenic (Tg) (n = 3 for each group) animal was tested independently by RT-qPCR for two genes known to be upregulated in 5XFAD mice: Aif1 and Gfap. This table compares results obtained by qPCR from each mouse with results obtained from the pooled RNA for all three animals in the microarray study. The qPCR and microarray gave similar fold changes, shown here in bold.
designated time points (beginning of M1, M4, M6 and
M9), mice were anesthetized with isoflurane and
sacri-ficed to extract brain tissue. Hippocampus and
neo-cortex samples were dissected, snap-frozen in liquid
nitrogen and stored at −80°C until use. Total RNA was
then isolated from frozen hippocampi and cortices using
RNeasy Mini kit (Qiagen, Courtaboeuf, France),
ac-cording to the manufacturer’s instructions. RNA
con-centration was determined using a Nanodrop 2000
spectrophotometer (Thermo Scientific, ThermoFisher
Scientific, Villebon sur Yvette, France) and RNA
integ-rity assessed on an Agilent 2100 Bioanalyzer (Agilent
Technologies, Les Ulis, France).
Real-time quantitative PCR (qPCR)
Before performing microarray experiments, RNA samples
extracted from the hippocampus of all animals (n = 3) in
each group were tested with qPCR in order to quantify
the expression of known markers of inflammation in
5XFAD mice. Total RNA (1 μg) was subjected to reverse
transcription reaction to synthetize cDNA using oligo dT,
RNase Out and M-MLV RT enzyme (Invitrogen,
Thermo-Fisher Scientific, Villebon sur Yvette, France) according
to the manufacturer’s instructions. Two genes, Gfap and
Aif1, related to astrocytic and microglial activation
re-spectively, and one housekeeping gene, Gapdh, were
selected for pre-validation of samples.
Real-time qPCR experiments were carried out with the
7500 Fast Real-Time PCR system (Applied Biosystems,
ThermoFisher Scientific, Villebon sur Yvette, France),
using TaqMan® Fast Universal PCR Master Mix (2X)
and the three TaqMan® Gene Expression Assays (Gfap,
Mm01253033_m1; Aif1, Mm00479862_g1 and Gapdh,
Mm99999915_g1). Experiments used 7.5 ng of previously
prepared cDNA and samples were run in triplicates.
Rela-tive expression levels were determined according to the
ΔΔCt method where the expression level of the mRNA of
interest is given by 2
-ΔΔCTwhere ΔΔCT = ΔCT target
mRNA − ΔCT reference mRNA (Gapdh) in the same
sample. Results are reported in Table 4 and compared to
microarray data for these two genes of interest.
Microarray assay
Following qPCR pre-validation of individual animals for
each time point and condition, RNA samples were
pooled (n = 3) for microarray hybridization. Sample
amplification, labeling, and hybridization were
per-formed in line with the Agilent one-color
microarray-base analysis (low input quick amp labeling) protocol
(Agilent Technologies). Briefly, total RNA was
reverse-transcribed into cDNA using the T7 promoter primer.
The reaction intending to synthesize cyanine-3-labeled
cRNA from cDNA was performed in a solution
con-taining dNTP mix, T7 RNA polymerase and cyanine
3-dCTP and then incubated at 40°C for 2 hours. Labeled
cRNA was purified and fragmented before
hybridiza-tion on Agilent 8×60k Mouse Gene Expression Arrays
(Agilent Technologies, ref: G4852A), containing 62 975
oligonucleotide probes, at 65°C for 17 hours. Raw
micro-array signals were scanned and extracted using Agilent
Feature Extraction Software (Agilent Technologies). AgiND
R package was used for quality control and normalization.
Quantile methods and a background correction were
applied for data normalization. Microarray data are
avail-able in the ArrayExpress database [164] under accession
number E-MTAB-1937.
Microarray data analysis
Biological interpretation of the data was performed using
two different programs. First, Ingenuity Pathway Analysis
(IPA, Ingenuity Systems [165]) was used to identify
bio-logical functions from the lists of DEGs associated to
transgenic animals. The main criteria to validate a
dif-ferentially expressed gene was a fold change over 1.5 or
under −1.5 when considering expression values in the
transgenic group relative to the wild type control group.
Upregulated and downregulated genes were analyzed in
the same datasets to obtain the biologically relevant
func-tion categories. Right-tailed Fisher’s exact test was used to
calculate a p-value determining the top statistically
signifi-cant biological functions assigned to the data set.
Secondary analysis of the main metabolic pathways and
their potential dysfunctions was performed using the Java/
Perl software Predictsearch® (Laboratoire Genex [166]),
which has been previously described [69,74]. This software
characterizes the pathways and functional networks in
which the selected genes found to be up- or
down-regulated are involved. For this mechanistic analysis, only
genes not differentially expressed across all time points
in wild type animals (ratio between 0.85 and 1.2) but
up-regulated in transgenic animals (ratio over 1.5) were
considered. Predictsearch was then used to generate
func-tional networks based on the total number of differentially
expressed genes in both cortex and hippocampus.
Additional files
Additional file 1: Table S1. Lists of genes and associated fold changes commonly dysregulated at M1, M4, M6 and M9 in (A) cortex and (B) hippocampus.
Additional file 2: Table S2. Common DEGs in cortex and hippocampus at M4, M6 and M9.
Abbreviations
5XFAD:A strain of transgenic mice that carry mutant human APP and human PSEN1 genes harbouring a total of five mutations linked to familial AD; AD: Alzheimer’s disease; APP: Amyloid precursor protein; Aβ: Beta-amyloid peptide; Aβ42: Beta-amyloid peptide 1-42; DEG: Differentially expressed gene; FAD: Familial Alzheimer’s disease; FC: Fold change; GTPases: A large family of hydrolase enzymes that can bind and hydrolyze guanosine triphosphate Landel et al. Molecular Neurodegeneration 2014, 9:33 Page 13 of 18 http://www.molecularneurodegeneration.com/content/9/1/33
(GTP); IFN-γ: Interferon gamma; IPA: Ingenuity pathway analysis; ISG: Interferon stimulated gene; M1: One month; M4: Four months; M6: Six months; M9: Nine months; MHC: Major histocompatibility complex; NADPH: Reduced form of NADP+, i.e. nicotinamide adenine dinucleotide phosphate; NOX: NADPH oxidase complex; PSEN1: Presenilin-1; Thy1: Thymocyte antigen 1.
Competing interests
The authors declare that they have no competing interest. Authors’ contributions
VL isolated the RNA, helped perform the microarray assay, analyzed the results and wrote the manuscript. KB bred and genotyped the mice, and carried out the qPCR analysis. BL performed the microarray assay. IV and SR participated in interpreting the data and writing the manuscript. PB analyzed the microarray data and wrote the manuscript. FF designed and coordinated the study, and helped to draft the manuscript. All authors read and approved the final manuscript.
Acknowledgements
This work was supported by CNRS, Aix Marseille University and grants from the French National Agency for Research (ANR) funding to FF, SR and MK (ADHOC, TIMPAD, PREVENTAD) within the frame of the French Alzheimer’s Plan. The work was also supported by grants from Fondation de l’Avenir to FF, and by “Fonds Européen de Développement Régional” FEDER in PACA. VL was recipient of a doctoral fellowship from the French Ministry of Research. KB was granted a research associate fellowship by the French Alzheimer’s Plan.
Author details
1
Aix Marseille Université, CNRS, NICN UMR 7259, 13916 Marseille, France.
2APHM, Hôpitaux de la Timone, Service de Neurologie et Neuropsychologie,
13385 Marseille, France.3Aix Marseille Université, TAGC UMR 1090, 13288 Marseille, France.4INSERM, TAGC UMR 1090, 13288 Marseille, France.
Received: 23 June 2014 Accepted: 27 August 2014 Published: 11 September 2014
References
1. Oakley H, Cole SL, Logan S, Maus E, Shao P, Craft J, Guillozet-Bongaarts A, Ohno M, Disterhoft J, Van Eldik L, Berry R, Vassar R: Intraneuronal beta-amyloid aggregates, neurodegeneration, and neuron loss in transgenic mice with five familial Alzheimer's disease mutations: potential factors in amyloid plaque formation. J Neurosci 2006, 26:10129–10140.
2. Hardy J, Selkoe DJ: The amyloid hypothesis of Alzheimer's disease: progress and problems on the road to therapeutics. Science 2002, 297:353–356.
3. Hong S, Quintero-Monzon O, Ostaszewski BL, Podlisny DR, Cavanaugh WT, Yang T, Holtzman DM, Cirrito JR, Selkoe DJ: Dynamic analysis of amyloid beta-protein in behaving mice reveals opposing changes in ISF versus parenchymal Abeta during age-related plaque formation. J Neurosci 2011, 31:15861–15869.
4. Masters CL, Selkoe DJ: Biochemistry of amyloid beta-protein and amyloid deposits in Alzheimer disease. Cold Spring Harb Perspect Biol Med 2012, 2:a006262.
5. Mucke L, Selkoe DJ: Neurotoxicity of amyloid beta-protein: synaptic and network dysfunction. Cold Spring Harb Perspect Biol Med 2012, 2:a006338. 6. Rice HC, Young-Pearse TL, Selkoe DJ: Systematic evaluation of candidate ligands regulating ectodomain shedding of amyloid precursor protein. Biochemistry 2013, 52:3264–3277.
7. Kimura R, Ohno M: Impairments in remote memory stabilization precede hippocampal synaptic and cognitive failures in 5XFAD Alzheimer mouse model. Neurobiol Dis 2009, 33:229–235.
8. Crouzin N, Baranger K, Cavalier M, Marchalant Y, Cohen-Solal C, Roman FS, Khrestchatisky M, Rivera S, Feron F, Vignes M: Area-specific alterations of synaptic plasticity in the 5XFAD mouse model of Alzheimer's disease: dissociation between somatosensory cortex and hippocampus. PLoS One 2013, 8:e74667.
9. Devi L, Alldred MJ, Ginsberg SD, Ohno M: Sex- and brain region-specific acceleration of beta-amyloidogenesis following behavioral stress in a mouse model of Alzheimer's disease. Mol Brain 2010, 3:34.
10. Devi L, Ohno M: Phospho-eIF2alpha level is important for determining abilities of BACE1 reduction to rescue cholinergic neurodegeneration and memory defects in 5XFAD mice. PLoS One 2010, 5:e12974. 11. Joyashiki E, Matsuya Y, Tohda C: Sominone improves memory
impairments and increases axonal density in Alzheimer's disease model mice, 5XFAD. Int J Neurosci 2011, 121:181–190.
12. Jawhar S, Trawicka A, Jenneckens C, Bayer TA, Wirths O: Motor deficits, neuron loss, and reduced anxiety coinciding with axonal degeneration and intraneuronal Abeta aggregation in the 5XFAD mouse model of Alzheimer's disease. Neurobiol Aging 2012, 33:196. e129-140. 13. Devi L, Ohno M: Mechanisms that lessen benefits of beta-secretase
reduction in a mouse model of Alzheimer's disease. Transl Psychiatry 2013, 3:e284.
14. Girard SD, Baranger K, Gauthier C, Jacquet M, Bernard A, Escoffier G, Marchetti E, Khrestchatisky M, Rivera S, Roman FS: Evidence for early cognitive impairment related to frontal cortex in the 5XFAD mouse model of Alzheimer's disease. J Alzheimers Dis 2013, 33:781–796. 15. Giannoni P, Gaven F, de Bundel D, Baranger K, Marchetti-Gauthier E, Roman
FS, Valjent E, Marin P, Bockaert J, Rivera S, Claeysen S: Early administration of RS 67333, a specific 5-HT4 receptor agonist, prevents amyloidogenesis and behavioral deficits in the 5XFAD mouse model of Alzheimer's disease. Front Aging Neurosci 2013, 5:96.
16. Hongpaisan J, Sun MK, Alkon DL: PKC epsilon activation prevents synaptic loss, Abeta elevation, and cognitive deficits in Alzheimer's disease transgenic mice. J Neurosci 2011, 31:630–643.
17. Zhang XM, Cai Y, Xiong K, Cai H, Luo XG, Feng JC, Clough RW, Struble RG, Patrylo PR, Yan XX: Beta-secretase-1 elevation in transgenic mouse models of Alzheimer's disease is associated with synaptic/axonal pathology and amyloidogenesis: implications for neuritic plaque development. Eur J Neurosci 2009, 30:2271–2283.
18. Shao CY, Mirra SS, Sait HB, Sacktor TC, Sigurdsson EM: Postsynaptic degeneration as revealed by PSD-95 reduction occurs after advanced Abeta and tau pathology in transgenic mouse models of Alzheimer's disease. Acta Neuropathol 2011, 122:285–292.
19. Ohno M: Failures to reconsolidate memory in a mouse model of Alzheimer's disease. Neurobiol Learn Mem 2009, 92:455–459. 20. Girard SD, Jacquet M, Baranger K, Migliorati M, Escoffier G, Bernard A,
Khrestchatisky M, Feron F, Rivera S, Roman FS, Marchetti E: Onset of hippocampus-dependent memory impairments in 5XFAD transgenic mouse model of Alzheimer's disease. Hippocampus 2014, 24:762–772. 21. Crowe SE, Ellis-Davies GC: Spine pruning in 5xFAD mice starts on basal
dendrites of layer 5 pyramidal neurons. Brain Struct Funct 2014, 219:571–580.
22. Buskila Y, Crowe SE, Ellis-Davies GC: Synaptic deficits in layer 5 neurons precede overt structural decay in 5xFAD mice. Neuroscience 2013, 254:152–159.
23. Eimer WA, Vassar R: Neuron loss in the 5XFAD mouse model of Alzheimer's disease correlates with intraneuronal Abeta42 accumulation and Caspase-3 activation. Mol Neurodegener 2013, 8:2.
24. Reddy PH, McWeeney S, Park BS, Manczak M, Gutala RV, Partovi D, Jung Y, Yau V, Searles R, Mori M, Quinn J: Gene expression profiles of transcripts in amyloid precursor protein transgenic mice: up-regulation of mitochondrial metabolism and apoptotic genes is an early cellular change in Alzheimer's disease. Hum Mol Genet 2004, 13:1225–1240. 25. Unger T, Korade Z, Lazarov O, Terrano D, Schor NF, Sisodia SS, Mirnics K:
Transcriptome differences between the frontal cortex and hippocampus of wild-type and humanized presenilin-1 transgenic mice. Am J Geriatr Psychiatry 2005, 13:1041–1051.
26. Mirnics K, Korade Z, Arion D, Lazarov O, Unger T, Macioce M, Sabatini M, Terrano D, Douglass KC, Schor NF, Sisodia SS: Presenilin-1-dependent transcriptome changes. J Neurosci 2005, 25:1571–1578.
27. Chen SQ, Cai Q, Shen YY, Wang PJ, Teng GJ, Zhang W, Zang FC: Age-related changes in brain metabolites and cognitive function in APP/PS1 transgenic mice. Behav Brain Res 2012, 235:1–6.
28. Kim TK, Lee JE, Park SK, Lee KW, Seo JS, Im JY, Kim ST, Lee JY, Kim YH, Lee JK, Han PL: Analysis of differential plaque depositions in the brains of Tg2576 and Tg-APPswe/PS1dE9 transgenic mouse models of Alzheimer disease. Exp Mol Med 2012, 44:492–502.
29. Gatta V, D'Aurora M, Granzotto A, Stuppia L, Sensi SL: Early and sustained altered expression of aging-related genes in young 3xTg-AD mice. Cell death Disease 2014, 5:e1054.
30. Kim KH, Moon M, Yu SB, Mook-Jung I, Kim JI: RNA-Seq analysis of frontal cortex and cerebellum from 5XFAD mice at early stage of disease pathology. J Alzheimers Dis 2012, 29:793–808.
31. Bouter Y, Kacprowski T, Weissmann R, Dietrich K, Borgers H, Brauss A, Sperling C, Wirths O, Albrecht M, Jensen LR, Kuss AW, Bayer TA: Deciphering the molecular profile of plaques, memory decline and neuron loss in two mouse models for Alzheimer's disease by deep sequencing. Front Aging Neurosci 2014, 6:75.
32. Schwarzman AL, Gregori L, Vitek MP, Lyubski S, Strittmatter WJ, Enghilde JJ, Bhasin R, Silverman J, Weisgraber KH, Coyle PK, Michael GZ, Talafous J, Eisenberg M, Saunders AM, Roses AD, Goldaberg D: Transthyretin sequesters amyloid beta protein and prevents amyloid formation. Proc Natl Acad Sci U S A 1994, 91:8368–8372.
33. Choi SH, Leight SN, Lee VM, Li T, Wong PC, Johnson JA, Saraiva MJ, Sisodia SS: Accelerated Abeta deposition in APPswe/PS1deltaE9 mice with hemizygous deletions of TTR (transthyretin). J Neurosci 2007, 27:7006–7010.
34. Li H, Wang B, Wang Z, Guo Q, Tabuchi K, Hammer RE, Sudhof TC, Zheng H: Soluble amyloid precursor protein (APP) regulates transthyretin and Klotho gene expression without rescuing the essential function of APP. Proc Natl Acad Sci U S A 2010, 107:17362–17367.
35. Stein TD, Johnson JA: Lack of neurodegeneration in transgenic mice overexpressing mutant amyloid precursor protein is associated with increased levels of transthyretin and the activation of cell survival pathways. J Neurosci 2002, 22:7380–7388.
36. Kuro-o M, Matsumura Y, Aizawa H, Kawaguchi H, Suga T, Utsugi T, Ohyama Y, Kurabayashi M, Kaname T, Kume E, Iwasaki H, Iida A, Shiraki-Iida T, Nishikawa S, Nagai R, Nabeshima YI: Mutation of the mouse klotho gene leads to a syndrome resembling ageing. Nature 1997, 390:45–51. 37. Kurosu H, Yamamoto M, Clark JD, Pastor JV, Nandi A, Gurnani P, McGuinness
OP, Chikuda H, Yamaguchi M, Kawaguchi H, Shimomura I, Takayama Y, Herz J, Kahn CR, Rosenblatt KP, Kuro-o M: Suppression of aging in mice by the hormone Klotho. Science 2005, 309:1829–1833.
38. Imura A, Tsuji Y, Murata M, Maeda R, Kubota K, Iwano A, Obuse C, Togashi K, Tominaga M, Kita N, Tomiyama K, Iijima J, Nabeshima Y, Fujioka M, Asato R, Tanaka S, Kojima K, Ito J, Nozaki K, Hashimoto N, Ito T, Nishio T, Uchiyama T, Fujimuri T, Nabeshima Y: Alpha-Klotho as a regulator of calcium homeostasis. Science 2007, 316:1615–1618.
39. Xu L, Sapolsky RM, Giffard RG: Differential sensitivity of murine astrocytes and neurons from different brain regions to injury. Exp Neurol 2001, 169:416–424.
40. Zabel MK, Kirsch WM: From development to dysfunction: microglia and the complement cascade in CNS homeostasis. Ageing Res Rev 2013, 12:749–756.
41. Mosher KI, Wyss-Coray T: Microglial dysfunction in brain aging and Alzheimer's disease. Biochem Pharmacol 2014, 88:594–604. 42. Streit WJ, Xue QS: Human CNS immune senescence and
neurodegeneration. Curr Opin Immunol 2014, 29C:93–96. 43. Devi L, Ohno M: Genetic reductions of beta-site amyloid precursor
protein-cleaving enzyme 1 and amyloid-beta ameliorate impairment of conditioned taste aversion memory in 5XFAD Alzheimer's disease model mice. Eur J Neurosci 2010, 31:110–118.
44. Devi L, Ohno M: Mitochondrial dysfunction and accumulation of the beta-secretase-cleaved C-terminal fragment of APP in Alzheimer's disease transgenic mice. Neurobiol Dis 2012, 45:417–424.
45. Terrando N, Monaco C, Ma D, Foxwell BM, Feldmann M, Maze M: Tumor necrosis factor-alpha triggers a cytokine cascade yielding postoperative cognitive decline. Proc Natl Acad Sci U S A 2010, 107:20518–20522. 46. Cibelli M, Fidalgo AR, Terrando N, Ma D, Monaco C, Feldmann M, Takata M,
Lever IJ, Nanchahal J, Fanselow MS, Maze M: Role of interleukin-1beta in postoperative cognitive dysfunction. Ann Neurol 2010, 68:360–368. 47. Frank-Cannon TC, Alto LT, McAlpine FE, Tansey MG: Does
neuroinflammation fan the flame in neurodegenerative diseases? Mol Neurodegener 2009, 4:47.
48. Kadhim HJ, Duchateau J, Sebire G: Cytokines and brain injury: invited review. J Intensive Care Med 2008, 23:236–249.
49. Laird MD, Vender JR, Dhandapani KM: Opposing roles for reactive astrocytes following traumatic brain injury. Neuro-Signals 2008, 16:154–164.
50. Morganti-Kossmann MC, Satgunaseelan L, Bye N, Kossmann T: Modulation of immune response by head injury. Injury 2007, 38:1392–1400.
51. Schmidt OI, Heyde CE, Ertel W, Stahel PF: Closed head injury–an inflammatory disease? Brain Res Brain Res Rev 2005, 48:388–399. 52. Bao F, Shultz SR, Hepburn JD, Omana V, Weaver LC, Cain DP, Brown A:
A CD11d monoclonal antibody treatment reduces tissue injury and improves neurological outcome after fluid percussion brain injury in rats. J Neurotrauma 2012, 29:2375–2392.
53. Jana M, Palencia CA, Pahan K: Fibrillar amyloid-beta peptides activate microglia via TLR2: implications for Alzheimer's disease. J Immunol 2008, 181:7254–7262.
54. Hillmann A, Hahn S, Schilling S, Hoffmann T, Demuth HU, Bulic B, Schneider-Axmann T, Bayer TA, Weggen S, Wirths O: No improvement after chronic ibuprofen treatment in the 5XFAD mouse model of Alzheimer's disease. Neurobiol Aging 2012, 33:833. e839-850.
55. McGeer PL, Akiyama H, Itagaki S, McGeer EG: Activation of the classical complement pathway in brain tissue of Alzheimer patients. Neurosci Lett 1989, 107:341–346.
56. Fonseca MI, Chu SH, Berci AM, Benoit ME, Peters DG, Kimura Y, Tenner AJ: Contribution of complement activation pathways to neuropathology differs among mouse models of Alzheimer's disease. J Neuroinflammation 2011, 8:4.
57. Daborg J, Andreasson U, Pekna M, Lautner R, Hanse E, Minthon L, Blennow K, Hansson O, Zetterberg H: Cerebrospinal fluid levels of complement proteins C3, C4 and CR1 in Alzheimer's disease. J Neural Transm 2012, 119:789–797.
58. Bergamaschini L, Canziani S, Bottasso B, Cugno M, Braidotti P, Agostoni A: Alzheimer's beta-amyloid peptides can activate the early components of complement classical pathway in a C1q-independent manner. Clin Exp Immunol 1999, 115:526–533.
59. Bergamaschini L, Donarini C, Gobbo G, Parnetti L, Gallai V: Activation of complement and contact system in Alzheimer's disease. Mech Ageing Dev 2001, 122:1971–1983.
60. Kulkarni AP, Kellaway LA, Lahiri DK, Kotwal GJ: Neuroprotection from complement-mediated inflammatory damage. Ann N Y Acad Sci 2004, 1035:147–164.
61. Zanjani H, Finch CE, Kemper C, Atkinson J, McKeel D, Morris JC, Price JL: Complement activation in very early Alzheimer disease. Alzheimer Dis Assoc Disord 2005, 19:55–66.
62. Crehan H, Hardy J, Pocock J: Microglia, Alzheimer's disease, and complement. Int J Alzheimers Dis 2012, 2012:983640.
63. Togo T, Akiyama H, Iseki E, Kondo H, Ikeda K, Kato M, Oda T, Tsuchiya K, Kosaka K: Occurrence of T cells in the brain of Alzheimer's disease and other neurological diseases. J Neuroimmunol 2002, 124:83–92. 64. Town T, Tan J, Flavell RA, Mullan M: T-cells in Alzheimer's disease.
Neruomol Med 2005, 7:255–264.
65. Rodrigues MC, Sanberg PR, Cruz LE, Garbuzova-Davis S: The innate and adaptive immunological aspects in neurodegenerative diseases. J Neuroimmunol 2014, 269:1–8.
66. Baglio F, Saresella M, Preti MG, Cabinio M, Griffanti L, Marventano I, Piancone F, Calabrese E, Nemni R, Clerici M: Neuroinflammation and brain functional disconnection in Alzheimer's disease. Front Aging Neurosci 2013, 5:81.
67. Shen Y, Yang L, Li R: What does complement do in Alzheimer's disease? Old molecules with new insights. Transl Neurodegeneration 2013, 2:21. 68. Veerhuis R: Histological and direct evidence for the role of complement
in the neuroinflammation of AD. Curr Alzheimer Res 2011, 8:34–58. 69. Eyles D, Almeras L, Benech P, Patatian A, Mackay-Sim A, McGrath J, Feron F:
Developmental vitamin D deficiency alters the expression of genes encoding mitochondrial, cytoskeletal and synaptic proteins in the adult rat brain. J Steroid Biochem Mol Biol 2007, 103:538–545.
70. Barrey E, Mucher E, Jeansoule N, Larcher T, Guigand L, Herszberg B, Chaffaux S, Guerin G, Mata X, Benech P, Canale M, Alibert O, Maltere P, Gidrol X: Gene expression profiling in equine polysaccharide storage myopathy revealed inflammation, glycogenesis inhibition, hypoxia and mitochondrial dysfunctions. BMC Vet Res 2009, 5:29.
71. Terrier B, Joly F, Vazquez T, Benech P, Rosenzwajg M, Carpentier W, Garrido M, Ghillani-Dalbin P, Klatzmann D, Cacoub P, Saadoun D: Expansion of functionally anergic CD21-/low marginal zone-like B cell clones in hepatitis C virus infection-related autoimmunity. J Immunol 2011, 187:6550–6563.
72. Barrey E, Jayr L, Mucher E, Gospodnetic S, Joly F, Benech P, Alibert O, Gidrol X, Mata X, Vaiman A, Guerin G: Transcriptome analysis of muscle in horses Landel et al. Molecular Neurodegeneration 2014, 9:33 Page 15 of 18 http://www.molecularneurodegeneration.com/content/9/1/33