HAL Id: hal-02284270
https://hal.archives-ouvertes.fr/hal-02284270
Submitted on 11 Sep 2019
HAL is a multi-disciplinary open access
archive for the deposit and dissemination of sci-entific research documents, whether they are pub-lished or not. The documents may come from teaching and research institutions in France or abroad, or from public or private research centers.
L’archive ouverte pluridisciplinaire HAL, est destinée au dépôt et à la diffusion de documents scientifiques de niveau recherche, publiés ou non, émanant des établissements d’enseignement et de recherche français ou étrangers, des laboratoires publics ou privés.
Electrostatic Directed Assembly of Colloidal
Microparticles Assisted by Convective Flow
Lauryanne Teulon, Yannick Hallez, Simon Raffy, François Guerin, Etienne
Palleau, Laurence Ressier
To cite this version:
Lauryanne Teulon, Yannick Hallez, Simon Raffy, François Guerin, Etienne Palleau, et al.. Electrostatic Directed Assembly of Colloidal Microparticles Assisted by Convective Flow. Journal of Physical Chemistry C, American Chemical Society, 2019, 123 (1), pp.783-790. �10.1021/acs.jpcc.8b08981�. �hal-02284270�
OATAO is an open access repository that collects the work of Toulouse
researchers and makes it freely available over the web where possible
Any correspondence concerning this service should be sent
to the repository administrator:
[email protected]
This is an author’s version published in:
http://oatao.univ-toulouse.fr/24214
To cite this version:
Teulon, Lauryanne and Hallez, Yannick
and Raffy, Simon
and Guerin,
François and Palleau, Etienne and Ressier, Laurence Electrostatic Directed
Assembly of Colloidal Microparticles Assisted by Convective Flow. (2019)
Journal of Physical Chemistry C, 123 (1). 783-790. ISSN 1932-7447
Electrostatic Directed Assembly of Colloidal Microparticles Assisted
by Convective Flow
Lauryanne Teulon,
†Yannick Hallez,
‡Simon Raffy,
†François Guerin,
†Etienne Palleau,
†and Laurence Ressier
*
,††LPCNO, Université de Toulouse, CNRS, INSA, UPS, 135 Avenue de Rangueil, 31077 Toulouse, France ‡Laboratoire de Génie Chimique, Université de Toulouse, CNRS, INPT, UPS, Toulouse, France
Supporting Information
ABSTRACT: Electrostatic directed assembly of colloidal particles on charged patterns, that is, nanoxerography, has proven to find innovative applications in plasmonics, anticounterfeiting, or particle sorting. However, this technique was restricted to dispersions of nanoparticles whose diameters are typically below 100 nm. The combination of experiments and simulations shows that this limitation is due to an uncontrolled dewetting of the substrate and to the low mobility of large particles. The “convective nano-xerography” process developed in this work overcomes this limit and allows making selective and dense assemblies of micrometer-sized particles expanding by a factor 40 the size range foreseeable.
■
INTRODUCTIONMethods to direct the assembly of colloidal particles onflexible or solid substrates have been developed1−6over the past decades in order to benefit from their original properties (mechanical, optical, and chemical...) into functional devices. Among all the existing directed assembly methods, the nanoxerography technique, based on the trapping of charged or polarizable particles on an electrostatically patterned substrate, offers the possibility to make 1D to 3D7−10particle assemblies with high resolution in a few seconds. Applications were found in plasmonics,11 anti-counterfeiting,7,12 or particle sorting.13 Interestingly, when considering nanoxerography of objects with at least one dimension above 500 nm, very little work has been done and it has been mainly related to highly anisotropic objects with one small dimension,10,14or particles dispersed in nonpolar solvents.15,16 Particle patterns were not precisely defined otherwise. Besides, few theoretical works have been devoted to describe the kinetics of particle assemblies by nanoxerography.
In this work, an improved method named “convective nanoxerography” has been developed in combination to numerical simulations to understand and overcome the limits of nanoxerography for micrometer-sized particle assemblies.
■
EXPERIMENTAL SECTIONConventional Nanoxerography Process. Figure 1a presents the process of conventional nanoxerography, com-posed of two steps (i) and (ii):
(i) The electrostatic charge writing step onto a polymethyl-metacrylate (PMMA)18 thin film. In the frame of this work, this step was carried out by electric microcontact
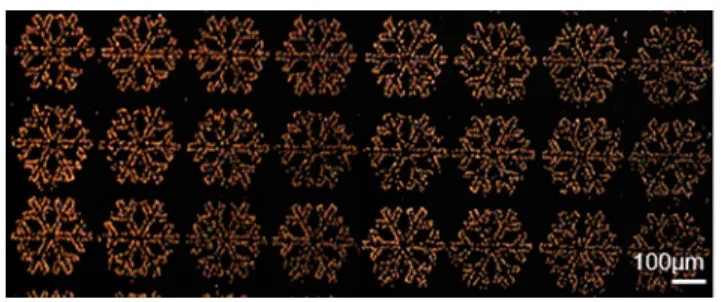
printing (e-μCP):17a 25 mm2network of 250μm width, positively charged snowflake patterns were generated by putting into contact an electrically polarized flexible stamp featuring the snowflake structures with the PMMA thinfilm. Details on the e-μCP protocol are given in page S2 of the Supporting Information. The large global dimensions of the patterns (nevertheless including micrometric features), were chosen accordingly to match with the full size range of particles (100 nm to 10 μm) to be assembled.
(ii) The development step which consists in immersing the charged substrate in the colloidal dispersion of interest during a “static” contact time tsc (typically 5−45 s), followed by a manual withdrawal of the substrate and a subsequent natural drying in air.“Dynamic” contact time tdcis defined as the sum of the time required for pulling the
substrate out of the dispersion and the time required for drying the residual thinfilm of the solvent. tdcis typically a
few seconds only. This process ends with colloidal particles electrostatically and selectively assembled onto the charged patterns. In this study, negatively charged latex particles (carboxylate functionalized, fluorescent) dispersed in isopropanol (IPA) solvent at a typical concentration range of 108particles per mL, were chosen
as model particles to be assembled on positively charged patterns.
By adjusting the bulk colloidal dispersion densityρb, tsc, and the surface potential of the charged patterns Ψs, the nano-xerography technique allows directing the assembly of a wide range of submicrometer colloidal particles.7,10,19As an example, monolayered assemblies of 100 nm latex particles were performed by nanoxerography with a good “pattern density” ρp (average surface density of particles deposited on charged
patterns) and a good“selectivity” defined as S = 1 − ρbg/ρpin
our fixed-pattern geometry, where ρbg is the average surface
density of particles deposited outside charged patterns (Figure 1b). Note that we consider the pattern density to be good when the particle pattern is clearly identifiable (in theFigure 1b case, ρp= 6.6× 106mm−2). Furthermore the selectivity is considered
to be good when the pattern is easily distinguishable from the background which implies that S has to be superior to 0.8 (in the
Figure 1b case, S > 0.9).
As previously mentioned, nanoxerography has been rarely applied to dispersions of micrometer-sized particles. However, understanding and tackling this size limitation would allow enlarging the capabilities of the technique and giving insights in the corresponding assembly kinetics. To investigate it, 1μm latex particle assembly trials were carried out using the nanoxerography protocol described above. The solution was manually stirred for a few seconds before the development step. It appears that a static contact time at least 10 times longer than the one used for 100 nm particle assemblies was required in combination with a slow and careful manual withdrawal of the substrate to start obtaining some 1μm particle assemblies but their density and selectivity were very poor (Supporting Information, Figure S1). Indeed, inhomogeneous dewetting of the substrate occurs during uncontrolled solvent evaporation, leading, sometimes, to particle aggregation at locations uncorrelated to those of charged patterns. This example reveals that both tscand the way the solvent evaporates strongly impact
microparticle assemblies by nanoxerography.
Convective Nanoxerography Process. To gain new insights into the key mechanisms involved in the nano-xerography assembly of micrometric particles, a better control over solvent evaporation was required. Therefore, instead of immersing the whole charged substrate in a colloidal dispersion
bath, a 10−15 μL drop of the colloidal dispersion was deposited on the substrate for an initial period of time tsc. The meniscus
formed by the dispersion drop on the substrate was then dragged by translating a temperature regulated stage (20°C) at a fixed speed v, called the dragging speed (between 5 and 100μm·s−1) under afixed glass blade (Scheme 1). A camera mounted on a vertical optical microscope positioned just above the glass blade allowed recording real-time videos of the particle-assembly kinetics. All experiments were conducted at a constant ambient
Figure 1.(a) Schematic representation of the conventional nanoxerography process with electrostatic charge writing using e-μCP and development by manual immersion with a static contact time tscand a dynamic contact time tdc(b) darkfield optical microscopy images of a 100 nm latex particle assembly forming snowflake patterns obtained by nanoxerography with tsc= 30 s, tdc= 1−2 s, ρb= 4.55× 10¹⁰mL−1,Ψs≃ 2 V in air (left and middle); and zoom-in on a pattern by scanning electron microscopy (right).
Scheme 1. Schematic Representation of the Convective Flow Development with an Initial Period of Static Contact Time tsc, with a Motionless Substrate, and a Second Step of
Meniscus Dragging by Substrate Translation at the Dragging Speedv Associated to a Dynamic Contact Time tdc
temperature of 20°C and a humidity ratio of 40%. More details on the set up are reported inSupporting Informationpages S3 and S4.
■
RESULTS AND DISCUSSIONAssembly Mechanisms in Conventional Nanoxerog-raphy Applied to 1 μm Particles. The application of the conventional nanoxerography process in the case of 1 μm particles is reported in Figure 2a. Note that to gain
reproducibility the set up described in Scheme 1 was used here for the development step but with a high dragging speed v fixed at 80 μm·s−1 to mimic a manual withdrawing of the
substrate. The particle concentration ρb was adjusted here at 6.825× 10⁸mL−1(in comparison toρb= 4.55× 10¹⁰mL−1in
the 100 nm nanoparticle case) so that the surface-covering concentration (defined as the concentration of particles in Ps· mL−1multiplied by the covering surfaceor surface section of a single particle) is identical for each particle size case. The pattern density of monolayered assemblies was measured from microscope images obtained as detailed in Supporting
Information(Figures S2 and S3). For vanishing static contact times, the snowflake pattern is barely identifiable, whereas a good pattern-particle density (ρp> 5× 104mm−2) is obtained
for tsc= 480 s as shown onfluorescent images (Figure 2a).
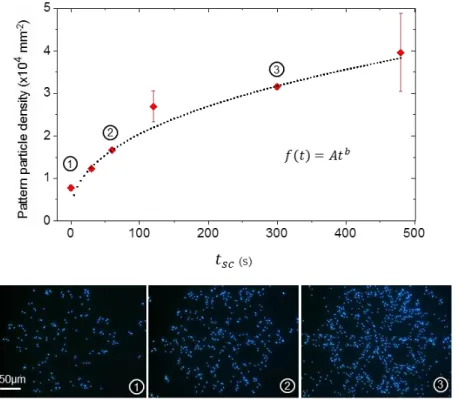
The experimental increase of particle density on a charged pattern observed as a function of tsccan befitted with a function
f(t) = Atb, where A = 970± 192 Ps·mm−2·s−1and b = 0.70±
0.04. Similar experiments on 500 nm latex nanoparticles yielded b = 0.40± 0.01 (Supporting Information, Figure S8). This trend close to tsuggests that assembly kinetics may be dictated by a diffusion mechanism. These results seem to indicate that to overcome the nanoxerography limitation for large particles, a long period of time is at least required for particles to move toward the charged patterns by diffusion before electrostatics take over at short distances from the substrate.
To confirm and improve our mechanism analysis, mean-field Brownian dynamics (BD) simulations20,21were undertaken. For each simulation, a few tens of particles of diameter d = 1μm were randomly placed in a 3D numerical domain of dimensions Lx× LY× Lz= 300× 200 × 2 μm3and a charged pattern of length Lp
= 200μm was introduced at the bottom of this domain. The particle positions were derived with a standard BD algorithm. The electrostatic forces exerted on each particle were computed by integration of the excess osmotic stress tensor on their surface. The latter is a function of the electrostatic potentialfield which is obtained in general by solving the Poisson−Boltzmann (PB) equation. When the electrostatic potential is moderate (less than about 40 mV), this equation can be linearized and is known as the Debye−Hückel (DH) equation
2
ψ κ ψ
Δ = (1)
whereψ is the electric potential scaled by kT/e, k is Boltzmann’s constant, T = 293 K is the absolute temperature, e is the unit charge, andκ is the inverse of the Debye length lD. Even for highly charged surfaces, the DH equation is valid at large distances because of the decay of the potential. It can therefore match predictions of the nonlinear PB equation provided the boundary conditions are modified. For constant surface potentials, the latter are termed“effective” surface potentials. In the present work, both the particles and the substrate obey constant effective potential conditions. On the particle surfaces, it stems from a special case of charge regulation as shown in
Supporting Information(see pages S7 and S8).22An effective surface potential valueψs =−3.41 and an effective screening length lD≈ 10 μm were measured by electrophoresis. On the
charged pattern, the constant effective potential condition ψp≈ 4 comes from the effective surface charge saturation phenomenon observed for very large surface charge densities.23 The solution of the DH eq 1 with effective surface potential conditions is expected to be close to that of the full nonlinear PB theory with true surface potentials or charge densities when the distances between charged surfaces are larger than O(lD). The dispersions considered here are dilute everywhere but on the charged pattern so the particle layer structuration on the pattern is only qualitative but the migration of particles in the dispersion is quantitative.
The DH equation was solved numerically with a finite-difference scheme modified with the so-called level-set/ghost fluid method to enforce the boundary conditions on the moving surfaces of the particles. The grid used to discretize the space contained 1200× 800 × 16 cells, which was enough to obtain particle trajectories independent of the grid size. More details on the numerical solver can be found in refs.20,21
Figure 2.(a) Pattern particle density as a function of the static contact time tscwith a dragging speed of 80μm·s−1(tdc= 31 s) andfluorescent optical microscopy images of corresponding assemblies. (b) Scaled pattern particle density as a function of tsc in nanoxerography simulations (black); short-time model (3) (violet); long-time model (4) (blue). Inset: simulated dimensionless potentialψ (colormap) and particle trajectories (white lines) at the final time. Dashed lines materialize a distance lDaround particles.ρb= 6.825× 10⁸mL−1in every experiment and simulation.
Note that the experiments reported inFigure 2a were carried out pulling the stage at a speed of 80μm·s−1and that convection was not included in the simulations. This is not a problem because at these large dragging speeds the hydrodynamicflow is parallel to the substrate, inducing advective flows of particles parallel to the substrate, whereas assembly on the substrate is driven by particle flows essentially normal to the substrate (diffusion and electrostatic repulsions).
Numerical results corresponding to the experimental conditions of Figure 2a are reported inFigure 2b. Here, the pattern density is scaled by ρblD. Note that because these simulations are quasi-2D, the electrostaticfield generated by the charged pattern is stronger and longer-ranged than the experimental one, so the numerical value of ρp cannot be
compared directly to its experimental counterpart. Simulations allow nonetheless to understand the mechanisms at play in the experiments. They reveal in particular the existence of two successive phases in the particle migration process, as shown in
Figure 2b. These two regimes can be understood by considering the 1D transport equation for the particle density above a charged surface
D mF
( ( ) )
tρ y ρ yρ ρ
∂ = ∂ ∂ − (2)
The “diffusion” term includes both the effects of Brownian motion and of particle−particle interactions through the collective diffusion coefficient D(ρ) which can be computed from the generalized Stokes−Einstein relation and the PB cell model as detailed in Supporting Information page S9. The second term accounts for the migration of particles with mobility m due to the electrostatic force exerted by the charged substrate F(y). Note that particle sedimentation is neglected in this model. This will be discussed hereafter.
During thefirst and fast phase, particles placed at a distance from the charged pattern comparable to or smaller than the screening length lDinteract with the charged substrate with an
energy much larger than kT so the diffusion term in eq 2is negligible compared to the migration term (see the quasi “ballistic” trajectories of these particles in the insert ofFigure 2b). Using a Derjaguin−Landau−Verwey−Overbeek-like force model for F24(Supporting Information, Figure S5), the solution of (eq 2) is i k jjjt y{zzz e y l 1 b /D 1 ρ ρ τ = − + −
whereτ = lD/(mF(0)) is the characteristic migration time over the distance of influence of electrostatics. Integrating in time the flux density ρmF evaluated on the substrate then yields the density of adsorbed particles at short times
l ln(1 t/ )
p b D
ρ =ρ + τ (3)
The good agreement between this result and the simulation reported inFigure 2b supports the idea that particle transport is dominated by electrostatic effects in the first phase.
During the second phase, particle adsorption on the charged patterns is much slower as the particles remaining in the solvent mustfirst diffuse toward the zone y < lDbefore being captured by electrostatic forces. Mass transport is thus dominated by diffusion in the region y > lDand the last term ineq 2can be neglected. Calculations of the collective diffusion coefficient as reported in page S9 ofSupporting Informationlead to a quasi-constant value for the range of volume fractions investigated (D
∈ [220D0, 245D0]) so the constant value D(ρb) is used to solve
(eq 2) with the classical result i k jjjj y y{zzzz Dt erf 2 b ρ=ρ
Once again, time-integration of the resultingflux density at the substrate leads to the long-time result
Dt 2 p b 0 ρ ρ π ρ = + (4)
whereρ0is a constant depending on the adsorbed density at the beginning of the diffusive regime. This t1/2 dependence is consistent with the experimental data presented inFigure 2a although the prefactor is different, as expected, because the real system is not 1D. On the other hand, the agreement with the BD simulations is excellent (blue line inFigure 2b) because of the quasi-1D geometry of the numerical experiment. Note in particular that the slope of the model curves is determined theoretically, without anyfitting procedure. Other simulations undertaken with different bulk particle densities produced the same agreement.
Sedimentation was neglected both in simulations and in the model. During thefirst phase, this hypothesis is reasonable if the sedimentation velocity vsis negligible compared to the migration
velocity induced by the charged pattern, the latter being of order mF(lD). During the second phase, migration is induced by the
density gradient resulting from the rapid condensation of particles close to the charged pattern. The associated migration velocity is D(ρ)∂yρ/ρ ≈ D(ρp)/lD. For the system under consideration here, vs≈ 0.071 μm·s−1, mF(lD)≈ 33 μm·s−1, and
D(ρp)/lD≈ 4.7 μm·s−1so neglecting sedimentation is indeed justified. Moreover, significant sedimentation phenomena would induce an adsorbed density increase proportional to t in experiments, which was not observed for 1μm particles. Note however that sedimentation effects were identified by microscopy for 4.3 and 10μm particles in the same physico-chemical conditions.
To summarize this section concerning the limits of conven-tional nanoxerography, it has been shown both experimentally and numerically that the density of adsorbed particles on a charged pattern grows as t at long times. A simple two-step transport model, in excellent agreement with simulations and consistent with experiments, reveals that this behavior is due to a diffusive limitation of mass transfer in the bulk of the suspension. It is important to note that“diffusion” includes here thermal agitation and colloid−colloid repulsive interactions, the latter dominating the former by far. In conclusion, increasing the number of particles assembled on charged patterns requires increasing colloid−colloid repulsions, which can be achieved by increasing the colloidal concentration, the colloidal surface charge, or the screening length. Increasing the pattern charge amplitude is not critical because it is already large enough for the charged pattern−colloid interactions to be nonlimiting. In brief, as far as physico-chemical levers are concerned, nanoxerography works more efficiently by increasing the osmotic pressure of the colloidal suspension. If this is not an option, as in the present experimental system, we show in the next part that hydro-dynamics can be introduced to enhance the performances of nanoxerography.
Assembly Mechanisms in Convective Nanoxerogra-phy Applied to 1 μm Particles. In order to increase the density of particles assembled on charged patterns, we
introduced the effect of an evaporation-induced flow field. This so-called“convective nanoxerography process” (Scheme 1) is inspired from the convective self-assembly (CSA)25technique which rests on the formation of an evaporation-inducedflow of solvent from the bulk of the drop to the triple line defined as the air/solvent/substrate meniscus interface. This flow transports particles toward and inside the meniscus, andfinally brings them to the substrate surface to form different coating-like films26,27or lines.28In these experiments, as in the simulations described hereafter, the substrate was dragged under the blade immediately after the drop was deposited so the static contact time tscis close to zero and the full assembly process is influenced by hydrodynamics. The diffusive regime described in the previous part is thus absent, which facilitates the analysis of the influence of hydrodynamics. Note however that for practical applications, more particles can be adsorbed on the charged patterns if a non-zero static contact time is allowed before dragging the blade.
Optical microscopy recordings reveal that the first particles rapidly adsorbed on the charged substrate act as anchoring sites for the triple line. The interface of the drop then takes the form depicted inFigure 3a with a meniscus followed by a wetfilm of height hf≃ d and of length Lp≈ 1 mm.
Numerical simulations were performed to evaluate the 1μm particle motion qualitatively during a convective nanoxerog-raphy process and to analyze the capabilities offered by the convective phenomenon. The geometric configuration was slightly different from the experimental one for the sake of
simplicity (Figure 3a). The numerical domain was restricted to y < hm, where hmis the height of the glass blade tip, so the blade
was not explicitly included. The particle dynamics were computed in the substrate reference frame as before, with the additional effect of a model background flow field u = um+ue. The mostly uniformflow um≈ (−v, 0) is due to the blade-induced motion of the meniscus only (without evaporation) and ueis the evaporation-inducedflow under the blade that would
exist even withfixed glass blade and substrate. Hydrodynamic interactions between particles can be neglected in the present dilute regime.
Particles located in the wetfilm (x > x2) (seeFigure 3a) are
considered trapped sou only needs to be computed for x < x2. In the wet layer, particles are quite distant and the layer height hf≈
d is much smaller than its length Lpsoue(x2,y) can be estimated using the Navier−Stokes equation with the lubrication approximation (gradients along thefilm are much smaller than in the direction perpendicular to the substrate), a no-slip condition on the substrate, and a slip condition at the free surface. p x u x 2 e 2 η ∂ ∂ = ∂ ∂ (5) p y 0 ∂ ∂ = (6)
Figure 3.(a) Scheme of the idealized configuration used for the convective development simulations with the red rectangle defining the simulation domain and (b) snapshots of the displacements of 1μm latex particles in these simulations. The arrows represent the instantaneous velocity vectors with a length proportional to the velocity magnitude. The dimensionless parameter Ruis defined as the ratio uum
e
| | | |.
u y 0; u(0) 0 y hf ∂ ∂ = = = (7) The solution is Ä Ç ÅÅÅÅÅ ÅÅÅÅÅ ÅÅÅÅÅ É Ö ÑÑÑÑÑ ÑÑÑÑÑ ÑÑÑÑÑ u x y Q h y y h ( , ) 3 2 ( 2 ) 0 e 2 e f 3 f = − − (8)
where Qe= veLpis the total evaporation-inducedflow rate per
unit length of the drying film at position x2 and ve is the evaporation rate depending only on thermodynamics. The wet layer length Lpis imposed by a balance between the capillary pressure at the end of the wetfilm and the pressure loss due to viscous dissipation in thefilm,29and is of the order of 1 mm.
There is no clear boundary condition at y = hmbelow the blade
(x < x1) so for simplicity the same form offlow field is used with hfreplaced by the blade height hm. Note that in doing so theflux
evaporated along the meniscus is neglected.
Finally, below the meniscus joining the glass blade and the one-particle layer (x1≤ x ≤ x2), the lubrication approximation is questionable. The form of the previous equation will however be retained to produce an analytical approximation of theflow field. The height hfis replaced by the local meniscus height h(x) = hm
+ x1− x (the meniscus is assumed to be flat and inclined at 45°). The vertical velocity is found by solving the continuity equation ∇·ue= 0 and the result is
Ä Ç ÅÅÅÅÅ ÅÅÅÅÅ ÅÅÅÅ É Ö ÑÑÑÑÑ ÑÑÑÑÑ ÑÑÑÑ u x x x y Q h x y y h x y h x ( , ) 3 2 ( ) ( 2 ( )) 1 ( ) e 1 2 e 3 ≤ ≤ = − − − (9)
This imposedflow is only a model but it imposes the correct totalflow rate Qeand it respects mass conservation. The main
goal of these simulations is to illustrate the competition between the evaporation-induced flow ue driving particles toward the
substrate and the blade/meniscus-induced flow um swiping particles toward the left without helping deposition. Note that the simulation methodology used here, with its approximate treatment of hydrodynamics, is indeed sufficient to draw these conclusions. However, obtaining more quantitative data would require a refinement of the numerical method beyond what exists presently (solve theflow between particles and possibly in the gas phase, include solvent properties jump at the free surface for electrostatics, include triple-line calculation for the de-wetting process...).
Simulation results are schematically shown inFigure 3b as a function of the dragging speed and the corresponding numerical simulations videos are available inSupporting Information. For low dragging speeds
(
R u 1)
u
u m
e
≡ || || < , the simulation snapshots displayed inFigure 3b show that the particle velocity vectors are mainly pointing toward the meniscus and the substrate. This is because the hydrodynamic flow is mainly induced by evaporation in the thin wet film and is therefore convergent toward the substrate. Particles that were unable to reach the substrate by diffusion alone on the experimental time scale are brought in its vicinity by convection. The latter thus contributes to bring more particles in the electrostatic attraction range of charged patterns and so increases the density of particles per pattern, but also out of charged patterns as shown inFigure 3b. The convectiveflow is considered as “constructive” in this case.
For large dragging speeds (Ru> 1), the evaporation-induced flow is negligible compared to the swiping flow due to the displacement of the blade and meniscus and particles are mainly translated laterally above the charged patterns as illustrated by the snapshot shown in Figure 3b. In this case, the weak evaporation-induced flow is useless. Simulations reveal that particles are deposited mainly on the charged patterns, although not very densely, so the nanoxerography process remains selective. When the blade-induced and the evaporation-induced flows are of comparable amplitudes (Ru≃ 1), a rotating motion
can be observed under the meniscus (see snapshot inFigure 3b and numerical videos inSupporting Information). It is generated by the local dominance ofueorumfor different altitudes y over the substrate. In this regime, particles are deposited both on and out of charged patterns, but the assembly is significantly denser on the charged patterns.
In these simulations, it can be observed that the convective flow contribution is actually efficient beyond classical electro-static contribution only when Ru is smaller than about 1. However, at the same time, if this ratio is too small, simulations reveal a more uniform deposition similar to what is obtained in classical CSA and the interesting selectivity of nanoxerography is lost.
So far, simulations have shown that the enhancement of assembly by convection is characterized by the dimensionless parameterR u
u
u m
e
≡ | |
| |. As these simulations remain
qualitative-because of the use of an idealizedflow field, 1 μm latex particle assemblies were also carried out by convective nanoxerography at different dragging speeds v ranging from 5 to 80 μm·s−1, with tsc= 0 to isolate the effect of v. Results are presented onFigure 4.
The observation thatρp>ρbgfor the fullν range confirms that charged patterns still act as selective electrostatic traps forming monolayered particle assemblies, even with the existence of the evaporation-induced flow. Both pattern and background densities reach a plateau regime characterized by very low particle capture for speeds larger than 15−20 μm·s−1(region 3 in
Figure 4.Pattern and background particle densities forρb= 6.825× 10⁸ mL−1 as a function of the dragging speed with fluorescent optical microscopy images of corresponding assemblies, (b) example of 4.3μm particle assemblies obtained with optimized parameters using convective nanoxerography
Figure 4). From the measured average evaporation rate of IPA in still air and the geometry of the meniscus, we estimated ue≈ 12
μm/s in these experiments, so this plateau regime corresponds to the Ru> 1 case identified in simulations. Below this threshold,
ρpandρbgboth increase with decreasing dragging speed, also as
expected from simulations. The former increases faster than the latter, indicating a good selectivity of the assembly, for v > 5μm· s−1(region 2 inFigure 4). Finally, for too low dragging speeds (region 1 in Figure 4), the evaporation-induced flow predominance can lead to the deposition of particles outside charged patterns in a way similar to the usual CSA process. In the present example, the case v = 8 μm·s−1 represents the best compromise because selectivity is preserved, the assembly time is reduced by 40% compared to conventional nanoxerography (when the latter works). The experimental observations and the simulation results described above are thus perfectly consistent with each other.
We have demonstrated that, when coupled to nano-xerography, convective effects increase the particle deposition rate for low enough blade velocities, but also decrease the selectivity of the assembly. Convective nanoxerography is thus an efficient technique to assemble micrometer-sized particles for a range of blade velocities depending on the setup geometry, dispersion density, and evaporation rate. Analyses of the effects of the latter two parameters are reported in detail inSupporting Information(Figures S6 and S7). In short, both the pattern and the background densities increase with the particle concen-tration of colloidal dispersion experimentally which is confirmed by simulations. Simulations also demonstrated that the effective diffusion coefficient D increased with concentration. Finally, a working concentration ofρb= 6.825× 10⁸mL−1gives a pattern
particle density high enough (ρp> 5× 104mm−2) with a good
selectivity (S > 0.8). On another hand, the solvent evaporation rate directly increases with the substrate temperature and makes the convectiveflow speed up, which increases the particle flux toward the triple line. In addition, the viscosity of the solvent heated by the substrate diminishes by about 30%, and the particle diffusion coefficient D0increases by about 30%. Both
phenomena facilitate particle displacements to the edge of the meniscus. A working temperature just below 20°C prevents the predominance of convectiveflow effects and allows the analysis of other parameters.
Figure 5presents an example of directed assembly of 1μm latex particles on a large scale using the optimized parameters determined above. It proves that the proposed assembly process is robust, reproducible, and scalable.
Assembly Mechanisms in Convective Nanoxerogra-phy Applied to Larger 4.3 and 10 μm Particles. Experiments were also extended for different sizes of latex
particles (500 nm, 4.3μm, and 10 μm). Results reported in
Supporting Information (Figure S8) confirmed that the
presented technique is efficient to selectively assemble the ones with a diameter smaller than 10μm. Kinetics of 500 nm particles were similar to the ones described for 1μm spheres and showed that around this particle size range, conventional nanoxerography starts to face troubles in making particle assemblies. Dense and selective assemblies of 4.3 μm latex particles were made, thanks to the convective nanoxerography process using optimized parameters similar to the previous ones found for 1μm particles (Movie M1). However, their assembly kinetics varied from 1 μm particles. Indeed, a “constructive” sedimentation phenomenon contributed to the particle displacement toward the charged patterns (vsed (4.3 μm) =
1.31μm·s−1, whereas vsed(1μm) = 0.071 μm·s−1)30and was superimposed to the“constructive convective flow” found in 1 μm particle assembly kinetics. 10 μm particle assemblies were also obtained but it seems to be the upper size limit in the case of our experiments because the effect of sedimentation became predominant along with a large increase of capillary and hydrodynamic forces which tended to decrease selectivity. Such issues might be partially solved by enlarging the dimensions of the charged pattern and upgrading the experimental set up to gain a finer control over solvent evaporation, but particle− substrate attractions will eventually be overcome by the shear-flow induced by the blade displacement for too large particles.
■
CONCLUSIONSThis work aimed to elucidate and overcome the limitation of nanoxerography (i.e., the electrostatic directed assembly of particles on charged patterns on a substrate) for micrometer-sized particles. Numerical simulations and experiments of conventional nanoxerography revealed its two major limits, (i) the need of a well-controlled triple line motion during drying to avoid heterogeneous dewetting, and (ii) the need of a long contact time and of a high osmotic pressure of the colloidal suspension to allow bringing particles in the electrostatic attraction range of charged patterns by collective diffusion. We proposed to couple a blade coating technique to nano-xerography, which immediately solves the first problem and introduces a solvent evaporation-inducedflow bringing particles near the substrate faster than diffusion to remove the second bottleneck. This new“convective nanoxerography” process thus paves the way of new possibilities for the directed assembly of large particles, expanding by a factor 40 at least the size range foreseeable.
■
ASSOCIATED CONTENT*
S Supporting InformationThe Supporting Information is available free of charge on the
ACS Publications websiteat DOI:10.1021/acs.jpcc.8b08981. All the details, extra experiments, and numerical simulations used in this work, full list of used materials, description of the electrical microcontact technique and the convective nanoxerography set up upgraded in this work, assembly results of 1 μm latex particles in conventional nanoxerography, the analysis program employed on optical images for particles counting, the modeling of particle−substrate interaction and the determination of the electrostatic boundary condition, calculations of the collective diffusion and the influence of the static contact time and dragging speed, and assembly
Figure 5.Example of 1μm particle assembly obtained with optimized parameters (ρb= 6.825× 10⁸mL−1, T = 20°C, tsc= 120 s,ν = 40 μm· s−1) using convective nanoxerography.
experiments on the influence of the substrate temper-ature, concentration, and size of particles (PDF) Simulation video 1: Ru=0.5 case (MPG)
Simulation video 2: Ru= 1 case (MPG)
Simulation video 3: Ru= 2 case (MPG)
M1 movie: convective nanoxerography applied to 1μm particles (MPG)
■
AUTHOR INFORMATIONCorresponding Author
*E-mail:[email protected]. Phone: +33(0)5 61 55 96 72. ORCID Yannick Hallez:0000-0001-5172-439X Etienne Palleau:0000-0002-9923-4936 Laurence Ressier:0000-0003-1343-0117 Notes
The authors declare no competingfinancial interest.
■
ACKNOWLEDGMENTSThis work was performed using HPC resources from GENCI-CINES/IDRIS (grant A0040910109) and CALMIP (grant P17001).
■
REFERENCES(1) Zhang, L.; Zhu, Y. Directed Assembly of Janus Particles under High Frequency Ac-Electric Fields: Effects of Medium Conductivity and Colloidal Surface Chemistry. Langmuir 2012, 28, 13201−13207.
(2) Flauraud, V.; Mastrangeli, M.; Bernasconi, G. D.; Butet, J.; Alexander, D. T. L.; Shahrabi, E.; Martin, O. J. F.; Brugger, J. Nanoscale Topographical Control of Capillary Assembly of Nanoparticles. Nat. Nanotechnol. 2016, 12, 73−80.
(3) Ginger, D. S.; Zhang, H.; Mirkin, C. A. The Evolution of Dip-Pen Nanolithography. Angew. Chem., Int. Ed. 2004, 116, 30−46.
(4) Stelling, C.; Mark, A.; Papastavrou, G.; Retsch, M. Showing Particles Their Place: Deterministic Colloid Immobilization by Gold Nanomeshes. Nanoscale 2016, 8, 14556−14564.
(5) Vogel, N.; Retsch, M.; Fustin, C.-A.; del Campo, A.; Jonas, U. Advances in Colloidal Assembly: The Design of Structure and Hierarchy in Two and Three Dimensions. Chem. Rev. 2015, 115, 6265−6311.
(6) Grzelczak, M.; Vermant, J.; Furst, E. M.; Liz-Marzán, L. M. Directed Self-Assembly of Nanoparticles. ACS Nano 2010, 4, 3591− 3605.
(7) Sangeetha, N. M.; Moutet, P.; Lagarde, D.; Sallen, G.; Urbaszek, B.; Marie, X.; Viau, G.; Ressier, L. 3D Assembly of Upconverting NaYF4 Nanocrystals by AFM Nanoxerography: Creation of Anti-Counterfeiting Microtags. Nanoscale 2013, 5, 9587.
(8) Tzeng, S.-D.; Lin, K.-J.; Hu, J.-C.; Chen, L.-J.; Gwo, S. Templated Self-Assembly of Colloidal Nanoparticles Controlled by Electrostatic Nanopatterning on a Si3N4/SiO2/Si Electret. Adv. Mater. 2006, 18, 1147−1151.
(9) Mesquida, P.; Stemmer, A. Attaching Silica Nanoparticles from Suspension onto Surface Charge Patterns Generated by a Conductive Atomic Force Microscope Tip. Adv. Mater. 2001, 13, 1395−1398.
(10) Seemann, L.; Stemmer, A.; Naujoks, N. Local Surface Charges Direct the Deposition of Carbon Nanotubes and Fullerenes into Nanoscale Patterns. Nano Lett. 2007, 7, 3007−3012.
(11) Moutet, P.; Sangeetha, N. M.; Ressier, L.; Vilar-Vidal, N.; Comesaña-Hermo, M.; Ravaine, S.; Vallée, R. A. L.; Gabudean, A. M.; Astilean, S.; Farcau, C. Surface-Enhanced Spectroscopy on Plasmonic Oligomers Assembled by AFM Nanoxerography. Nanoscale 2015, 7, 2009−2022.
(12) Teulon, L.; Palleau, E.; Morales, D.; Poirot, D.; Ressier, L. Interactive Nanogel Marking at the Microscale for Security and Traceability Applications. Adv. Mater. Technol. 2017, 3, 1700244.
(13) Morales, D.; Teulon, L.; Palleau, E.; Alnasser, T.; Ressier, L. Single-Step Binary Electrostatic Directed Assembly of Active Nanogels for Smart Concentration-Dependent Encryption. Langmuir 2018, 34, 1557−1563.
(14) Moutet, P.; Lacroix, L.-M.; Robert, A.; Impéror-Clerc, M.; Viau, G.; Ressier, L. Directed Assembly of Single Colloidal Gold Nanowires by AFM Nanoxerography. Langmuir 2015, 31, 4106−4112.
(15) Fudouzi, H.; Kobayashi, M.; Shinya, N. Site-Controlled Deposition of Microsized Particles Using an Electrostatic Assembly. Adv. Mater. 2002, 14, 1649−1652.
(16) Barry, C. R.; Steward, M. G.; Lwin, N. Z.; Jacobs, H. O. Printing Nanoparticles from the Liquid and Gas Phases Using Nanoxerography. Nanotechnology 2003, 14, 1057−1063.
(17) Jacobs, H. O.; Whitesides, G. M. Submicrometer Patterning of Charge in Thin-Film Electrets. Science 2001, 291, 1763−1766.
(18) Sessler, G. M. Electrets: Recent Developments. J. Electrost. 2001, 51−52, 137−145.
(19) Palleau, E.; Sangeetha, N. M.; Viau, G.; Marty, J.-D.; Ressier, L. Coulomb Force Directed Single and Binary Assembly of Nanoparticles from Aqueous Dispersions by AFM Nanoxerography. ACS Nano 2011, 5, 4228−4235.
(20) Hallez, Y.; Diatta, J.; Meireles, M. Quantitative Assessment of the Accuracy of the Poisson−Boltzmann Cell Model for Salty Suspensions. Langmuir 2014, 30, 6721−6729.
(21) Hallez, Y.; Meireles, M. Modeling the Electrostatics of Hollow Shell Suspensions: Ion Distribution, Pair Interactions, and Many-Body Effects. Langmuir 2016, 32, 10430−10444.
(22) Hallett, J. E.; Gillespie, D. A. J.; Richardson, R. M.; Bartlett, P. Charge Regulation of Nonpolar Colloids. Soft Matter 2018, 14, 331− 343.
(23) Russel, W. B.; Saville, D. A.; Schowalter, W. R. Colloidal Dispersions; Cambridge University Press, 1989.
(24) Bell, G. M.; Levine, S.; McCartney, L. N. Approximate Methods of Determining the Double-Layer Free Energy of Interaction between Two Charged Colloidal Spheres. J. Colloid Interface Sci. 1970, 33, 335− 359.
(25) Malaquin, L.; Kraus, T.; Schmid, H.; Delamarche, E.; Wolf, H. Controlled Particle Placement through Convective and Capillary Assembly. Langmuir 2007, 23, 11513−11521.
(26) Jiang, C.; Li, L.; Pong, P. W. T. Controlled Convective Self-Assembly of Silver Nanoparticles in Volatile Organic Solvent and Its Application in Electronics. RSC Adv. 2015, 5, 98747−98756.
(27) Dimitrov, A. S.; Nagayama, K. Continuous Convective Assembling of Fine Particles into Two-Dimensional Arrays on Solid Surfaces. Langmuir 1996, 12, 1303−1311.
(28) Farcau, C.; Moreira, H.; Viallet, B.; Grisolia, J.; Ressier, L. Tunable Conductive Nanoparticle Wire Arrays Fabricated by Convective Self-Assembly on Nonpatterned Substrates. ACS Nano 2010, 4, 7275−7282.
(29) Goehring, L.; Clegg, W. J.; Routh, A. F. Solidification and Ordering during Directional Drying of a Colloidal Dispersion. Langmuir 2010, 26, 9269−9275.
(30) Meglio, J.-M. D. Colloı̈des et Nanosciences in Techniques de l’Ingénieur, 2007; p 19.
S1
Supporting information
Electrostatic Directed Assembly of Colloidal
Microparticles Assisted by Convective Flow
Lauryanne Teulon
1, Yannick Hallez
2, Simon Raffy
1, François Guerin
1, Etienne Palleau
1and
Laurence Ressier
1,*1
LPCNO, Université de Toulouse, CNRS, INSA, UPS, 135 Avenue de Rangueil, 31077
Toulouse, France
2
Laboratoire de Génie Chimique, Université de Toulouse, CNRS, INPT, UPS, Toulouse,
France
* Author to whom correspondence should be addressed:
[email protected]
/
+33(0)5.61.55.96.72
S2
Materials
Colloidal dispersions of fluorescent carboxylate latex particles with five different
diameters (100 nm, 500 nm, 1 µm, 4.3 µm and 10µm) were purchased from PolyScience
®(Fluoresbrite® YG Carboxylate Microspheres, λem ≈ 486 nm). These negatively charged
particles were chosen as model ones for this study because they exist in a same size assortment
and their fluorescence helps their characterization by optical microscopy. Prior to use, all
solutions were centrifuged at 15000 rpm during 30min in water to remove excess ligands.
Isopropanol (IPA, 99.5%) was then used to dilute particle dispersions for all experiments.
Electrical microcontact printing (e-µCP)
The first step of the nanoxerography protocol was performed by electrical microcontact
printing method (e-µCP) on 100 nm PolyMethylMethAcrylate thin films spin-coated on highly
doped silicon wafers. A magnetic and electrically conductive PolyDiMethySiloxane stamp
featuring patterns of desired geometries was used. Following a previously described protocol
1based on a modified Innostamp 40 equipement, a magnetic pressure was applied owing to a
matrix of magnets carefully positioned under the substrate. It allowed to ensure a homogeneous
and reproducible contact between the PMMA thin film and the patterned stamp even on large
surfaces up to a 4 inch wafer.
2A DC voltage of 40V was applied between the conductive PDMS
stamp and the substrate during 45s. It resulted in the creation of multiple positively charged
snowflakes patterns with a 250 µm width. The choice of such micrometer wide patterns
facilitates the in-situ optical observations and characterization of large latex particles
assemblies, while showing complex details on their branches.
S3
1 µm latex particles assembly by conventional nanoxerography using immersion
development
Conventional nanoxerography protocol including a manual immersion of a charged
sample in a colloidal bath followed by manual withdrawal was used to assemble negatively
charged 1 µm latex particles. A fixed colloidal dispersion concentration of
0 =6.825x10
8mL
-1was used while varying t
scbetween 30s and 5min.
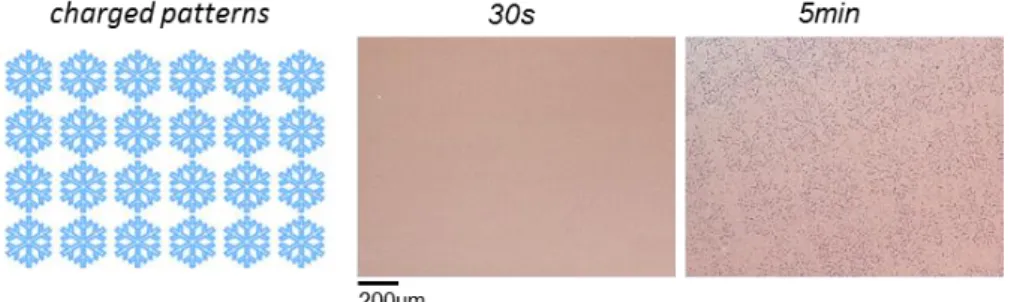
Figure S1. Image of the expected charged patterns given for sake of clarity (left). Optical microscopy
image of 1 µm particle assemblies made with nanoxerography using a static contact time of either 30s (middle) or 5min (right).
No particle assembly was observed for
𝑡
𝑠𝑐= 30𝑠 while some particle assembly, with poor
density and selectivity, was obtained for
𝑡
𝑠𝑐= 300𝑠 and a slow manual withdrawal of the
substrate. These experiments also reveal that the way the solvent evaporates during 𝑡
𝑑𝑐strongly
affects the particle assembly. A natural (non-controlled) evaporation of the solvent indeed leads
to a seemingly random dewetting of the substrate and to the creation of several dispersion
droplets. Evaporation of the latter generates particle aggregates at locations independent of the
presence of charged patterns.
Convective nanoxerography set up
A homemade CSA deposition system was used to drag a drop of colloidal dispersion
using a glass blade inclined at an angle of 20° at 200-300 µm above the horizontal substrate
fixed to a temperature-regulated copper plate (see Scheme 1 of the paper). Temperature
regulation was controlled from 17°C to 25°C. A 10-15 µL particle dispersion drop was injected
between the blade and the substrate. The meniscus formed by the colloidal dispersion over the
substrate was put in translational motion by dragging the stage under the substrate at dragging
speeds ranging from 5 to 100 µm.s
-1. All experiments were performed in ambient air, at room
S4
temperature (20°C), and a relative humidity RH 40%. The setup was mounted under anoptical
microscope to allow real-time observations.
A syringe pump system was used to balance the solvent evaporation during the static contact
time analysis. First, the 10-15 µL drop of the particle dispersion was deposited between the
glass blade and the charged substrate. Then the syringe pump system was used to have a
continuous supply of solvent (IPA). The whole system was set to locate the needle below the
glass slide at the back of the dispersion drop. An IPA flow rate of 1.11 µL/min was fixed thanks
to empirical determination of the pure solvent evaporation rate. The pumping system was turned
on during the whole static contact period of time, the needle was removed at the end of it and
the stage was translated to go on the convective flow development with parameters depending
on the final aim.
Matlab image analysis program
To determine the particle density on a snowflake pattern while assembling 1 µm latex
particles, a homemade Matlab
®program was used to analyze fluorescent optical microscopy
images. From these optical images, four particle based snowflake patterns were observed by
sample to evaluate the reproducibility of the process.
The pictures used in the analysis program were taken by a microscope under fluorescent
conditions equipped with a 20x (while observing particles on patterns) and 50x (while
observing particles out of patterns) magnitude. To start the analysis, the blue matrix of the RGB
8 bits microscopic picture (0 to 255) is extracted. To select the particles on the snowflake
pattern, the blue image is multiplied by a logical image L1 of the snowflake pattern: the value
1 if on, and 0 if out of patterns: everything out of the pattern is consequently considered to be
zero. A logical condition is applied to the image with a threshold T1 fixed at a level
corresponding to half the maximum level of the image in order to separate particles and particle
clusters from the background. A new small matrix is created for each separated object (single
particles or particle clusters). All these small matrices are then multiplied by the corresponding
part of the blue matrix (Figures S2.a-b).
For each small matrix, an iteration is used from the level corresponding to half of the maximum
level of the blue matrix up to the maximum one. Each iteration value leads to a threshold T2 to
get various logical images. The average coordinates x and y are calculated from all 1 values of
S5
all logical images. With those data, statistical centers or centroids of the objects/particles are
obtained (see red cross on Figure S2a&b). A profile is created with the blue matrix levels as a
function of the length of each pixel to these centroids (Figures S2.c-d).
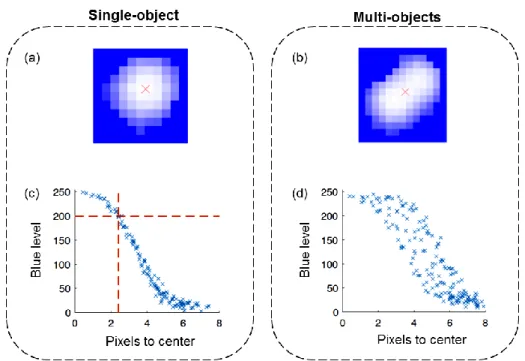
After the analysis treatment, a single particle has a near-Gaussian profile (see Figure S2.c)
while other objects (two particles or more) have hysteresis like profiles (see Figure S2.d). By
derivating such profiles, single particles from multiple ones are separated.
Figure S2. Image analysis for (a,c) single object (b,d) multi-objects. (a,b) Numerical images created for
the analysis. The red crosses are the positions of the calculated centers. The solid blue is the threshold (where logical images = 0). The interne color variations are the corresponding part of the blue matrix. (c,d) Profiles of the particles: blue level as a function of the length of each pixel to the center.
The comparison of the real radius of one particle (converted in pixels) with a single particle
profile gives a specific blue level, further used as a threshold T3. This comparison is done for
each single particle detected on the full image.
The average value of all T3 thresholds gives a threshold T4 applied on each object (single or
multiple particles) to shape them to their physical dimensions converted to specific pixel areas.
These pixel areas are divided by the real physical cross-section of a particle (converted in
pixels
2) to get a normalized number of particles for each object (Nb).
Due to the fluorescent overlapping when considering particle clusters, the image treatment
detailed above results in the addition of extra pixels (an extra artefact surface S) at the interfaces
between particles that virtually increase the number of pixels in the case of complex objects
S6
(two or more particle based clusters). To find the correct number of particles (Nb
cor), a logistic
map is applied to all Nb (equation 1).
𝑁𝑏
𝑐𝑜𝑟= 𝑁𝑏 − 2 ∗ 𝛼 ∗ (𝑁𝑏 − 1)
Where α is the corrective factor (between 0 and 0.2) corresponding to S. α is adjusted to get the
best fit with the integer number of particles by objects (Figure S3).
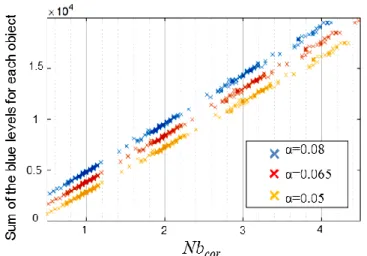
Figure S3. Sum of the blue levels of each object as function of Nbcor in the case of an assembly of 1 µm
particles (dragging speed 8µm.s-1, t
tc = 275s, concentration = 30/2). Blue and yellow set of points have
respectively an ordinate offset +103 and -103 for sake of clarity.
The number of particles on each snowflake pattern is given by the sum Σ Nb
cor. The Nb
corfor α
= 0,065 gives the best fit for the objects from 1 to 4 particles (Figure S3).
It is worth noting that, since α is manually defined, it induces some errors that have to be taken
into account. These errors calculated for all images, vary from 1 to 9%.
The sum of all pixels of a logical image L1 gives a pattern area with pixel
2as unit. To get the
final particle density, the number of particles is divided by the surface of the corresponding
snowflake pattern. With the magnitude of the microscope, the unit is converted from
particle/pixel² to particle/mm
2.
S7
Determination of the electrostatic boundary condition on 1µm latex particles in
isopropanol
The electrophoretic mobility of 1µm latex particles in isopropanol was measured with a
Zeta Potential Particle Analyzer (Beckman Coulter) for a wide range of particle volume fraction
10
−5< 𝜙 < 10
−2(Figure S4). Data were an average of 5 measurements with 30s acquisition
times. The samples were allowed to equilibrate thermally at the desired temperature for 5min
before the measurements. Electrophoretic mobility was calculated using the Laser Doppler
Method. In this system, the mobility decreases with volume fraction even in relatively dilute
conditions due to the presence of long-range interactions. This behavior is dependent on the
balance between hydrodynamic and electrostatic forces, the latter depending on the electrostatic
boundary condition (BC) on the surface of particles. These BC can thus be deduced from the
fitting of experimental data with an adequate model. Here we used an expression developed by
Ohshima with a cell model.
3This expression, valid in the context of the linearized Debye
Hückel theory for electrostatics, reads
𝜇 =
2𝜖𝜁
3𝜂
∫ 𝐻(𝑟) (1 +
𝑎
32𝑟
3) 𝑑𝑟 +
2𝜖(𝜅𝑎)
29𝜂(1 − 𝜙)
𝜓
(0)(𝑏) (1 +
𝑎
32𝑏
3)
𝑏 𝑎(1 +
𝑏
3𝑎
3−
9𝑏
25𝑎
2−
𝑎
35𝑏
3),
where
𝐻(𝑟) = −
(𝜅𝑎)
26𝜁(1 − 𝜙)
[1 −
3𝑟
2𝑎
2+
2𝑟
3𝑎
3−
𝑎
3𝑏
3(
2
5
−
𝑟
3𝑎
3+
3𝑟
55𝑎
5)]
𝑑𝜓
0𝑑𝑟
(2)
and 𝑎 is the particle radius, 𝑏 = 𝑎𝜙
− 13
is the radius of the cell, 𝜖 is the solvent dielectric constant
and
𝜂 its dynamic viscosity, 𝜁 is the particle effective surface potential, 𝜅
−1is the effective
screening length, and 𝜓
(0)is the (unscaled) electrostatic potential field in the cell model. This
expression has then been fitted to the experimental mobility data by adjusting
𝜅 and 𝜁. The
consistence between theoretical and experimental data for constant values of these parameters
(𝜅𝑎 = 0.05 and 𝜁 = 0.086 𝑉) indicate that a constant effective surface potential is pertinent for
the present experimental system. This kind of behavior has already been reported in literature
for functionalized PMMA/PHSA particles dispersed in dodecane and corresponds to a charge
regulation mechanism (see
4and references therein). Interestingly, the range of electrostatic
interactions is measured to be of the order of 10µm in the present system, which corresponds
to 10 particle diameters. This explains why the particle collective diffusion coefficient is very
large compared to the Stokes-Einstein value even in what would seem dilute conditions (volume
fraction less than 0.26%).
S8
Figure S4. Electrophoretic mobility variation as a function of the volume fraction for 1µm latex
particles. Experimental data: blue symbols; Model: red curve. The vertical dashed lines indicate the range of volume fractions corresponding to the range of bulk particle concentrations 𝐶𝑏 investigated in the article (𝐶0/5 < 𝐶𝑏< 2𝐶0).
Particle-substrate electrostatic force modelling
A model for the particle-substrate electrostatic force is required to solve the transport
equation in the first regime. This regime corresponds to the capture of particles above the
substrate at a distance smaller than about one or two Debye lengths. Unfortunately, classical
DLVO-type force models are in principle valid for separation distances larger than that. To
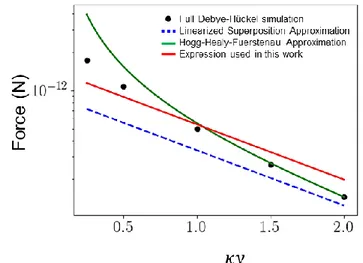
determine which model can be used in the transport equation, we performed full 3D
Debye-Hückel simulations of one particle above a charged plate and measured the interaction force for
the physico-chemical conditions used in the many-body simulations. The results are reported
in Fig. S5 as a function of the separation distance
𝑦 scaled by the Debye length. The linear
superposition approximation (LSA)
4𝐹
𝐿𝑆𝐴= −𝜖 (
𝑘𝑇
𝑒
)
2
4𝜋𝜅𝑎 𝜓
𝑠𝜓
𝑝𝑒
−𝜅(𝑦−𝑎)(3)
underestimates the interaction force for all the distances investigated. This was expected as this
is a result derived in the limit of weakly overlapping double layers. The Hogg, Healy &
Fuerstenau (HHF) approximation
5𝐹
𝐻𝐻𝐹= −𝜖 (
𝑘𝑇
𝑒
)
22𝜋 𝜅𝑎
2𝜓
𝑠𝜓
𝑝𝑒
−𝜅(𝑦−𝑎)− (𝜓
𝑠2+ 𝜓
𝑝2)𝑒
−2𝜅(𝑦−𝑎)1 − 𝑒
−2𝜅(𝑦−𝑎)(4)
S9
is in better agreement with simulations. It recovers numerical results perfectly as soon as 𝜅𝑦 >
1. Solving the transport equation with this full equation is however difficult. In order to have a
tractable equation, we used the force model 𝐹 = 𝛼𝐹
𝐿𝑆𝐴shown in red in Figure S5. The LSA
force form (which is the same as the large distance HHF force) makes the transport equation
tractable, but it has to be modified with the factor 𝛼 = 1.6 here to have a reasonable agreement
with the simulations for the distances 𝜅𝑦 < 2 of interest in the first capture phase.
Figure S5. Particle-substrate electrostatic force as a function of distance for an isolated particle. The
parameters are those used in the article. Black symbols: full Debye-Hückel simulation of one particle and a charged wall; Green curve: Derjaguin approximation (1); Blue dashed line: Linearized Superposition Approximation (2); Red line: expression used in this article (3).
Collective diffusion coefficient calculations
The value of the collective diffusion coefficient can be calculated with the generalized
Stokes-Einstein relation 𝐷 = 𝐷
0𝑓/𝜒 where 𝑓 is the sedimentation hindrance function and 𝜒 is
the osmotic compressibility. For the hydrodynamically dilute dispersions considered here 𝑓 ≈
1. As the mean surface to surface distance between particles in the bulk is at most 𝑙
𝑠−𝑠≈
𝑑 (𝜙
− 13
− 1) = 1.7𝑙
𝐷in the simulations presented here, with 𝜙 the volume fraction, electric
double layers interact everywhere and the osmotic compressibility can be calculated accurately
with the cell model
6,7. For the system considered in Figure 2b, we obtain 𝐷 ∈ [220𝐷
S10
Influence of the particle concentration
Figure S6 shows the 1µm normalized pattern and background particle densities of
assemblies made by convective nanoxerography at different concentrations from
0/5 to 2
0where
0=6.825x10
8mL
-1. The static contact time was set to 0, with a dragging speed at 8µm.s
-1leading to 𝑡
𝑡𝑐
= 275s.
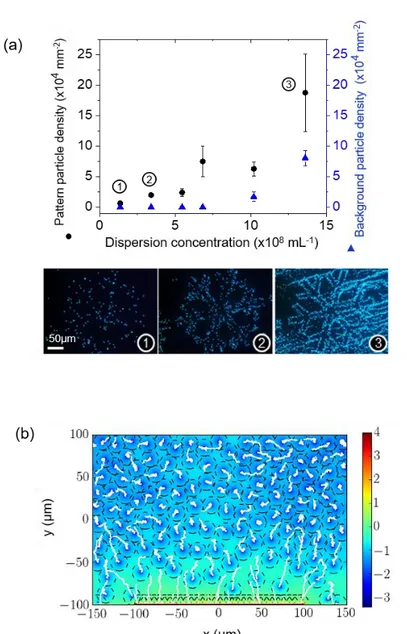
Figure S6. (a) Pattern and background particle densities as a function of the dispersion concentration
for 1µm latex particles with fluorescent optical microscopy images of numbered assemblies, (b) Numerical simulations of particles trajectories above the charged pattern. The electrostatic potential field is the one obtained for the final simulation time. The bulk particle density is 𝜌𝑏= 1.37 × 10⁹ 𝑚𝐿−1
Both densities are increasing with the dispersion concentration, a conclusion that has also been
reported in the case of smaller particles assembled by nanoxerography.
8Indeed, by extending
the number of particles in the dispersion drop, the probability to locate some of them close
S11
enough to the charged pattern to induce electrostatic attraction and the convective flux density
𝜌𝑢 are both increased linearly. The numerical simulation configuration with a high number of
particles presented on Figure S6b shows that particle screening lengths are recovering from
one particle to another at such concentration which makes the effective diffusion coefficient D
increase by coulombic repulsions. The negatively charged particles quickly deposited onto the
charged pattern, by electrostatic attraction in the area 𝑦 < 𝑙
𝐷, do not screen the electric potential
generated by the positive patterns which allows the deposition of additional particles and the
pattern particle density increase by carrying on the development.
Finally, a working concentration of
b= 6.825x10
8Ps/mL gives a pattern particle density high
enough with a good selectivity.
Influence of the substrate temperature
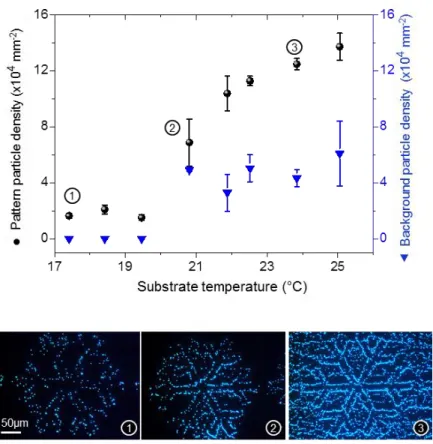
An analysis of the influence of the substrate temperature on 1µm particles assemblies has also
been done. Results are shown in Figure S7.
Pattern and background particle densities increase with the substrate temperature from a
threshold T
th= 20°C. By using real-time optical microscopy recordings, one can see that the
convective flow rate speeds up for temperatures higher than T
th. The solvent evaporation rate
increases with the temperature difference between the top of the drop, corresponding to the
room temperature, and the edge of the drop,
9the temperature of the heated substrate. For the
range of temperatures investigated (17 to 25°C), the vapor pressure increases roughly by a
factor two. Consequently, the solvent evaporation rate directly increases with the substrate
temperature and makes the convective flow speed up, which increases the particle flux towards
the triple line. In addition, the viscosity of the solvent heated by the substrate diminishes by
about 30%, and the particle diffusion coefficient 𝐷
0increases by about 30%. Both phenomena
facilitate particle displacements to the edge of the meniscus. A working temperature just below
T
thprevents the predominance of convective flow effects and allows the analysis of other
S12
Figure S7. 1 µm latex particle pattern and background densities as a function of the stage temperature
and fluorescent optical microscopy images of numbered assemblies.
Initial contact time influence on the convective flow assembly of 500nm and 4.3µm
The initial contact time influence on the assembly of 500 nm and 4.3 µm latex particles
assembled by a convective flow development method was analyzed as for the 1µm particles.
Figures S8 and S9 present the corresponding results.
The experimental curve for the 500 nm particles was fitted with a function
𝑓(𝑡) = 𝐴𝑡𝑏, where
𝐴 =3220 ± 179 𝑃𝑠. 𝑚𝑚−2
and
𝑏 =0.40 ± 0.01. The shape of the fitting curve is close to a
~ √𝑡function pointing out a diffusion mechanism.
Fitting correctly a
~ √𝑡function was not possible for the 4.3µm particles
.It might be because
of the
sedimentation phenomenon involved in their assembly. Indeed, their sedimentation speed
is about 18 times higher than that of 1 µm particles. In addition, 4.3µm particles are more likely
to roll on the substrate surface to move towards or away from charged patterns due to
electrostatic or hydrodynamic forces.
S13
Figure S8. Pattern particle density as a function of the static contact time tsc before the 500 nm latex
dispersion drop dragging and fluorescent optical microscopy images of numbered assemblies.
Figure S9. Pattern particle density as a function of the static contact time tsc with a dragging speed of