HAL Id: hal-03026278
https://hal.archives-ouvertes.fr/hal-03026278
Submitted on 20 Apr 2021
HAL is a multi-disciplinary open access
archive for the deposit and dissemination of
sci-entific research documents, whether they are
pub-lished or not. The documents may come from
teaching and research institutions in France or
abroad, or from public or private research centers.
L’archive ouverte pluridisciplinaire HAL, est
destinée au dépôt et à la diffusion de documents
scientifiques de niveau recherche, publiés ou non,
émanant des établissements d’enseignement et de
recherche français ou étrangers, des laboratoires
publics ou privés.
Continuity of Ice Sheet Mass Loss in Greenland and
Antarctica From the GRACE and GRACE Follow-On
Missions
Isabella Velicogna, Yara Mohajerani, Geruo A, Felix Landerer, Jeremie
Mouginot, Brice Noel, Eric Rignot, Tyler Sutterley, Michiel Broeke, Melchior
Wessem, et al.
To cite this version:
Isabella Velicogna, Yara Mohajerani, Geruo A, Felix Landerer, Jeremie Mouginot, et al.. Continuity of
Ice Sheet Mass Loss in Greenland and Antarctica From the GRACE and GRACE Follow-On Missions.
Geophysical Research Letters, American Geophysical Union, 2020, 47 (8), �10.1029/2020GL087291�.
�hal-03026278�
Follow-On Missions
Isabella Velicogna1,2 , Yara Mohajerani1 , Geruo A1 , Felix Landerer2 ,
Jeremie Mouginot1,3 , Brice Noel4 , Eric Rignot1,2 , Tyler Sutterley5 ,
Michiel van den Broeke3,4 , Melchior van Wessem4 , and David Wiese2
1Department of Earth System Science, University of California, Irvine, CA, USA,2Jet Propulsion Laboratory, Pasadena,
CA, USA,3University of Grenoble Alpes, CNRS, IRD, Grenoble INP, IGE, Grenoble, France,4Institute for Marine and
Atmospheric Research Utrecht, Utrecht University, Utrecht, The Netherlands,5Polar Science Center, Applied Physics Laboratory, University of Washington, Seattle, WA, USA
Abstract
We examine data continuity between the Gravity Recovery and Climate Experiment (GRACE) and GRACE Follow-On (FO) missions over Greenland and Antarctica using independent data from the mass budget method, which calculates the difference between ice sheet surface mass balance and ice discharge at the periphery. For both ice sheets, we find consistent GRACE/GRACE-FO time series across the data gap, at the continental and regional scales, and the data gap is confidently filled with mass budget method data. In Greenland, the GRACE-FO data reveal an exceptional summer loss of 600 Gt in 2019 following two cold summers. In Antarctica, ongoing high mass losses in the Amundsen Sea Embayment of West Antarctica, the Antarctic Peninsula, and Wilkes Land in East Antarctica cumulate to 2130, 560, and 370 Gt, respectively, since 2002. A cumulative mass gain of 980 Gt in Queen Maud Land since 2009, however, led to a pause in the acceleration in mass loss from Antarctica after 2016.1. Introduction
The Gravity Recovery and Climate Experiment (GRACE), a pair of co-orbiting twin satellites linked with a microwave ranging instrument, has provided invaluable insights into changes in ice and water around the globe by monitoring the small temporal fluctuations in the Earth's gravity field (Tapley et al., 2019). In particular, GRACE data allowed the scientific community to directly and comprehensively evaluate the mass balance of the Earth's ice sheets, glaciers, and ice caps on a monthly basis for the first time (Gardner et al., 2013; Jacob et al., 2012; Shepherd et al., 2018, 2019; Shepherd et al., 2012; Velicogna et al., 2014; Velicogna & Wahr, 2006). These studies revealed mass loss in Greenland and Antarctica, an acceleration in ice sheet mass loss over the duration of the GRACE mission, and a major revision of the mass loss of glaciers and ice caps traditionally reconstructed from incomplete and sparse data. The GRACE mission captured interannual changes in mass loss, seasonal changes, and more rapid events. The goal of the GRACE Follow-On (FO) mission is to extend the data record in time to separate long-term trends from the natural variability of the system, document the ongoing acceleration in mass loss and its impacts on sea level change, and better inform climate and ice sheet models.
The GRACE mission lasted for 15 yr from its launch on 17 March 2002 until its retirement due to bat-tery problems on 12 October 2017. To continue the time series of measurements, the GRACE-FO mission was launched on 22 May 2018 from Vandenberg Air Force Base (Tapley et al., 2019). In the early stages of the GRACE-FO mission, it is essential to verify data quality, calibration, and continuity of the GRACE and GRACE-FO missions. Instruments built 15 yr apart with different hardware may not perform in an identi-cal way. Since the two missions did not overlap in time, we use independent observations to detect potential bias in the gravity solutions and discontinuity due to a few particular circumstances. During the late stages of the GRACE mission, efforts were enacted to preserve the battery life of the GRACE satellites to extend the mission lifetime. The accelerometer onboard GRACE-B was turned off in September 2016 to maintain the operation of the microwave ranging instrument. Processing centers developed independent methods for spatiotemporally transplanting the accelerometer data retrieved from the two GRACE satellites (Bandikova
Key Points:
• We demonstrate data continuity of the GRACE and GRACE-FO missions over Greenland and Antarctica using independent data • GRACE-FO data capture a
record-high summer loss (600 Gt) in Greenland in 2019
• Mass gain in Queen Maud Land mitigate high losses in the Amundsen Sea, Peninsula, and Wilkes Land to pause the acceleration in mass loss
Correspondence to:
I. Velicogna, isabella@uci.edu
Citation:
Velicogna, I., Mohajerani, Y., A, G., Landerer, F., Mouginot, J., Noel, B., et al. (2020). Continuity of ice sheet mass loss in Greenland and Antarctica from the GRACE and GRACE Follow-On missions. Geophysical Research Letters, 47, e2020GL087291. https://doi.org/10.1029/2020GL087291
Received 28 JAN 2020 Accepted 21 FEB 2020
©2020. American Geophysical Union. All Rights Reserved.
Geophysical Research Letters
10.1029/2020GL087291
et al., 2019). While both accelerometers on GRACE-FO are operating and collecting observations, shortly after the launch an anomaly onboard one of the two GRACE-FO satellites, GRACE-FO 2 or GF2, resulted in degraded performance in the accelerometer measuring nongravitational accelerations. For this reason, at present, the GRACE-FO 1 or GF1 accelerometer data are used to generate accelerometer transplant data to substitute the GF2 measurements. Unfortunately, these single-accelerometer months for both GRACE and GRACE-FO missions contain more noise. It is important to understand the effect of this noise on the quality of the gravity data and data continuity between the missions.
In this work, we examine the data continuity of GRACE and GRACE-FO time-variable gravity missions over the Antarctic and Greenland Ice Sheets using independent mass budget method (MBM) data that combine surface mass balance (SMB) output products from the Regional Atmospheric Climate Model (RACMO2.3) with grounding line discharge from a continuous monitoring of glacier speed and ice thickness. We also examine the differences between data products from various processing centers, the effect of various har-monic corrections, and the components of mass balance of Greenland and Antarctica. We conclude by noting important features of the mass balance record combining GRACE and GRACE-FO missions in Greenland and Antarctica during the period April 2002 to September 2019, a 17.4 yr period.
2. Data and Methods
Here, we use Release-6 of the Level-2 spherical harmonic solutions provided by the Center for Space Research (CSR) at the University of Texas at Austin, the Jet Propulsion Laboratory (JPL), and the German Research Centre for Geosciences (GFZ) that are provided to degree 60, order 60 harmonics for both GRACE and GRACE-FO missions. Changes in geocenter, that is, relative change between the center of mass and geometric center of the Earth ellipsoid, are not captured by GRACE or GRACE-FO.
In order to include the degree-1 geocenter terms, we follow the methodology of Sutterley and Velicogna (2019), a self-consistent geocenter technique that includes self-attraction and loading effects. This allows a consistent processing of spherical harmonic fields (same C20, C30, Glacial Isostatic Adjustment (GIA), and love numbers), a higher degree truncation that has greater levels of agreement with our test synthet-ics, and consistently buffered land-sea mask for geocenter calculation and sea level estimate (Sutterley & Velicogna, 2019). The degree-1 coefficients are recalculated consistently for each GRACE/GRACE-FO solution. Low-degree zonal harmonics, which carry a significant fraction of the gravity data, have a dispro-portionately large effect on Antarctic Ice Sheet mass balance estimates due to its position on the southern pole and its spatial area. The low-degree zonal harmonics derived from GRACE/GRACE-FO data are sensitive to processing strategies during the single-accelerometer months.
Efforts have been made to evaluate and improve the quality of the GRACE/GRACE-FO solution during the single-accelerometer months, for example, the C3,0harmonic time series derived from Satellite Laser Ranging provided by the Goddard Space Flight Center (GSFC) as a part of the GRACE TN-14 auxiliary data (Loomis et al., 2019). Here, we use the GSFC C3,0product. We also evaluated the quality of the C4,0and
C5,0harmonics and found that the GRACE/GRACE-FO harmonics have a satisfactory quality. Replacing
C2,0has been a standard procedure for time-variable gravity analyses since early in the GRACE mission due
to issues with the GRACE degree-2 zonal harmonic and sensitivity to tidal aliasing (Cheng & Ries, 2017). The National Aeronautics and Space Administration GSFC provides a new C2,0harmonic solution as part
of the GRACE TN-14 auxiliary data set that uses a time-variable gravity background model derived from GRACE in the forward modeling of the Satellite Laser Ranging solution (Loomis et al., 2019). The previous standard oblateness solution provided as part of the GRACE TN-07 and TN-11 auxiliary data sets used a fixed background model as described in Cheng and Ries (2017). Here, we use the project recommended GSFC C2,0product.
All harmonics are smoothed with a 250 km radius Gaussian smoothing function (Velicogna et al., 2014). We correct the GRACE data for the long-term trend of GIA from the solid earth. We use the regional IJ05 R2 GIA model (Ivins et al., 2013) over Antarctica and the regional Simpson et al. (2009) GIA model over Greenland. These regional GIA models have been developed to match a variety of geologic, glaciological, and geodetic observations over the ice sheets but do not include realistic GIA signal outside the ice sheets. Outside of Greenland and Antarctica, we therefore use A et al. (2013) with ICE6G ice history (Peltier et al., 2015). Ice mass time series are calculated using the least squares mascon approach following Velicogna et al. (2014). The uncertainty in mass balance estimates combines GRACE/GRACE-FO measurement errors, errors in
the GIA correction, mascon-fit error, and leakage errors due to ocean mass including self-attraction and loading effects.
To compare the performance of GRACE-FO and assess potential biases, we use independent data from the MBM, which calculates the difference between SMB and mass discharge along the periphery. Grounding line ice discharge from Rignot et al. (2019) and Mouginot et al. (2019) are updated to August 2019 using the latest velocities and SMB data. The ice velocities include new measurements from the European Union's Copernicus Sentinel-1ab SAR satellites, Sentinel-2, and the USGS Landsat-8. Ice thickness is the same as in Rignot et al. (2019) for Antarctica and updated for changes in surface elevation as in Mouginot et al. (2019) for Greenland. The data record is updated at the monthly scale for both ice sheets. SMB is RACMO2.3p2 for West Antarctica and the Antarctic Peninsula (van Wessem et al., 2018; Van Wessem et al., 2014), and RACMO2.3p1 in East Antarctica until 2016 and complemented by a scaled version of RACMO2.3p2 after 2016 as in (Rignot et al., 2019). In Greenland, we use RACMO2.3p2 (Noël et al., 2018; Shepherd et al., 2019). We include all peripheral glaciers and ice caps. RACMO2.3p2 is generated at 5.5 km resolution and inter-polated to 1 km in the Antarctic Peninsula, 11 km resolution downscaled to 1 km in Greenland, and 27 km resolution in continental Antarctica interpolated to 1 km. We previously reported an excellent agreement between the MBM and GRACE data at the regional scale in Antarctica in key regions ranging from no loss to medium and high loss (Mohajerani et al., 2018, 2019; Velicogna et al., 2014).
As we aim for seamless interpolation between the two GRACE missions, small adjustments in trend, dM/dt (where M is the mass and t is time) are applied to the MBM data to match that from the GRACE data. The time series display the relative ice mass, M(t), which has an arbitrary reference value, here chosen to be the mean over the GRACE time period. We compare the overall trends, dM/dt, between GRACE and MBM during the GRACE period. This offset results from uncertainties in the GIA correction in the GRACE data (constant dM/dt), and uncertainties in absolute ice discharge and absolute SMB in the MBM data (another constant dM/dt). We adjust the MBM time series with this offset and compare the adjusted MBM data with GRACE and GRACE-FO data.
The monthly discharge rates for each glacier basin are spatially distributed throughout the basins at each time step. We weight the distribution of mass loss by flux density, that is, the product of ice velocity and ice thickness, to a power exponent of 0.6. We tested how well MBM could match GRACE with different power exponent, 1 drawing too much loss along the coast, 0.1 yielding too much loss in the interior, and 0.6 bringing the two times series in near balance. An exponent of 0.6 indicates that the impact of coastal changes is felt far inland of the grounding line. The reference velocity is the 2017–2018 mosaic (Mouginot et al., 2019; Rignot & Mouginot, 2012). Ice thickness is from BedMachine Antarctica (Morlighem et al., 2019) and BedMachine Greenland (Morlighem et al., 2017). The monthly mass balance is the difference between SMB and discharge at each grid point. Note that there is no need for a reference time period in the calculation of the total mass loss. The error estimates of the MBM time series are calculated following (Mouginot et al., 2019) and (Rignot et al., 2019). As the difference in spatial resolution and characteristics of the MBM and GRACE data may lead to systematic biases in regional comparisons, we regrid the 1 km MBM field on a half-degree grid and convert each month to the harmonic domain. Following the resolution of GRACE data, we truncate the MBM harmonics at degree 60 and order 60, perform Gaussian smoothing with a radius of 250 km, and repeat the mascon fitting procedure with the resulting harmonics.
3. Results
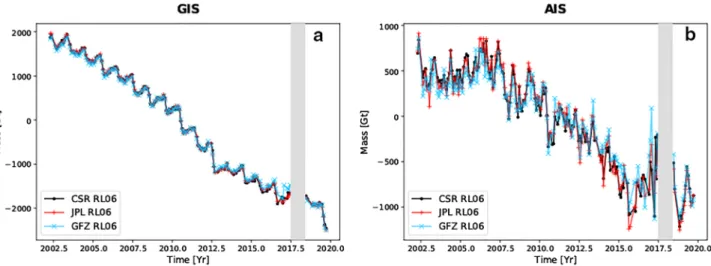
We compare the GRACE solutions from JPL, CSR, and GFZ over Greenland and Antarctica (Figure 1). The average mass loss values in Greenland over the extended time period (April 2002 to September 2019) agree well, with 261 ± 43 Gt/yr for CSR, 261 ± 45 Gt/yr for JPL, and 254 ± 47 Gt/yr for GFZ. For Antarctica, the average mass loss values are 107 ± 55 Gt/yr for CSR, 104 ± 57 Gt/yr for JPL, and 89 ± 60 Gt/yr for GFZ. Over that time period, the acceleration in mass loss in Greenland is not significant. In Antarctica, the acceleration in mass loss for the entire analyzed period ranges from 6.3 ± 3.3 Gt/yr2for CSR, 9.1 ± 3.4 Gt/yr2for JPL and
8.1 ± 3.3 Gt/yr2for GFZ. We note a higher data noise, especially in the Antarctic time series, at the end of
the GRACE mission and the beginning of the GRACE-FO mission, as explained earlier. The GFZ time series have more data noise than the time series from the other centers. In the remainder of the paper, we only use the JPL solutions for GRACE and GRACE-FO.
Geophysical Research Letters
10.1029/2020GL087291
Figure 1. Comparison of GRACE/GRACE-FO time series from different processing centers (CSR = Center for Space Research at the University of Texas at
Austin, USA; JPL = Jet Propulsion Laboratory, Pasadena, CA, USA; GFZ = German Research Centre for Geosciences, Germany) in (a) Greenland and (b) Antarctica with data gap in gray vertical bar and mass numbers in gigatons (109t = 1012kg).
In Greenland, the time series of mass balance values from GRACE/GRACE-FO line up well across the data gap from mid-2017 to mid-2018. Data continuity is most dramatically illustrated with the addition of MBM time series across the winter season of 2018 (Figure 2). The adjustments in trend, dM/dt, between GRACE and MBM are small: −14 (NW), 7 (NN), 7 (NE), 2 (SE), −16 (SW) Gt/yr and −17 Gt/yr for the entire ice sheet. If we compare the adjusted MBM and GRACE/GRACE-FO monthly time series over the entire study period, they agree within ±2% of the total signal. We find no significant difference in data noise between GRACE and GRACE-FO data.
In the summer of 2019, we note a mass loss of 600 Gt by the end of August 2019, which is comparable to the mass loss in the warm summer of 2012 (650 Gt peak to peak) (Hanna et al., 2014). The high summer loss is reflected in all regions of Greenland, but particularly in the North and Northeast with a mass loss of 80 Gt versus a reference balance SMB for the years 1961–1990 in the range of 22 to 25 Gt (Mouginot et al., 2019). The mass losses in NW, SW, and SE were about 100 Gt, but the reference SMBs in these regions are higher. Data noise across the gap is strongest in Northeast Greenland. Overall, the mass loss accelerated over the time period 2002–2012 but experienced a pause in acceleration after 2012. In 2017–2018, the mass loss decreased the most, in response to higher SMB values caused by cold summers, but ice discharge continued to increase the entire time (Mouginot et al., 2019) and the SMB was low again in 2019.
Over the entire GRACE/GRACE-FO period (April 2002 to September 2019), or 17.4 yr, the acceleration in mass loss is not significant. The mass loss cumulates to 4,550 Gt (261 ± 45 Gt/yr) with approximately 610 Gt from the north, 160 Gt in the northeast, 1,540 Gt in the southeast, 660 Gt in the southwest, and 1,580 Gt from the northwest. As fraction of the reference SMB values for 1961–1990, these quantities represent 62% of the reference SMB (422 Gt/yr in Mouginot et al., 2019) for Greenland, 140% in the north (25 Gt/yr reference SMB), 42% in the northeast (22 Gt/yr reference), 68% in the southeast (131 Gt/yr reference), 64% in the southwest (59 Gt/yr reference), and 65% in the northwest (140 Gt/yr reference). The entire ice sheet has been losing mass during that time period. The acceleration in mass loss was most pronounced in NW, SW, and SE (Figure 2).
In Antarctica, the comparison of the GRACE/GRACE-FO time series with MBM illustrates that the GRACE and GRACE-FO line up well across the data gap and the MBM offers the possibility to fill the gap between the missions (Figure 3). The adjustments in trend dM/dt between GRACE and MBM are small: −27 (QML), −9 (APIS), −2 (CpDc), −2 (GH3), −14 (DDpi), and 50 Gt/yr for the ice sheet including uncertainties in GIA correction. Over the study period, the adjusted MBM and GRACE/GRACE-FO monthly time series agree within ±12% of the total signal. The agreement is less than in Greenland but the temporal variability of the signal is larger and the total signal is lower. Following a period of relatively low loss in 2002–2006, the mass loss increased rapidly until 2016 when the ice sheet gained mass overall before returning to a mass loss in 2017. In total, the ice sheet lost 1,810 Gt of ice during the entire period, or 104 ± 57 Gt/yr.
Figure 2. Comparison of GRACE/GRACE-FO time series of mass change using the JPL fields (blue) versus the adjusted mass budget method (MBM) (red) for
(a) Greenland Ice Sheet, (b) North (N) Greenland, (c) distribution of mascons used to infer regional and island-wide mass changes. (d) Northwest (NW) Greenland, (f) Northeast (NE) Greenland, (g) Southwest (SW) Greenland, and (j) Southeast Greenland in gigatons (109t = 1012kg), along with map of
(e) average mass loss in centimeter of water per year and (h) acceleration in mass loss in centimeter of water per year squared.
In the Antarctic Peninsula, the total loss for the entire period was 560 Gt. We note an increase in mass in 2016–2017 of 100 Gt, or 34% of the reference SMB for the years 1979–2008 (293 Gt/yr reference in Rignot et al., 2019). After 2016, the mass loss in the Antarctic Peninsula resumed to what it was in prior years, that is, about 10% out of balance. We detect a strong mass gain in Queen Maud Land. A large increase in snowfall reported in 2009 brought 200 Gt of extra mass on the ice sheet (Lenaerts et al., 2013; Van Wessem et al., 2014). The GRACE/GRACE-FO data record reveals that SMB stayed above equilibrium conditions after 2009, with a total mass gain of 980 ± 60 Gt in the last 17.4 yr, or 26 ± 2% of the reference SMB (216 Gt/yr) for that region (sum of basin A-A' and A'B in Rignot et al., 2019).
We find no trend in the combined mass balance of Victoria Land and George VI Land in East Antarctica (basin D'-E and D-D' in Rignot et al., 2019), which have been reported to experience low losses with the MBM method. Conversely, the mass loss in the Amundsen Sea Embayment sector of West Antarctica, which hosts the Pine Island, Thwaites, Haynes, Pope, Smith, and Kohler glaciers, kept increasing the entire period to a cumulative 2,130 Gt loss versus a reference SMB of 200 Gt/yr (basin GH in Rignot et al., 2019), or 61%
Geophysical Research Letters
10.1029/2020GL087291
Figure 3. Comparison of GRACE/GRACE-FO time series of mass change using the JPL fields (blue) versus the adjusted Mass Budget Method (MBM) (red) for
(a) Antarctic Ice Sheet, (b) Queen Maud Land (basin A-A' and A'-B), (c) distribution of mascons used to infer regional and continent-wide mass changes. (d) Antarctic Peninsula (basin I-I”), (f) Wilkes Land, East Antarctica (basin C'D), (g) Amundsen Sea Embayment, West Antarctica (basin GH), and (j) Victoria and GeorgeVI Land (basin D'-E and D-D') in Gigatonnes (109t = 1012kg), along with map of (e) average mass loss in centimeter of water per year and
(h) acceleration in mass loss in centimeter of water per year squared.
out of balance. The other area of mass loss is the Wilkes Land sector, in East Antarctica which includes the Frost, Totten, and Denman glaciers (reference SMB of 247 Gt/yr for basin C'-D) with a cumulative loss of 370 Gt since 2002, or 9% out of balance. Overall, we note a pause in the acceleration in mass loss of Antarctica after 2016 due to the mass gain in QML and a large snowfall in the Antarctica Peninsula in 2016–2017 (van Wessem et al., 2016). The map of acceleration in mass loss (Figure 3) shows enhanced losses in the Amundsen Sea sector, Wilkes Land (CpDc) and mass gain in Queen Maud Land (QML).
4. Discussion
The agreement between the GRACE and GRACE-FO time series is a testimony of the data quality and sat-isfactory calibration of both missions. It is a special challenge for continuity missions to have no overlap period to compare the results. Data continuity is verified within uncertainties at the ice sheet scale, at the basin scale for Antarctica, and for the smaller regions for Greenland, that is, the analysis reveals no signifi-cant bias in the GRACE and GRACE-FO time series from the continental to the regional levels at both poles.
The agreement between solutions from the three different centers is indicative of a high maturity and quality of the data processing algorithms (Tapley et al., 2019). The results also show that within small adjustments in trend, the data gap can be filled with MBM data.
In Greenland, the ice sheet experienced back to back cold summers in 2017 and 2018, but 2019 saw a return of warm conditions, with a high summer loss and one of the lowest SMB on record. The 600 Gt loss is 142% higher than that needed to maintain the ice sheet in a state of mass balance, i.e. zero mass loss. The effect was felt most strongly in the north (NN and NE). Overall, however, ice discharge kept rising during the entire study period (Mouginot et al., 2019). The fluctuations in mass loss are dominated by the interannual variability in SMB, but the long-term signal remains a widespread, steady mass loss from all corners of the ice sheet, cumulative to 4,550 Gt for the 17.4 yr, or 261 ± 45 Gt/yr on average. Key factors for the exceptional loss of 2019 were the persistence of anticyclonic conditions over the summer, promoting high snow and ice melt, combined with low precipitation of snow in the previous winter. A low cloud cover in the north induced high loss even though the air temperature was only 1 to 2◦C warmer than the average for 1981–2010 (Tedesco & Fettweis, 2019).
In Antarctica, the snowfall event in 2009 over Queen Maud Land, East Antarctica, was unique in the GRACE record (Velicogna et al., 2014) but similar episodes of high snowfall have been detected in the past (Lenaerts et al., 2013; Van Wessem et al., 2014). Since 2009, enhanced snowfall persisted in QML, which may be indica-tive of a new trend in SMB over the Atlantic sector. Recent results suggested that snowfall in this sector has been 25% higher than during the pre-industrial period (Medley et al., 2017). Similarly, SMB peaked in the Antarctic Peninsula in 2016, but the increase did not persist after 2016.
The lower mass loss in the Antarctic Peninsula since 2016 and the steady increase in mass in QML partially compensate the rapid mass loss in the Amundsen Sea Embayment (ASE) of West Antarctica and the lower but steady mass loss in the Wilkes Land sector of East Antarctica. The mass loss in the ASE is caused by the steady speed up of the glaciers in response to the enhanced intrusion of warm water of Circumpolar Deep Water (CDW) origin toward the glaciers and to the retreat of the glacier grounding line into thicker ice. In East Antarctica, significant losses were noted for the Frost, Totten, and Denman glaciers, principally caused by an acceleration in ice flow above that which would maintain the glaciers in a state of mass balance, also due to an enhanced intrusion of warm, modified CDW (Rintoul et al., 2016).
Overall, in Antarctica, we note a strong interannual to decadal variability in mass balance over the 2002–2019 GRACE/GRACE-FO record. A similar variability was noted in the longer historical record 1979–2018 where it was shown to reflect decadal fluctuations in SMB (Rignot et al., 2019).
5. Conclusions
We demonstrate data continuity for the GRACE and GRACE-FO missions over the Greenland and Antarctic Ice Sheets at both the continental and regional scales using independent data from the MBM. The GRACE and GRACE-FO data line up across the data gap and the excellent agreement between GRACE and the MBM data helps fill the data gap at the continental and regional scales. Noteworthy features include the large summer loss of 2019, one of the largest on record, captured by GRACE-FO, the persistent snowfall in Queen Maud Land since 2009, and a pause in the acceleration in mass loss in Greenland and Antarctica for the joint GRACE/GRACE-FO period compared to the GRACE period alone. We note, however, that the longer record from MBM still indicates increasing mass loss from both ice sheets and increasing contributions to sea level rise.
References
Geruo, A., Wahr, J., & Zhong, S. (2013). Computations of the viscoelastic response of a 3-D compressible Earth to surface loading: An application to Glacial Isostatic Adjustment in Antarctica and Canada. Geophysical Journal International, 192(2), 557–572.
Bandikova, T., McCullough, C., Kruizinga, G. L., Save, H., & Christophe, B. (2019). GRACE accelerometer data transplant. Advances in Space Research, 64(3), 623–644.
Cheng, M., & Ries, J. (2017). The unexpected signal in GRACE estimates ofC20. Journal Geodesy, 91(8), 897–914.
Gardner, A. S., Moholdt, G., Cogley, J. G., Wouters, B., Arendt, A. A., & Wahr, J. (2013). A reconciled estimate of glacier contributions to sea level rise: 2003 to 2009. Science, 340(6134), 852–857.
Hanna, E., Fettweis, X., Mernild, S., John, C., Ribergaard, M. H., Shuman, C. A., & Motem, T. L. (2014). Atmospheric and oceanic climate forcing of the exceptional Greenland ice sheet surface melt in summer 2012. International Journal of Climatology, 34, 1022–1037.
Acknowledgments
This work was performed at the University of California Irvine, Department of Earth System Science, and at NASA's Jet Propulsion Laboratory under a contract with NASA's program. The GRACE data used in this paper are available at Caltech's Jet Propulsion Laboratory (grace.jpl.nasa.gov). The ice velocity data are available as MEASURES products at the National Snow and Ice Data Center (NSIDC) for Greenland (nsidc.org/data/nsidc-0478) and Antarctica (nsidc.org/data/ nsidc-0720). The ice thickness data are available at the NSIDC as BedMachine Greenland (nsidc.org/data/IDBMG4) and BedMachine Antarctica (nsidc. org/data/nsidc-0756). The SMB data are available on the PANGAEA database (doi.pangaea.de/10.1594/ PANGAEA.896940). GRACE data from the figures are posted online (ess.uci. edu/~velicogna/grace-fo.php).
Geophysical Research Letters
10.1029/2020GL087291
Ivins, E. R., James, T. S., Wahr, J., Schrama, O., Ernst, J., Landerer, F. W., & Simon, K. M. (2013). Antarctic contribution to sea level rise observed by GRACE with improved GIA correction. Journal of Geophysical Research: Solid Earth, 118, 3126–3141. https://doi.org/10. 1002/jgrb.50208
Jacob, T., Wahr, J., Pfeffer, W. T., & Swenson, S. (2012). Recent contributions of glaciers and ice caps to sea level rise. Nature, 482(7386), 514–518.
Lenaerts, J. T., van Meijgaard, E. M., van den Broeke, M. R., Ligtenberg, S. R. M., & Horwath, M. E. I. (2013). Recent snowfall anomalies in Dronning Maud Land, East Antarctica, in a historical and future climate perspective. Geophysical Research Letters, 40, 2684–2688. https://doi.org/10.1002/grl.50559
Loomis, B. D., Rachlin, K. E., & Luthcke, S. B. (2019). Improved Earth oblateness rate reveals increased ice sheet losses and mass-driven sea level rise. Geophysical Research Letters, 46, 6910–6917. https://doi.org/10.1029/2019GL082929
Medley, B., McConnell, J., Neumann, T. A., Reijmer, C. H., Chellman, N., Sigl, M., & Kipfstuhl, S. (2017). Temperature and snowfall in Western Queen Maud Land increasing faster than climate model projections. Geophysical Research Letters, 45, 1472–1480. https://doi. org/10.1002/2017GL075992
Mohajerani, Y., Velicogna, I., & Rignot, E. (2018). Mass loss of Totten and Moscow University Glaciers, East Antarctica, using regionally optimized GRACE Mascons. Geophysical Research Letters, 45, 7010–7018. https://doi.org/10.1029/2018GL078173
Mohajerani, Y., Velicogna, I., & Rignot, E. (2019). Evaluation of regional climate models using regionally-optimized GRACE Mascons in the Amery and Getz ice shelves basins, Antarctica. Geophysical Research Letters, 46, 13,883–13,891. https://doi.org/10.1029/2019GL084665 Morlighem, M., Rignot, E., & Tim Binder, E. A. (2019). Deep glacial troughs and stabilizing ridges unveiled beneath the margins of the
Antarctic ice sheet. Nature Geoscience, 13, 132–137. https://doi.org/10.1038/s41561-019-0510-8
Morlighem, M., Williams, C. N., Rignot, E., An, L., Arndt, J. E., Bamber, J. L., & Zinglersen, K. B. (2017). BedMachine v3: Complete bed topography and ocean bathymetry mapping of Greenland from multibeam echo sounding combined with mass conservation. Geophysical Research Letters, 44, 11,051–11,061. https://doi.org/10.1002/2017GL074954
Mouginot, J., Rignot, E., Bjørk, A. A., van den Broeke, M., Millan, R., Morlighem, M., & Wood, M. (2019). Forty-six years of Greenland Ice Sheet mass balance from 1972 to 2018. Proceedings of the National Academy of Sciences of the United States of America, 116(19), 9239–9244. Mouginot, J., Rignot, E., & Scheuchl, B. (2019). Continent-wide, interferometric SAR phase, mapping of Antarctic ice velocity. Geophysical
Research Letters, 46, 9710–9718. https://doi.org/10.1029/2019GL083826
Noël, B., van de Berg, W. J., Wessem, V., Melchior, J., Van Meijgaard, E., & Van As, D. (2018). Modelling the climate and surface mass balance of polar ice sheets using RACMO2-Part 1: Greenland (1958-2016). The Cryosphere, 12(3), 811–831.
Peltier, W., Argus, D., & Drummond, R. (2015). Space geodesy constrains ice age terminal deglaciation: The global ICE-6G_C (VM5a) model. Journal of Geophysical Research: Solid Earth, 120, 450–487. https://doi.org/10.1002/2014JB011176
Rignot, E., & Mouginot, J. (2012). Ice flow in Greenland for the International Polar Year 2008–2009. Geophysical Research Letters, 39, L11501. https://doi.org/10.1029/2012GL051634
Rignot, E., Mouginot, J., Scheuchl, B., van den Broeke, M., van Wessem, M. J., & Morlighem, M. (2019). Four decades of Antarctic Ice Sheet mass balance from 1979–2017. Proceedings of the National Academy of Sciences, 116(4), 1095–1103.
Rintoul, S. R., Silvano, A., Pena-Molino, B., van Wijk, E., Rosenberg, M., Greenbaum, J. S., & Blankenship, D. D. (2016). Ocean heat drives rapid basal melt of the Totten Ice Shelf. Science Advances, 2, e1601610.
Shepherd, A., Ivins, E. R., Geruo, A., Barletta, V. R., Bentley, M. J., & Bettadpur, S. (2012). A reconciled estimate of ice-sheet mass balance. Science, 338(6111), 1183–1189.
Shepherd, A., Ivins, E., Rignot, E., Smith, B., Van Den Broeke, M., & Velicogna, I. (2018). Mass balance of the Antarctic ice sheet from 1992 to 2017. Nature, 558, 219–222.
Shepherd, A., Ivins, E., Rignot, E., Smith, B., Van Den Broeke, M., & Velicogna, I. (2019). Mass balance of the Greenland ice sheet from 1992 to 2018. Nature, 558, 219–222. https://doi.org/10.1038/s41586-019-1855-2
Simpson, M. J., Milne, G. A., Huybrechts, P., & Long, A. J. (2009). Calibrating a glaciological model of the Greenland ice sheet from the Last Glacial Maximum to present-day using field observations of relative sea level and ice extent. Quaternary Science Reviews, 28(17), 1631–1657.
Sutterley, T. C., & Velicogna, I. (2019). Improved estimates of geocenter variability from time-variable gravity and ocean model outputs. Remote Sensing, 11(18), 2108.
Tapley, B. D., Watkins, M. M., Flechtner, F., Reigber, C., Bettadpur, S., & Rodell, M. (2019). Contributions of GRACE to understanding climate change. Nature Climate Change, 9, 358–369.
Tedesco, M., & Fettweis, X. (2019). Unprecedented atmospheric conditions (1948–2019) drive the 2019 exceptional melting season over the Greenland ice sheet. The Cryosphere Discussions. https://doi.org/10.5194/tc-2019-254
van Wessem, J. M., Jan Van De Berg, W., Noël, B. P., Van Meijgaard, E., Amory, C., & Birnbaum, G. (2018). Modelling the climate and surface mass balance of polar ice sheets using RACMO2: Part 2: Antarctica (1979-2016). The Cryosphere, 12(4), 1479–1498.
van Wessem, J. M., Ligtenberg, S. R. M., Reijmer, C. H., van de Berg, W. J., van den Broeke, M. R., Barrand, N. E., & van Meijgaard, E. (2016). The modelled surface mass balance of the Antarctic Peninsula at 5.5 km horizontal resolution. The Cryosphere, 10, 271–285. Van Wessem, J., Reijmer, C., Morlighem, M., Mouginot, J., Rignot, E., & Medley, B. (2014). Improved representation of East Antarctic
surface mass balance in a regional atmospheric climate model. Journal of Glaciology, 60(222), 761–770.
Velicogna, I., Sutterley, T., & van den Broeke, M. (2014). Regional acceleration in ice mass loss from Greenland and Antarctica using GRACE time-variable gravity data. Geophysical Research Letters, 41, 8130–8137. https://doi.org/10.1002/2014GL061052