Dissecting the multicellular ecosystem of
metastatic melanoma by single-cell RNA-seq
The MIT Faculty has made this article openly available.
Please share
how this access benefits you. Your story matters.
Citation
Tirosh, I.; Izar, B.; Prakadan, S. M.; Wadsworth, M. H.; Treacy, D.;
Trombetta, J. J.; Rotem, A.; Rodman, C.; Lian, C. et al. "Dissecting
the multicellular ecosystem of metastatic melanoma by single-cell
RNA-seq." Science 352, 6282 (April 2016): 189-196 © 2016 American
Association for the Advancement of Science
As Published
http://dx.doi.org/10.1126/science.aad0501
Publisher
American Association for the Advancement of Science (AAAS)
Version
Author's final manuscript
Citable link
http://hdl.handle.net/1721.1/110559
Terms of Use
Creative Commons Attribution-Noncommercial-Share Alike
Detailed Terms
http://creativecommons.org/licenses/by-nc-sa/4.0/
Dissecting the multicellular ecosystem of metastatic melanoma
by single-cell RNA-seq
Itay Tirosh1,*, Benjamin Izar1,2,3,*,‡,†, Sanjay M. Prakadan1,4,5,6, Marc H. Wadsworth II1,4,5,6,
Daniel Treacy1, John J. Trombetta1, Asaf Rotem1,2,3, Christopher Rodman1, Christine Lian7,
George Murphy7, Mohammad Fallahi-Sichani8, Ken Dutton-Regester1,2,9, Jia-Ren Lin10, Ofir
Cohen1, Parin Shah2, Diana Lu1, Alex S. Genshaft1,4,5,6, Travis K. Hughes1,4,6,11, Carly G. K.
Ziegler1,4,6,11, Samuel W. Kazer1,4,5,6, Aleth Gaillard1,4,5,6, Kellie E. Kolb1,4,5,6,
Alexandra-Chloé Villani1, Cory M. Johannessen1, Aleksandr Y. Andreev1, Eliezer M. Van Allen1,2,3,
Monica Bertagnolli12,13, Peter K. Sorger8,10,14, Ryan J. Sullivan15, Keith T. Flaherty15,
Dennie T. Frederick15, Judit Jané-Valbuena1, Charles H. Yoon12,13,†, Orit
Rozenblatt-Rosen1,†, Alex K. Shalek1,4,5,6,11,16,†, Aviv Regev1,17,18,†,‡, and Levi A. Garraway1,2,3,14,†,‡ 1Broad Institute of MIT and Harvard, Cambridge, Massachusetts, USA
2Department of Medical Oncology, Dana-Farber Cancer Institute, Harvard Medical School, Boston, Massachusetts, USA
3Center for Cancer Precision Medicine, Dana-Farber Cancer Institute, Boston, Massachusetts, USA
4Institute for Medical Engineering & Science, Massachusetts Institute of Technology, Cambridge, Massachusetts, USA
5Department of Chemistry, Massachusetts Institute of Technology, Cambridge, Massachusetts, USA
6Ragon Institute of Massachusetts General Hospital, Massachusetts Institute of Technology and Harvard University, Cambridge, Massachusetts, USA
7Department of Pathology, Brigham and Women’s Hospital, Harvard Medical School, Boston, Massachusetts, USA
8Program in Therapeutic Sciences, Department of Systems Biology, Harvard Medical School, Boston, MA
9Department of Genetics and Computational Biology, QIMR Berghofer Medical Research Institute, Brisbane, Queensland, Australia
10HMS LINCS Center & Laboratory of Systems Pharmacology, Harvard Medical School, Boston, Massachusetts, USA
‡Correspondence to: bizar@partners.org (B.I.), aregev@broadinstitute.org (A.R.) and Levi_Garraway@dfci.harvard.edu (L.A.G.).
*These authors contributed equally to this work. †These authors contribute equally to this work.
HHS Public Access
Author manuscript
Science
. Author manuscript; available in PMC 2016 July 14. Published in final edited form as:Science. 2016 April 8; 352(6282): 189–196. doi:10.1126/science.aad0501.
A
uthor Man
uscr
ipt
A
uthor Man
uscr
ipt
A
uthor Man
uscr
ipt
A
uthor Man
uscr
ipt
11Division of Health Sciences and Technology, Harvard Medical School, Boston, Massachusetts, USA
12Department of Surgical Oncology, Dana-Farber Cancer Institute, Harvard Medical School, Boston, Massachusetts, USA
13Department of Surgical Oncology, Brigham and Women’s Hospital, Harvard Medical School, Boston, Massachusetts, USA
14Ludwig Center at Harvard, Boston, Massachusetts, USA
15Division of Medical Oncology, Massachusetts General Hospital Cancer Center, Boston, Massachusetts, USA
16Immunology, Massachusetts General Hospital, Boston, Massachusetts, USA
17Department of Biology and Koch Institute, Massachusetts Institute of Technology, Boston, Massachusetts, USA
18Howard Hughes Medical Institute, Chevy Chase, Maryland, USA
Abstract
To explore the distinct genotypic and phenotypic states of melanoma tumors we applied single-cell RNA-seq to 4,645 single cells isolated from 19 patients, profiling malignant, immune, stromal and endothelial cells. Malignant cells within the same tumor displayed transcriptional heterogeneity associated with the cell cycle, spatial context, and a drug resistance program. In particular, all tumors harbored malignant cells from two distinct transcriptional cell states, such that “MITF-high” tumors also contained “AXL-“MITF-high” tumor cells. Single-cell analyses suggested distinct tumor micro-environmental patterns, including cell-to-cell interactions. Analysis of
tumor-infiltrating T cells revealed exhaustion programs, their connection to T cell activation and to clonal expansion, and their variability across patients. Overall, we begin to unravel the cellular ecosystem of tumors and how single cell genomics offers insights with implications for both targeted and immune therapies.
INTRODUCTION
Tumors are complex ecosystems defined by spatiotemporal interactions between
heterogeneous cell types, including malignant, immune and stromal cells (1). Each tumor’s cellular composition, as well as the interplay between these components, may exert critical roles in cancer development (2). However, the specific components, their salient biological functions, and the means by which they collectively define tumor behavior remain
incompletely characterized.
Tumor cellular diversity poses both challenges and opportunities for cancer therapy. This is exemplified by the varied clinical efficacy achieved in malignant melanoma with targeted therapies and immunotherapies. Immune checkpoint inhibitors can produce clinical responses in some patients with metastatic melanomas (3–7); however, the genomic and molecular determinants of response to these agents remain incompletely understood. Although tumor neoantigens and PD-L1 expression clearly correlate with this response (8–
A
uthor Man
uscr
ipt
A
uthor Man
uscr
ipt
A
uthor Man
uscr
ipt
A
uthor Man
uscr
ipt
10), it is likely that other factors from subsets of malignant cells, the microenvironment, and tumor-infiltrating lymphocytes (TILs) also play essential roles (11).
Melanomas that harbor the BRAFV600E mutation are commonly treated with RAF/MEK-inhibition prior to or following immune checkpoint RAF/MEK-inhibition. Although this regimen improves survival, virtually all tumors eventually develop resistance to these drugs (12, 13). Unfortunately, no targeted therapy currently exists for patients whose tumors lack BRAF mutations—including NRAS mutant tumors, those with inactivating NF1 mutations, or rarer events (e.g., RAF fusions). Collectively, these factors highlight the need for a deeper understanding of melanoma composition and its impact on the clinical course.
The next wave of therapeutic advances in cancer will likely be accelerated by technologies that assess the malignant, micro-environmental, and immunologic states most likely to inform treatment response and resistance. Ideally we would be able to assess salient cellular heterogeneity by quantifying variation in oncogenic signaling pathways, drug-resistant tumor cell subsets, and the spectrum of immune, stromal and other cell states that may inform immunotherapy response. Toward this end, single-cell genomic approaches enable detailed evaluation of genetic and transcriptional features present in 100s–1000s of
individual cells per tumor (14–16). In principle, this approach may identify all major cellular components simultaneously, determine their individual genomic and molecular states (15), and ascertain which of these features may predict or explain clinical responses to anticancer agents. In order to explore this question we used single-cell RNA-seq to examine intra- and inter-tumoral heterogeneities in both malignant and non-malignant cell types and states, their drivers and interrelationships in the complex tumor cellular ecosystem.
Profiles of individual cells from patient-derived melanoma tumors
We measured single-cell RNA-seq profiles from 4,645 malignant, immune and stromal cells isolated from 19 freshly procured melanoma tumors that span a range of clinical and therapeutic backgrounds (Table S1). These included ten metastases to lymphoid tissues (nine to lymph nodes and one to the spleen), eight to distant sites (five to sub-cutaneous/
intramuscular tissue and three to the gastrointestinal tract) and one primary acral melanoma. Genotypic information was available for 17 of 19 tumors, of which four had activating mutations in BRAF and five in NRAS oncogenes; eight patients were BRAF/NRAS wild-type (Table S1).
To isolate viable single cells suitable for high-quality single-cell RNA-seq, we developed and implemented a rapid translational workflow (Fig. 1A) (15). We processed tumor tissues immediately following surgical procurement, and generated single-cell suspensions within ~45 minutes with an experimental protocol optimized to reduce artifactual transcriptional changes introduced by disaggregation, temperature, or time (17). Once in suspension, we recovered individual viable immune (CD45+) and non-immune (CD45−) cells (including malignant and stromal cells) by flow cytometry (FACS). Next, we prepared cDNA from the individual cells, followed by library construction and massively parallel sequencing. The average number of mapped reads per cell was ~150,000 (17), with a median library complexity of 4,659 genes for malignant cells and 3,438 genes for immune cells,
comparable to previous studies of only malignant cells from fresh glioblastoma tumors (15).
A
uthor Man
uscr
ipt
A
uthor Man
uscr
ipt
A
uthor Man
uscr
ipt
A
uthor Man
uscr
ipt
Single-cell transcriptome profiles distinguish cell states in malignant and non-malignant cells
We used a multi-step approach to distinguish the different cell types within melanoma tumors on the basis of both genetic and transcriptional states (Fig. 1B–D). First, we inferred large-scale copy number variations (CNVs) from expression profiles by averaging
expression over 100-gene stretches on their respective chromosomes (15) (Fig. 1B). For each tumor, this approach revealed a common pattern of aneuploidy, which we validated in two tumors by bulk whole-exome sequencing (WES, Figs. 1B, S1A). Cells in which aneuploidy was inferred were classified as malignant cells (Figs. 1B, Fig. S1).
Second, we grouped the cells on the basis of their expression profiles (Figs. 1C–D, S2). Here, we used non-linear dimensionality reduction (t-Distributed Stochastic Neighbor Embedding (t-SNE)) (18), followed by density clustering (19). Generally, cells designated as malignant by CNV analysis formed a separate cluster for each tumor (Fig. 1C), suggesting a high degree of inter-tumor heterogeneity. In contrast, the non-malignant cells clustered by cell type (Figs. 1D, S2), independent of their tumor of origin and metastatic site (Fig. S3). Clusters of non-malignant cells were annotated as T cells, B cells, macrophages, endothelial cells, cancer-associated fibroblasts (CAFs) and NK cells on the basis of preferentially or uniquely expressed marker genes (Figs. 1D, S2, Tables S2, S3).
Analysis of malignant cells reveals heterogeneity in cell cycle and spatial organization We next used unbiased analyses of the individual malignant cells to identify biologically relevant melanoma cell states. After controlling for inter-tumor differences (17), we
examined the six top components from a principal component analysis (PCA; Table S4). The first component correlated highly with the number of genes detected per cell, and likely reflects technical aspects, while the other five significant principal components highlighted biological variability.
The second component (PC2) was associated with the expression of cell cycle genes (GO: “cell cycle” p<10−16; hypergeometric test). To characterize cycling cells more precisely, we used gene signatures previously shown to denote G1/S or G2/M phases in both
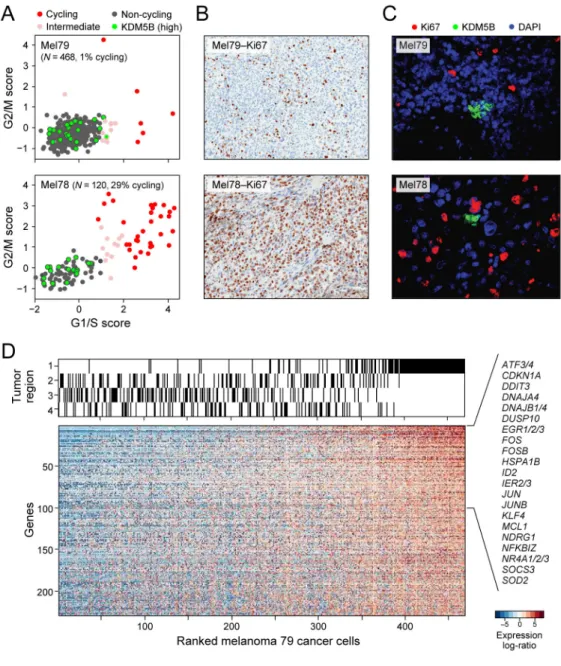
synchronization (20) and single-cell (16) experiments in cell lines. Cell cycle phase-specific signatures were highly expressed in a subset of malignant cells, distinguishing cycling from non-cycling cells (Figs. 2A, S4A). These signatures revealed variability in the fraction of cycling cells across tumors (13.5% on average, +/−13 STDV; Fig. S4B), allowing us to designate both low-cycling (1–3%, e.g. Mel79) and high-cycling tumors (20–30%, e.g., Mel78) consistent with Ki67+ staining (Figs. 2B, S4C).
A core set of cell cycle genes was induced (Fig. S4D, red dots; Table S5) in both low-cycling and high-low-cycling tumors, with one notable exception: cyclin D3, which was only induced in cycling cells in high-cycling tumors (Fig. S4D). In contrast, KDM5B (JARID1B) showed the strongest association with noncycling cells (Fig. 2A, green dots), mirroring findings in glioblastoma (15). KDM5B encodes a H3K4 histone demethylase associated with a subpopulation of slow-cycling and drug-resistant melanoma stem-like cells (21, 22) in mouse models. Immunofluorescence (IF) staining validated the presence and mutually
A
uthor Man
uscr
ipt
A
uthor Man
uscr
ipt
A
uthor Man
uscr
ipt
A
uthor Man
uscr
ipt
exclusive expression of KDM5B and Ki67. KDM5B-expressing cells were grouped in small clusters, consistent with observations in mouse and in vitro models (21) (Figs. 2C, S4E). Two principal components (PC3 and PC6) primarily segregated different malignant cells from one treatment-naive tumor (Mel79). In this tumor, we analyzed 468 malignant cells from four distinct regions following surgical resection (Fig. S5A). We identified 229 genes with higher expression in the malignant cells of Region 1 compared to those of other tumor regions (Fig. 2D, FDR<0.05; Table S6). A similar expression program was found in T cells from Region 1 (Fig. S6, Table S6), suggesting a spatial effect that influences multiple cell types. The genes with the highest preferential expression in Region 1 are also generally co-expressed across melanoma tumors profiled in bulk in TCGA (23)(Fig. S6). Many of these genes encode immediate-early activation transcription factors linked to inflammation, stress responses, and a melanoma oncogenic program (e.g., ATF3, FOS, FOSB, JUN, JUNB). Several of these transcription factors (e.g., FOS, JUN, NR4A1/2) are regulated by cyclic AMP/CREB signaling, which has been implicated as a MAP kinase-independent resistance module in BRAF-mutant melanomas treated with RAF/MEK inhibition (24). Other top genes differentially up-regulated in Region 1 included those involved in survival (MCL1), stress responses (EGR1/2/3, NDRG, HSPA1B), and NF- κB signaling (NFKBIZ), which has also been associated with resistance to RAF/MEK inhibition (25). Immunohistochemistry confirmed the increased NF-κB and JunB levels in cells of Region 1 compared to the other regions of this tumor (Fig. S5B).
Heterogeneity in the abundance of a dormant, drug-resistant melanoma subpopulation Collectively, the above observations implied that pre-treatment melanoma tumors may harbor malignant cell subsets less likely to respond to targeted therapy. The transcriptional programs associated with principal components PC4 and PC5 were highly correlated with expression of MITF (microphthalmia-associated transcription factor), which encodes the master melanocyte transcriptional regulator and a melanoma lineage-survival oncogene (26). Scoring genes by their correlation to MITF across single cells, we identified a “MITF-high” program consisting of several MITF targets, including TYR, PMEL and MLANA (Table S7). A second transcriptional program, negatively correlated with the MITF program and with PC4 and PC5 (Pearson correlation P<10−24), included AXL and NGFR (p75NTR), a marker of resistance to various targeted therapies (27, 28) and a putative melanoma cancer stem cell marker (29), respectively (Table S8). Thus, these transcriptional programs resemble reported (25, 30–32) “MITF-high” and “MITF-low/AXL-high” (“AXL-high”) transcriptional profiles that can distinguish melanoma tumors, cell lines and mice models. Notably, the “AXL-high” program has been linked to intrinsic resistance to RAF/MEK inhibition (25, 30, 31).
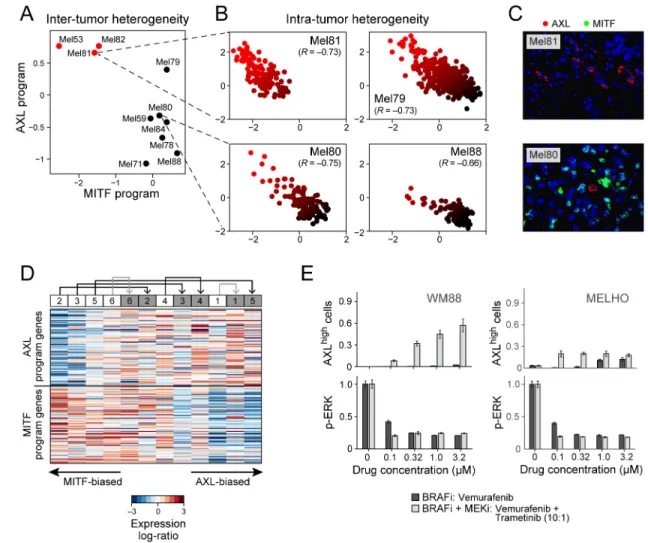
While each melanoma could be classified as “MITF-high” or “AXL-high” at the bulk tumor level (Fig. 3A), at the single cell level every tumor contained malignant cells corresponding to both transcriptional states. Using single-cell RNA-seq to examine each cell’s expression of the MITF and AXL gene sets, we observed that MITF-high tumors, including treatment-naïve melanomas, harbored a subpopulation of AXL-high melanoma cells that was undetectable through bulk analysis, and vice versa (Fig. 3B). The malignant cells thus
A
uthor Man
uscr
ipt
A
uthor Man
uscr
ipt
A
uthor Man
uscr
ipt
A
uthor Man
uscr
ipt
spanned the continuum between AXL-high and MITF-high states in every investigated tumor (Figs. 3B, S7). We further validated the mutually exclusive expression of the MITF-high and AXL-MITF-high programs in cells from the same bulk tumors by immunofluorescence (Figs. 3C, S8).
Since malignant cells with AXL-high and MITF-high transcriptional states co-exist in melanoma, we hypothesized that treatment with RAF/MEK inhibitors would increase the prevalence of AXL-high cells following the development of drug resistance. To test this, we analyzed RNA-seq data from a cohort (13) of six paired BRAFV600E melanoma biopsies taken before treatment and after resistance to single-agent RAF inhibition (vemurafenib; n=1) or combined RAF/MEK inhibition (dabrafenib and trametinib; n=5), respectively (Tables S9, S10). We ranked the 12 transcriptomes on the basis of the relative expression of all genes in the AXL-high program compared to those in the MITF-high program. In each pair, we observed a shift towards the AXL-high program in the drug-resistant sample (Fig. 3D; P<0.05 for same effect in six out of six paired samples, binomial test; P<0.05 for four of six individual paired-sample comparisons shown by black arrows (17)). RNA-seq data from an independent cohort (33) also showed that a subset of drug-resistant samples exhibited increased expression of the AXL program (Fig. S9). Other genes previously implicated in resistance to RAF/MEK inhibition were also increased in a subset of the drug-resistant samples. PDGFRB (34) was upregulated in a similar subset as the AXL program, while MET (33) was upregulated in a mutually exclusive subset (Fig. S9), suggesting that AXL and MET may reflect distinct drug-resistant states.
To further assess the connection between the AXL program and resistance to RAF/MEK inhibition, we studied single-cell AXL expression in 18 melanoma cell lines from the CCLE (35) (Table S11). Flow-cytometry demonstrated a wide distribution of the proportion of AXL-positive cells, from <1% to 99% per cell line, which correlated with bulk mRNA levels, and that was inversely associated with sensitivity to small-molecule RAF inhibition (Table S11).
We treated 10 cell lines (17) with increasing doses of a RAF/MEK inhibitor combination (dabrafenib and trametinib) and found an increase in the proportion of AXL-positive cells in six cell lines initially composed of a small (<3%) pre-treatment AXL-positive population (S10A). In contrast, cell lines with an intrinsically high proportion of AXL-expression showed modest or no changes (Fig. S10B). We obtained similar results by multiplexed quantitative single-cell immunofluorescence (IF), which also demonstrated that the increased fraction of AXL-positive cells following RAF/MEK inhibition is associated with rapid decreases in ERK phosphorylation (reflecting MAP kinase signaling inhibition) (Figs. 3E, S11–12). In summary, both melanoma tumors and cell lines demonstrate drug-resistant tumor cell subpopulations that precede treatment and become enriched following MAP-kinase targeted treatment.
Non-malignant cells and their interactions within the melanoma microenvironment Various non-malignant cells comprise the tumor microenvironment. The composition of the microenvironment has an important impact on tumorigenesis and in the modulation of
A
uthor Man
uscr
ipt
A
uthor Man
uscr
ipt
A
uthor Man
uscr
ipt
A
uthor Man
uscr
ipt
treatment responses (1). Tumor infiltration with T cells, for example, is predictive for the response to immune checkpoint inhibitors in various cancer types (36).
To resolve the composition of the melanoma micro-environment, we used our single-cell RNA-seq profiles to define unique expression signatures of each of five distinct non-malignant cell types: T cells, B cells, macrophages, endothelial cells, and CAFs. Because our signatures were derived from single cell profiles, we could avoid confounders and ensure that each signature is determined by cell type-specific profiles (17). Next, we used these signatures to infer the relative abundance of those cell types in a larger compendium of tumors ((17), Figs. 4A, S13). We found a strong correlation (R~0.8) between our estimated tumor purity and that predicted from DNA analysis (37) (Fig. 4A, first lane below the heatmap).
We partitioned 471 tumors from The Cancer Genome Atlas (TCGA) into 10 distinct microenvironment clusters on the basis of their inferred cell type composition (Fig. 4A). Clusters were mostly independent of the site of metastasis (Fig. 4A, second lane), with some exceptions (e.g., Clusters 8 and 9). Next, we examined how these different
microenvironments may relate to the phenotype of the malignant cells. In particular, CAF abundance is predictive of the AXL-MITF distinction, with CAF-rich tumors expressing the AXL-high signature (Fig. 4A, bottom lane). Interestingly, an “AXL-high” program was expressed both by melanoma cells and by CAFs. However, we distinguished AXL-high genes that are preferentially expressed by melanoma cells (“melanoma-derived AXL program”) and those that are preferentially expressed by CAFs (“CAF-derived AXL program”). Both sets of genes were correlated with the inferred CAF abundance in tumors from TCGA (Fig. S14) (38). Furthermore, the MITF-high program, which is specific to melanoma cells, was negatively correlated with inferred CAF abundance. Taken together, these results suggest that CAF abundance may be linked to preferential expression of the AXL-high over the MITF-high program by melanoma cells. Thus it is possible that specific tumor-CAF interactions may shape the melanoma cell transcriptome.
Interactions between cells play crucial roles in the tumor micro-environment (1). To assess how cell-cell interactions may influence tumor composition, we searched for genes expressed by cells of one type that may influence or reflect the proportion of cells of a different type in the tumor (Fig. S15). For example, we searched for genes expressed primarily by CAFs (but not T cells) in single cell data that correlated with T cell abundance (as inferred by T cell specific genes) in bulk tumor tissue from the TCGA data set (23). We identified a set of CAF-expressed genes that correlated strongly with T cell infiltration (Fig. 4B, red circles). These included known chemotactic (CXCL12, CCL19) and immune modulating (PD-L2) genes, which are expressed by both CAFs and macrophages (Fig. S16). A separate set of genes exclusively expressed by CAFs that correlated with T cell infiltration (Fig. S16) included multiple complement factors (C1S, C1R, C3, C4A, CFB and C1NH [SERPING1]). Notably, these complement genes were specifically expressed by freshly isolated CAFs but not by cultured CAFs (Fig. S17) or macrophages (Fig. S16). These findings are intriguing, as studies have implicated complement activity in the recruitment and modulation of T cell mediated anti-tumor immune responses (in addition to their role augmenting innate immunity; (39)).
A
uthor Man
uscr
ipt
A
uthor Man
uscr
ipt
A
uthor Man
uscr
ipt
A
uthor Man
uscr
ipt
We validated a high correlation (R>0.8) between complement factor 3 (C3) levels (one of the CAF-expressed complement genes) and infiltration of CD8+ T cells. We performed dual IF staining and quantitative slide analysis of two tissue microarrays (TMAs) with a total of 308 core biopsies, including primary tumors, metastatic lesions, normal skin with adjacent tumor and healthy skin controls (Figs. 4C; S18, (17)). To test the generalizability of the association between CAF-derived complement factors with T cell infiltration, we expanded the analysis to bulk RNA-seq datasets across all TCGA cancer types (Fig. 4D). Consistent with the results in melanoma, complement factors correlated with inferred T cell abundance in many cancer types, and more highly than in normal tissues (e.g., R>0.4 for 65% of cancer types but only for 14% of normal tissue types). Although correlation analysis cannot determine causality, this indicates a potential in vivo role for cell-to-cell interactions. Diversity of tumor-infiltrating T lymphocytes and their functional states
The activity of tumor-infiltrating lymphocytes (TILs) – in particular CD8+ T cells – is a major determinant of successful immune surveillance. Under normal circumstances, effector CD8+ T cells exposed to antigens and co-stimulatory factors may mediate lysis of malignant cells and control tumor growth. However, this function can be hampered by tumor-mediated T cell exhaustion, such that T cells fail to activate cytotoxic effector functions (40).
Exhaustion is promoted through the stimulation of co-inhibitory “checkpoint” molecules on the T cell surface (PD-1, TIM-3, CTLA-4, TIGIT, LAG3 and others) (41); blockade of checkpoint mechanisms has shown clinical benefit in subsets of melanoma and other malignancies (3, 10, 42, 43). While checkpoint ligand expression (e.g., PD-L1) and neoantigen load clearly contribute (9, 44, 45), no biomarker has emerged that reliably predicts the clinical response to immune checkpoint blockade. We reasoned that single cell analyses might yield features to elucidate response determinants and possibly identify new immunotherapy targets.
We thus, analyzed the single-cell expression patterns of 2,068 T cells from 15 melanomas. We identified T cells and their main subsets (CD4+, Tregs, and CD8+) on the basis of the expression levels of their respective defining surface markers (Fig. 5A, top and Table S12). Within both the CD4+ and CD8+ populations, a principal component analysis distinguished cell subsets and heterogeneity of activation states on the basis of the expression of naïve and cytotoxic T cell genes (Figs. 5A, B, S19).
Next, we sought to determine the exhaustion status of each cell, from the expression of key inhibitory receptors (PD1, TIGIT, TIM3, LAG3 and CTLA4). In several cases, these co-inhibitory receptors were co-expressed across individual cells; we validated this
phenomenon for PD1 and TIM3 by immunofluorescence (Fig. 5C). However, exhaustion gene expression was also highly correlated with the expression of both cytotoxicity markers and overall T cell activation states (Fig. 5B). This observation resembles an “activation-dependent exhaustion expression program” such as those reported previously (46, 47). Accordingly, expression of co-inhibitory receptors (alone or in combinations) per se may not be sufficient to characterize the salient functional state of tumor-associated T lymphocytes in situ or to distinguish exhaustion from activation.
A
uthor Man
uscr
ipt
A
uthor Man
uscr
ipt
A
uthor Man
uscr
ipt
A
uthor Man
uscr
ipt
To define an “activation-independent exhaustion program”, we leveraged single-cell data from CD8+ T cells sequenced in a single tumor (Mel75, 314 cells). These data allowed tumor cytotoxic and exhaustion programs to be deconvolved. Specifically, PCA of Mel75 T cell transcriptomes identified a robust expression module that consisted of all five co-inhibitory receptors and other exhaustion-related genes, but not cytotoxicity genes (Fig. S21, Table S13).
We used the Mel75 exhaustion program along with previously published exhaustion programs (46, 48) to estimate the exhaustion state of each cell. Exhaustion state was defined as “high” or “low” expression of the exhaustion program relative to that of cytotoxicity genes (Fig. 5D, (17)). Accordingly, we defined exhaustion states in Mel75 and in four additional tumors with the highest number of CD8+ T cells (68 to 214 cells per tumor). We identified the top preferentially expressed genes in high-exhaustion compared to low-exhaustion cells (both defined relative to the expression of cytotoxicity genes). This allowed us to define a core exhaustion signature across cells from various tumors.
Our core exhaustion signature yielded 28 genes that were consistently upregulated in high-exhaustion cells of most tumors, including co-inhibitory (TIGIT) and co-stimulatory (TNFRSF9/4-1BB, CD27) receptors (Fig. 5E, Table S14). In addition, most genes that were significantly upregulated in high-exhaustion cells of at least one tumor had distinct
associations with exhaustion across the different tumors (Figs. 5F, 272 of 300 genes with P<0.001 by permutation test; S22A–B, Table S14). These tumor-specific signatures included variable expression of known exhaustion markers (Table S14), and could be linked to response to immunotherapies or reflect the effects of previous treatments. For example, CTLA4 was highly upregulated in exhausted cells of Mel75 and weakly upregulated in three other tumors, but was completely decoupled from exhaustion in Mel58. Interestingly, Mel58 was derived from a patient with initial response and subsequent development of resistance to CTLA-4 blockade with ipilimumab (Figs. 5F, S22C). Another variable gene of interest was the transcription factor NFATC1; previously implicated in T cell exhaustion (49). NFATC1 and its target genes were preferentially associated with the activation-independent
exhaustion phenotype in Mel75 (Fig. S22D–E), suggesting a potential role of NFATC1 in the underlying variability of exhaustion programs among patients.
Finally, we explored the relationship between T cell states and clonal expansion. T cells that recognize tumor antigens may proliferate to generate discernible clonal subpopulations defined by an identical T cell receptor (TCR) sequence (50). To identify potentially expanded T cell clones, we used RNA-seq reads that map to the TCR to classify single T cells by their isoforms of the V and J segments of the alpha and beta TCR chains, and searched for enriched combinations of TCR segments. Most observed combinations were found in few cells and were not enriched. However, approximately half of the CD8+ T cells in Mel75 had one of seven enriched combinations identified (FDR=0.005), and thus may represent expanded T cell clones (Fig. 5G, Fig. S23). Interestingly, this putative T cell expansion was also linked to exhaustion (Fig. 5H), such that low-exhaustion T cells were depleted of expanded T cells (TCR clusters with >6 cells) and enriched in non-expanded T cells (TCR clusters with 1–4 cells). In particular, the non-exhausted cytotoxic cells are almost all non-expanded (Fig. 4H). Overall, this analysis suggests that single-cell RNA-seq
A
uthor Man
uscr
ipt
A
uthor Man
uscr
ipt
A
uthor Man
uscr
ipt
A
uthor Man
uscr
ipt
may allow for the inference of functionally variable T cell populations that are not detectable with other profiling approaches (Fig. S24). This knowledge may empower studies of tumor response and resistance to immune checkpoint inhibitors.
CONCLUSIONS
Our analysis has uncovered intra- and inter-individual, spatial, functional and genomic heterogeneity in melanoma cells and associated tumor components that shape the
microenvironment, including immune cells, CAFs, and endothelial cells. We identified a cell state in a subpopulation of all melanomas studied that is linked to resistance to targeted therapies and validated the presence of a dormant drug-resistant population in a number of melanoma cell lines using different approaches.
By leveraging single cell profiles from a few tumors to deconvolve a large collection of bulk profiles from TCGA, we discovered different microenvironments associated with distinct malignant cell profiles, and a subset of genes expressed by one cell type (e.g., CAFs) that may influence the proportion of cells present of another cell type (e.g., T cells), suggesting the importance of intercellular communication for tumor phenotype. Putative interactions between stromal-derived factors and immune-cell abundance in melanoma core biopsies suggest that diagnostic and therapeutic strategies should consider tumor cell composition rather than bulk expression. Furthermore, our data suggests potential biomarkers for distinguishing exhausted and cytotoxic T cells that may aid in selecting patients for immune checkpoint blockade.
While future work is necessary to clarify the interplay between these cell types and functional states in space and time, the ability to carry out numerous, highly-multiplexed single cell observations within a tumor provides power to identify meaningful cell subpopulations and gene expression programs that can inform on both the analysis of bulk transcriptional data and precision treatment strategies. Conceivably, single cell genomic profiling may soon enable a deeper understanding of the complex interplay among cells within the tumor ecosystem and its evolution in response to treatment, thereby providing a versatile new tool for future translational applications.
Supplementary Material
Refer to Web version on PubMed Central for supplementary material.
Acknowledgments
We thank M. Singer, A. Anderson, V. K. Kuchroo and A. Aguirre for fruitful discussions. We thank S. Barthel and T. Schatton for providing the Tim-3 antibody and Q. Zhan for preparing immunofluorescence staining. We thank J. Thurman for excellent guidance on complement biology. L. Garraway, B. Izar, S. Prakadan, A. Regev, O. Rozenblatt-Rosen, A. Shalek, I. Tirosh, M. Wadsworth II and Institutions The Broad Institute, Brigham and Women’s Hospital, Dana-Farber Cancer Institute, Massachusetts Institute of Technology, and President and Fellows of Harvard College have filed patent application (BI-2015/077) that relates to tumor and microenvironment gene expression, compositions of matter and methods of use thereof. L. Garraway, B. Izar and A. Rotem and Institution Dana Farber Cancer Institute have filed patent applications (DFCI 2105.001) that relates to cancer-patient derived tumor dissociation for biological analysis.
A
uthor Man
uscr
ipt
A
uthor Man
uscr
ipt
A
uthor Man
uscr
ipt
A
uthor Man
uscr
ipt
L.A.G was supported by NCI grants P01CA163222 and R35CA197737, the Dr. Miriam and Sheldon Adelson Medical Research Foundation, the Melanoma Research Alliance and the Ludwig Center at Harvard Medical School.
L.A.G. is a member of the scientific advisory board for Warp Drive, Inc., consultant for Novartis, Inc., Bayer Oncology, and Foundation Medicine, Inc., and an equity holder in Foundation Medicine, Inc.
A.R. was supported by funds from the Howard Hughes Medicine Institute, the Klarman Cell Observatory, STARR cancer consortium, NCI grant 1U24CA180922, by the Koch Institute Support (core) grant P30-CA14051 from the National Cancer Institute, and the Broad Institute.
A.R. is a scientific advisory board member for ThermoFisher Scientific and Syros Pharmaceuticals and a consultant for Driver Group.
A.K.S. was supported by the Searle Scholars Program, the Beckman Young Investigator Program and the NIH New Innovator Award (DP2 OD020839).
B.I. was supported by the Wong Family Award for Translational Oncology of the Dana-Farber Cancer Institute.
I.T. was supported by a human frontiers science program (HFSP) long-term fellowship, a Rothschild fellowship, STARR cancer consortium, and an Integrative Cancer Biology Program (ICBP) grant U54CA112962.
I.T., A.K.S. and O.R.R. were supported by the Broad Institute.
S.W.K. was supported by a National Science Foundation GRFP fellowship.
MF-S was supported by the NCI grant K99CA194163, and PKS was supported by the NIH (P50GM107618) and the Ludwig Center at Harvard.
References and Notes
1. Hanahan D, Weinberg RA. Hallmarks of cancer: the next generation. Cell. 2011; 144:646–674. [PubMed: 21376230]
2. Meacham CE, Morrison SJ. Tumour heterogeneity and cancer cell plasticity. Nature. 2013; 501:328–337. [PubMed: 24048065]
3. Hodi FS, et al. Improved Survival with Ipilimumab in Patients with Metastatic Melanoma. N Engl J Med. 2010; 363:711–723. [PubMed: 20525992]
4. Brahmer JR, et al. Phase I study of single-agent anti-programmed death-1 (MDX-1106) in refractory solid tumors: safety, clinical activity, pharmacodynamics, and immunologic correlates. J Clin Oncol Off J Am Soc Clin Oncol. 2010; 28:3167–3175.
5. Brahmer JR, et al. Safety and Activity of Anti–PD-L1 Antibody in Patients with Advanced Cancer. N Engl J Med. 2012; 366:2455–2465. [PubMed: 22658128]
6. Topalian SL, et al. Safety, activity, and immune correlates of anti-PD-1 antibody in cancer. N Engl J Med. 2012; 366:2443–2454. [PubMed: 22658127]
7. Hamid O, et al. Safety and tumor responses with lambrolizumab (anti-PD-1) in melanoma. N Engl J Med. 2013; 369:134–144. [PubMed: 23724846]
8. Weber JS, et al. Safety, efficacy, and biomarkers of nivolumab with vaccine in ipilimumab-refractory or -naive melanoma. J Clin Oncol Off J Am Soc Clin Oncol. 2013; 31:4311–4318.
9. Mahoney KM, Atkins MB. Prognostic and predictive markers for the new immunotherapies. Oncol Williston Park N. 2014; 28(Suppl 3):39–48.
10. Larkin J, et al. Combined Nivolumab and Ipilimumab or Monotherapy in Untreated Melanoma. N Engl J Med. 2015; 373:23–34. [PubMed: 26027431]
11. Snyder A, et al. Genetic basis for clinical response to CTLA-4 blockade in melanoma. N Engl J Med. 2014; 371:2189–2199. [PubMed: 25409260]
12. Wagle N, et al. Dissecting Therapeutic Resistance to RAF Inhibition in Melanoma by Tumor Genomic Profiling. J Clin Oncol. 2011; doi: 10.1200/JCO.2010.33.2312
13. Van Allen EM, et al. The genetic landscape of clinical resistance to RAF inhibition in metastatic melanoma. Cancer Discov. 2014; 4:94–109. [PubMed: 24265153]
A
uthor Man
uscr
ipt
A
uthor Man
uscr
ipt
A
uthor Man
uscr
ipt
A
uthor Man
uscr
ipt
14. Shalek AK, et al. Single-cell transcriptomics reveals bimodality in expression and splicing in immune cells. Nature. 2013; 498:236–240. [PubMed: 23685454]
15. Patel AP, et al. Single-cell RNA-seq highlights intratumoral heterogeneity in primary glioblastoma. Science. 2014; 344:1396–1401. [PubMed: 24925914]
16. Macosko EZ, et al. Highly Parallel Genome-wide Expression Profiling of Individual Cells Using Nanoliter Droplets. Cell. 2015; 161:1202–1214. [PubMed: 26000488]
17. Methods.
18. van der Maaten L, Hinton G. Visualizing Data using t-SNE. 2008; 9:2579–2605.
19. Ester, M.; Kriegel, H.; Sander, J.; Xu, X. A density-based algorithm for discovering clusters in large spatial databases with noise. Proc. 2nd Int. Conf. Knowledge Discovery and Data Mining (KDD’96); 1996; p. 226-231.
20. Whitfield ML, George LK, Grant GD, Perou CM. Common markers of proliferation. Nat Rev Cancer. 2006; 6:99–106. [PubMed: 16491069]
21. Roesch A, et al. A temporarily distinct subpopulation of slow-cycling melanoma cells is required for continuous tumor growth. Cell. 2010; 141:583–594. [PubMed: 20478252]
22. A first-in-human phase I study of the CDK4/6 inhibitor, LY2835219, for patients with advanced cancer. J Clin Oncol. (available at http://meetinglibrary.asco.org/content/111069-132)
23. Akbani R, et al. Genomic Classification of Cutaneous Melanoma. Cell. 2015; 161:1681–1696. [PubMed: 26091043]
24. Johannessen CM, et al. A melanocyte lineage program confers resistance to MAP kinase pathway inhibition. Nature. 2013; 504:138–142. [PubMed: 24185007]
25. Konieczkowski DJ, et al. A melanoma cell state distinction influences sensitivity to MAPK pathway inhibitors. Cancer Discov. 2014; 4:816–827. [PubMed: 24771846]
26. Garraway LA, et al. Integrative genomic analyses identify MITF as a lineage survival oncogene amplified in malignant melanoma. Nature. 2005; 436:117–122. [PubMed: 16001072]
27. Zhang Z, et al. Activation of the AXL kinase causes resistance to EGFR-targeted therapy in lung cancer. Nat Genet. 2012; 44:852–860. [PubMed: 22751098]
28. Wu X, et al. AXL kinase as a novel target for cancer therapy. Oncotarget. 2014; 5:9546–9563. [PubMed: 25337673]
29. Boiko AD, et al. Human melanoma-initiating cells express neural crest nerve growth factor receptor CD271. Nature. 2010; 466:133–137. [PubMed: 20596026]
30. Hoek KS, et al. In vivo Switching of Human Melanoma Cells between Proliferative and Invasive States. Cancer Res. 2008; 68:650–656. [PubMed: 18245463]
31. Müller J, et al. Low MITF/AXL ratio predicts early resistance to multiple targeted drugs in melanoma. Nat Commun. 2014; 5:5712. [PubMed: 25502142]
32. Li FZ, Dhillon AS, Anderson RL, McArthur G, Ferrao PT. Phenotype switching in melanoma: implications for progression and therapy. Mol Cell Oncol. 2015; 5:31.
33. Hugo W, et al. Non-genomic and Immune Evolution of Melanoma Acquiring MAPKi Resistance. Cell. 2015; 162:1271–1285. [PubMed: 26359985]
34. Nazarian R, et al. Melanomas acquire resistance to B-RAF(V600E) inhibition by RTK or N-RAS upregulation. Nature. 2010; 468:973–977. [PubMed: 21107323]
35. Barretina J, et al. The Cancer Cell Line Encyclopedia enables predictive modelling of anticancer drug sensitivity. Nature. 2012; 483:603–607. [PubMed: 22460905]
36. Fridman WH, Pagès F, Sautès-Fridman C, Galon J. The immune contexture in human tumours: impact on clinical outcome. Nat Rev Cancer. 2012; 12:298–306. [PubMed: 22419253] 37. Carter SL, et al. Absolute quantification of somatic DNA alterations in human cancer. Nat
Biotechnol. 2012; 30:413–421. [PubMed: 22544022]
38. Roadmap Epigenomics Consortium et al. Integrative analysis of 111 reference human epigenomes. Nature. 2015; 518:317–330. [PubMed: 25693563]
39. Markiewski MM, et al. Modulation of the antitumor immune response by complement. Nat Immunol. 2008; 9:1225–1235. [PubMed: 18820683]
40. Wherry EJ. T cell exhaustion. Nat Immunol. 2011; 12:492–499. [PubMed: 21739672]
A
uthor Man
uscr
ipt
A
uthor Man
uscr
ipt
A
uthor Man
uscr
ipt
A
uthor Man
uscr
ipt
41. Chen L, Flies DB. Molecular mechanisms of T cell co-stimulation and co-inhibition. Nat Rev Immunol. 2013; 13:227–242. [PubMed: 23470321]
42. Borghaei H, et al. Nivolumab versus Docetaxel in Advanced Nonsquamous Non–Small-Cell Lung Cancer. N Engl J Med. 2015; 373:1627–1639. [PubMed: 26412456]
43. Motzer RJ, et al. Nivolumab versus Everolimus in Advanced Renal-Cell Carcinoma. N Engl J Med. 2015; 373:1803–1813. [PubMed: 26406148]
44. Rizvi NA, et al. Cancer immunology Mutational landscape determines sensitivity to PD-1 blockade in non-small cell lung cancer. Science. 2015; 348:124–128. [PubMed: 25765070]
45. Van Allen EM, et al. Genomic correlates of response to CTLA-4 blockade in metastatic melanoma. Science. 2015; 350:207–211. [PubMed: 26359337]
46. Wherry EJ, et al. Molecular signature of CD8+ T cell exhaustion during chronic viral infection. Immunity. 2007; 27:670–684. [PubMed: 17950003]
47. Fuertes Marraco SA, Neubert NJ, Verdeil G, Speiser DE. Inhibitory receptors beyond T cell exhaustion. Front Immunol. 2015; 310
48. Baitsch L, et al. Exhaustion of tumor-specific CD8+ T cells in metastases from melanoma patients. J Clin Invest. 2011; 121:2350–2360. [PubMed: 21555851]
49. Martinez GJ, et al. The transcription factor NFAT promotes exhaustion of activated CD8+ T cells. Immunity. 2015; 42:265–278. [PubMed: 25680272]
50. Blackburn, SD.; Shin, H.; Freeman, GJ.; Wherry, EJ. Selective expansion of a subset of exhausted CD8 T cells by αPD-L1 blockade. Proc Natl Acad Sci U S A. 2008. (available at http://
agris.fao.org/agris-search/search.do?recordID=US201301547699)
51. Picelli S, et al. Smart-seq2 for sensitive full-length transcriptome profiling in single cells. Nat Methods. 2013; 10:1096–1098. [PubMed: 24056875]
52. Trombetta JJ, et al. Preparation of Single-Cell RNA-Seq Libraries for Next Generation Sequencing. Curr Protoc Mol Biol Ed Frederick M Ausubel Al. 2014; 107:4.22.1–4.22.17.
53. Li H, Durbin R. Fast and accurate short read alignment with Burrows-Wheeler transform. Bioinforma Oxf Engl. 2009; 25:1754–1760.
54. McKenna A, et al. The Genome Analysis Toolkit: a MapReduce framework for analyzing next-generation DNA sequencing data. Genome Res. 2010; 20:1297–1303. [PubMed: 20644199] 55. Berger MF, et al. The genomic complexity of primary human prostate cancer. Nature. 2011;
470:214–20. [PubMed: 21307934]
56. Cibulskis K, et al. Sensitive detection of somatic point mutations in impure and heterogeneous cancer samples. Nat Biotechnol. 2013; 31:213–9. [PubMed: 23396013]
57. Saunders CT, et al. Strelka: accurate somatic small-variant calling from sequenced tumor-normal sample pairs. Bioinforma Oxf Engl. 2012; 28:1811–7.
58. Ramos AH, et al. Oncotator: cancer variant annotation tool. Hum Mutat. 2015; 36:E2423–9. [PubMed: 25703262]
59. Venkatraman ES, Olshen AB. A faster circular binary segmentation algorithm for the analysis of array CGH data. Bioinforma Oxf Engl. 2007; 23:657–63.
60. Langmead B, Trapnell C, Pop M, Salzberg SL. Ultrafast and memory-efficient alignment of short DNA sequences to the human genome. Genome Biol. 2009; 10:R25. [PubMed: 19261174] 61. Li B, Dewey CN. RSEM: accurate transcript quantification from RNA-Seq data with or without a
reference genome. BMC Bioinformatics. 2011; 12:323. [PubMed: 21816040]
62. Shalek AK, et al. Single-cell RNA-seq reveals dynamic paracrine control of cellular variation. Nature. 2014; 510:363–369. [PubMed: 24919153]
63. Whitfield ML, et al. Identification of genes periodically expressed in the human cell cycle and their expression in tumors. Mol Biol Cell. 2002; 13:1977–2000. [PubMed: 12058064]
64. Campton DE, et al. High-recovery visual identification and single-cell retrieval of circulating tumor cells for genomic analysis using a dual-technology platform integrated with automated immunofluorescence staining. BMC Cancer. 2015; 15:360. [PubMed: 25944336]
65. Skaland I, et al. Comparing subjective and digital image analysis HER2/neu expression scores with conventional and modified FISH scores in breast cancer. J Clin Pathol. 2008; 61:68–71. [PubMed: 17412872]
A
uthor Man
uscr
ipt
A
uthor Man
uscr
ipt
A
uthor Man
uscr
ipt
A
uthor Man
uscr
ipt
66. Konsti J, et al. Development and evaluation of a virtual microscopy application for automated assessment of Ki-67 expression in breast cancer. BMC Clin Pathol. 2011; 11:3. [PubMed: 21262004]
A
uthor Man
uscr
ipt
A
uthor Man
uscr
ipt
A
uthor Man
uscr
ipt
A
uthor Man
uscr
ipt
SUMMARY
Single-cell RNA-seq was applied to thousands of malignant and non-malignant cells derived from metastatic melanomas to examine tumor ecosystems.
A
uthor Man
uscr
ipt
A
uthor Man
uscr
ipt
A
uthor Man
uscr
ipt
A
uthor Man
uscr
ipt
Figure 1. Dissection of melanoma with single-cell RNA-seq
(A) Overview of workflow. (B) Chromosomal landscape of inferred large-scale copy number
variations (CNVs) distinguishes malignant from non-malignant cells. The Mel80 tumor is shown with individual cells (y-axis) and chromosomal regions (x-axis). Amplifications (red) or deletions (blue) were inferred by averaging expression over 100-gene stretches on the respective chromosomes. Inferred CNVs are concordant with calls from whole-exome sequencing (WES, bottom). (C,D) Single cell expression profiles distinguish malignant and non-malignant cell types. Shown are t-SNE plots of malignant (C, shown are the six tumors each with >50 malignant cells) and non-malignant (D) cells (as called from inferred CNVs as in B) from 11 tumors with >100 cells per tumor (color code). Clusters of non-malignant cells (called by DBScan, (17)) are marked by dashed ellipses and were annotated as T cells, B cells, macrophages, CAFs and endothelial cells, from preferentially expressed genes (Fig. S2, Table S2–3).
A
uthor Man
uscr
ipt
A
uthor Man
uscr
ipt
A
uthor Man
uscr
ipt
A
uthor Man
uscr
ipt
Figure 2. Single-cell RNA-seq distinguishes cell cycle and other states among malignant cells (A) Estimation of the cell cycle state of individual malignant cells (circles) on the basis of relative expression of G1/S (x-axis) and G2/M (y-axis) gene-sets in a low-cycling (Mel79, top) and a high-cycling (Mel78, bottom) tumor. Cells are colored by their inferred cell cycle states, with cycling cells (red), intermediate (light red) and non-cycling cells (black); cells with high expression of KDM5B (Z-score>2) are marked in cyan filling. (B) IHC staining (40x magnification) for Ki67+ cells shows concordance with the signature-based frequency of cycling cells for Mel79 and Mel78 (as for other tumors; Fig S4C). (C) KDM5B/Ki67 staining (40x magnification) in corresponding tissue showing small clusters of KDM5B-high expressing cells negative for Ki67 (Fig. S4). (D) An expression program specific to Region 1 of Mel79, identified on the basis of multifocal sampling. The relative expression of genes (rows) is shown for cells (columns) ordered by the average expression of the entire gene-set. The region-of-origin of each cell is indicated in the top panel (Fig. S5).
A
uthor Man
uscr
ipt
A
uthor Man
uscr
ipt
A
uthor Man
uscr
ipt
A
uthor Man
uscr
ipt
Figure 3. MITF- and AXL-associated expression programs vary between and within tumors, and following treatment
(A) Average expression signatures for the AXL program (y-axis) or the MITF program (x-axis) stratify tumors into ‘MITF-high’ (black) or ‘AXL-high’ (red). (B) Single-cell profiles show a negative correlation between the AXL program (y-axis) and MITF program (x-axis) across individual malignant cells within the same tumor; cells are colored by the relative expression of the MITF (black) and AXL (red) programs. Cells in both states are found in all examined tumors, including three tumors (Mel79, Mel80 and Mel81) without prior systemic treatment, indicating that dormant resistant (AXL-high) cells may be present in treatment naïve patients. (C) Mel81 and Mel80 immunofluorescence staining of MITF (green nuclei) and AXL (red), validating the mutual exclusivity among individual cells within the same tumor (Fig. S8). (D) Relative expression (centered) of the AXL-program (top) and MITF-program (bottom) genes in six matched pre-treatment (white boxes) and post-relapse (gray boxes) samples from patients who progressed through RAF/MEK inhibition therapy; numbers at the top indicate patient index. Samples are sorted by the average relative expression of the AXL vs. MITF gene-sets. In all cases, the relapsed samples had increased ratio of AXL/MITF expression compared to their pre-treatment counterpart. This consistent shift of all six patients is statistically significant (P<0.05, binomial test), as are the individual
A
uthor Man
uscr
ipt
A
uthor Man
uscr
ipt
A
uthor Man
uscr
ipt
A
uthor Man
uscr
ipt
increases in AXL/MITF for four of the six sample pairs (P<0.05, t-test; black and gray arrows denote increases that are individually significant or non-significant, respectively). (E) Quantitative, multiplexed single-cell immunofluorescence for AXL expression (y-axis top) and MAP-kinase pathway inhibition (pERK levels, y-axis) in the example cell lines WM88 and MELHO treated with increasing concentrations (x-axis) of either RAF inhibitor alone (dark gray bars) or a combination of RAF/MEK-inhibitors (light gray bars). We observed an increasing fraction of AXL-high cells (top panels) as well as a dose-dependent decrease of p-ERK (bottom panels) (Figs. S11–12 show additional cell lines).
A
uthor Man
uscr
ipt
A
uthor Man
uscr
ipt
A
uthor Man
uscr
ipt
A
uthor Man
uscr
ipt
Figure 4. Deconvolution of bulk melanoma profiles reveals cell-cell interactions
(A) Bulk tumors segregate to distinct clusters on the basis of their inferred cell type
composition. Top panel: heat map showing the relative expression of gene sets defined from single-cell RNA-seq as specific to each of five cell types from the tumor microenvironment (y-axis) across 471 melanoma TCGA bulk-RNA signatures (x-axis). Each column is one tumor and tumors are partitioned into 10 distinct patterns identified by K-means clustering (vertical lines and cluster numbers at the top). Lower panels show, from top to bottom, tumor purity estimated by ABSOLUTE (DNA) and RNA-seq analysis (RNA), specimen location (from TCGA), and AXL/MITF scores. Tumors with high abundance of CAFs are correlated with an increased ratio of AXL-program/MITF-program expression (bottom). (B) Inferred cell-to-cell interactions between CAFs and T cells. Scatter plot compares for each gene (circle) the correlation of its expression with inferred T cell abundance across bulk tumors (y-axis, from TCGA transcriptomes) to how specific its expression is to CAFs vs. T cells (x-axis, based on single-cell transcriptomes). Genes that are highly specific to CAFs in a single cell analysis of tumors (red), but also associated with high T cell abundance in bulk tumors (black border) are candidates for CAF/T cell interactions. (C) 90 samples with 80 tumor
A
uthor Man
uscr
ipt
A
uthor Man
uscr
ipt
A
uthor Man
uscr
ipt
A
uthor Man
uscr
ipt
specimens (black dots) showing a correlation (R=0.86) between C3/CD8 signal by
quantitative immunofluorescence and 10 normal control specimens (grey dots) (Fig. S18A–F shows normalization and additional specimens). (D) Correlation coefficient (y-axis) between the average expression of CAF-derived complement factors shown in (B) and that of T cell markers (CD3/D/E/G, CD8A/B) across 26 TCGA cancer types with >100 samples (x-axis, left panel) and across 36 GTEx tissue types with >100 samples (x axis, right panel). Bars are colored on the basis of correlation ranges as indicated at the bottom.
A
uthor Man
uscr
ipt
A
uthor Man
uscr
ipt
A
uthor Man
uscr
ipt
A
uthor Man
uscr
ipt
Figure 5. Activation-dependent and independent variation in T-cell exhaustion markers (A) Single T cell stratification into CD4+ and CD8+ cells (upper panel), CD25+FOXP3+ and other CD4 cells (middle panel) and their inferred activation state (lower panel, from average expression of the cytotoxic and naïve gene-sets in (B)). (B) Average expression of markers of cytotoxicity, exhaustion and naïve cell states (rows) in (left to right) Tregs, CD4+ T cells, and CD8+ T cells; CD4+ and CD8+ T cells are each further divided into five bins by their cytotoxic score (ratio of cytotoxic to naïve marker expression levels), showing an activation-dependent co-expression of exhaustion markers. Bottom: proportion of cycling cells (calculated as in Fig. 2B). Asterisks denote significant enrichment or depletion of cycling cells in a specific subset compared to the corresponding set of CD4+ or CD8+ T cells (P<0.05, hypergeometric test). (C) Immunofluorescence of PD-1 (upper panel, green), TIM-3 (middle panel, red) and their overlay (lower panel) validates their co-expression. (D) Activation-independent variation in exhaustion states within highly cytotoxic T cells. Scatter plot shows the cytotoxic score (x-axis) and exhaustion score (y-axis, average expression of the Mel75 exhaustion program as in Fig. S21) of each CD8+ T cell from Mel75. In addition to the overall correlation between cytotoxicity and exhaustion, the cytotoxic cells can be sub-divided into highly exhausted (red) and lowly exhausted cells (green) based on comparison to a LOWESS regression (black line). (E–F) Relative expression (log2 fold-change) in high vs. low exhaustion cytotoxic CD8+ T cells from five tumors (x-axis), including 28 genes that were significantly upregulated (P<0.05, permutation test) in high-exhaustion cells across most tumors (E) and 272 genes that were variably associated with
A
uthor Man
uscr
ipt
A
uthor Man
uscr
ipt
A
uthor Man
uscr
ipt
A
uthor Man
uscr
ipt
high-exhaustion cells across tumors (F). Three independently derived exhaustion gene-sets were used to define high and low exhaustion cells (Mel75, (17, 46, 48)), and the
corresponding results are represented as distinct columns for each tumor. (G) Expanded TCR clones. Cells were assigned to clusters of TCR segment usage (black bars; Fig. S23), and cluster size (x-axis) was evaluated for significance by control analysis in which TCR segments were shuffled across cells (grey bars). The percentage of Mel75 cells (y-axis) is shown for clusters of small size (1–4 cells) that likely represent non-expanded cells, medium size (5–6 cells) that may reflect expanded clones (FDR=0.12), and large size that most likely reflect expanded clones (FDR=0.005). (H) Expanded clones are depleted of non-exhausted cells and enriched for exhausted cells. Mel75 cells were divided by exhaustion score into low exhaustion (green, bottom 25% of cells) and medium-to-high exhaustion (red, top 75%). Shown is the relative frequency of these exhaustion subsets (y-axis) in each TCR-cluster group (x-axis, as defined in G), defined as log2-ratio of the frequency in that group compared to the frequency across all Mel75 cells. All values were significant (P<10−5, binomial test).