HAL Id: hal-01770401
https://hal.archives-ouvertes.fr/hal-01770401
Submitted on 20 Feb 2019
HAL is a multi-disciplinary open access archive for the deposit and dissemination of sci-entific research documents, whether they are pub-lished or not. The documents may come from teaching and research institutions in France or abroad, or from public or private research centers.
L’archive ouverte pluridisciplinaire HAL, est destinée au dépôt et à la diffusion de documents scientifiques de niveau recherche, publiés ou non, émanant des établissements d’enseignement et de recherche français ou étrangers, des laboratoires publics ou privés.
Formation of cyanide compounds during preparation of
gold surfaces evidenced by surface-enhanced Raman
spectroscopy
Alexandre Merlen, Cedric Pardanaud, Stéphane Coussin, Christos
Panagiotopoulos, Olivier Grauby, Carmen Ruiz
To cite this version:
Alexandre Merlen, Cedric Pardanaud, Stéphane Coussin, Christos Panagiotopoulos, Olivier Grauby, et al.. Formation of cyanide compounds during preparation of gold surfaces evidenced by surface-enhanced Raman spectroscopy. Journal of Raman Spectroscopy, Wiley, 2018, pp.1-6. �10.1002/jrs.5365�. �hal-01770401�
Carmen M. Ruiz
11Institut Matériaux Microélectronique
Nanoscience de Provence, IM2NP, UMR CNRS 7334, Aix Marseille Université et Université de Toulon, Marseille, France
2Aix‐Marseille Université, CNRS, PIIM
UMR 7345, 13397 Marseille, France
3Aix Marseille Université, CNRS/INSU,
Université de Toulon, IRD, Mediterranean Institute of Oceanography (MIO)|, UM 110, 13288 Marseille, France
4CINaM‐CNRS‐UMR 7325, Campus de
Luminy, F‐13288 Marseille, France
Correspondence
A. Merlen, Institut Matériaux Microélectronique Nanoscience de Provence, IM2NP, UMR CNRS 7334, Aix Marseille Université et Université de Toulon, Marseille, France.
Email: merlen@univ‐tln.fr
Abstract
We report surface‐enhanced Raman spectroscopy (SERS) measurements on nanostructured gold surfaces prepared using a primary vacuum sputtering tech-nique. Even if no molecules have been deposited on the metallic surface, a clear Raman signal is observed. A very intense and sharp peak around 2,100 cm−1 together with low‐wavenumber modes are visible. The comparison between the experimental spectra and those obtained using density functional theory calculations confirms that these new modes are associated with the cyanide compound Au(CN)2−. This proves the high sensitivity of SERS for the chemical
analysis of metallic surfaces. It also shows that the pollution should be carefully taken into account in SERS analysis. We also demonstrate that high power laser illumination transforms these toxic compounds into carbon species; this method can be used to clean SERS substrates.
K E Y W O R D S
cyanide compounds, gold, surface‐enhanced Raman spectroscopy
1 | I N T R O D U C T I O N
Surface‐enhanced Raman spectroscopy (SERS) is an analytical method based on classical Raman spectroscopy associated with optical nano‐antenna.[1] It combines the advantage of Raman spectroscopy, a vibrational spectros-copy with a very low cross section, with the high sensitiv-ity of enhanced optical processes. For most SERS studies, optical nano‐antenna is based on metallic nanostructures with strong plasmonics resonances. It is well established that if the wavelength of the optical excitation corre-sponds to a plasmonic resonance of the metallic nano-structures, a strong enhanced electromagnetic (EM) field is produced in the near field of the antenna. The places where the EM field is enhanced are called hot spots. If a molecule is localized in such a hot spot, which usually
occurs for those with a strong chemical affinity for metal-lic surfaces, its Raman cross section can be increased by several orders of magnitude. This is the basic principle of SERS. The process is so efficient that single‐molecule detection with SERS has been reported.[2–4]In addition, SERS offers several advantages: It is a fast, (acquisition time takes typically a few seconds, a couple of minutes if the signal intensity is low) easy, and nondestructive anal-ysis tool. As a consequence, SERS is now currently used in a large field of applications, notably for the detection of pollutant.[5,6] For instance, for the analysis of ambient air composition, Mosier‐Boss and Lieberman[7]have used an SERS sensor based on silver chemically functionalized substrates mounted on a thermoelectric cooler to detect volatile organic compounds. With their method, they suc-cessfully detected various compounds such as chlorinated
solvents, aromatic compounds, and methyl t‐butylether. Thus, SERS appears as a privileged tool to study air pollution.
Usually, the protocol to perform SERS is divided in 3 steps: (1) preparation of the metallic (usually gold or silver but any metals with plasmonic resonances in the visible can be used) nanostructured substrate, (2) deposition of the molecule on the SERS substrate (most of the time, this process is done by immersion in a low concentration solu-tion followed by a thorough rinsing to remove molecules in excess, and (3) Raman measurement is performed using a classical Raman spectrometer. Surprisingly, even if SERS is regarded as an extremely efficient and sensitive process, most of SERS studies are performed under ambi-ent air conditions. This experimambi-ental procedure has two major drawbacks. First, the metal can be oxidized losing its optical properties. This is particularly true for silver: It is well known that silver SERS substrates must be used immediately after preparation otherwise the chemical degradation of its surface will cause a rapid decrease of the SERS signal.[8] This problem can be avoided using gold, which is more chemically stable compared with silver. Second, in ambient conditions, the substrate can be easily polluted by molecules present in the air. Never-theless, in most cases, molecules studied by SERS have a strong chemical affinity for metallic surfaces and their adsorption removes the possible contaminants. At the end, the SERS signal corresponds to the Raman signature of the molecule, except for specific modes associated with the interaction between the molecule and the metal.
Nevertheless, the question of the SERS signal of the nanostructured metallic surface when no molecules is deposited remains open. In such conditions, polluting mol-ecules should still be present, and indeed, it can be found in scientific forums on the internet discussions about Raman modes observed on blank gold surfaces.1The origin of such
spectral signatures remains unclear and may overlap with compounds of interest while analysis.
In this study, we have performed SERS measurements on a blank gold SERS substrate. Surprisingly, we have observed Raman signature of cyanide compounds. It proves the adsorption on the gold surface of chemical species.
2 | M E T H O D S
Gold nanostructured surfaces were prepared using metallic sputtering under primary vacuum (10−1Pa). We used a Jeol Fine Coat ion sputter JFC–1100 with a voltage of 1.3 kV. The deposition rate was set at 10 nm/min. Before sputtering, the glass slides were washed with alco-hol and we have systematically used gloves to avoid any contamination. A typical picture of a glass side after gold deposition can be seen in Figure 1. Its typical color is between blue and purple.
Raman experiments were performed using a Horiba Jobin Yvon HR800 Raman spectrometer associated with a 600‐lines/mm array. This device gives a spectral resolu-tion better than 0.5 cm−1. SERS measurements were per-formed with a laser power of 0.1 mW for the 633‐nm excitation and 0.35 mW for the 514 nm. The laser spot was focused on the sample surface using a 100× objective (NA: 0.9). The scattered light was collected through the same objective in a backscattering geometry. Time acqui-sition was optimized to ensure a high signal to noise ratio and was typically a few minutes.
DFT calculations were performed using Gaussian09 suit of programs.[9]They were carried out in the DFT for-malism. We used the B3LYP functional and D95V basis set for C and N, whereas LANL2DZ one was used for Au atoms. Au, C, and N atoms of Au(CN)2molecule were
kept free to move whereas those of Au layer were blocked in a monolayer structure, in order, in a first rough approx-imation, to mimic Au surface. The aim of this protocol was to check Au(CN)2bending ability.
1https://www.researchgate.net/post/What_is_the_peak_at_around_2100_
cm‐1_on_a_clean_gold_surface_due_to
FIGURE 1 Typical Raman spectra of blank surface‐enhanced Raman spectroscopy surface (633‐ and 514‐nm excitation) [Colour figure can be viewed at wileyonlinelibrary.com]
300 and 388 cm , and a last mode is visible at 130 cm in the shoulder of the Rayleigh scattering (evidenced in the inset of Figure 1). It must be said that we have observed a remarkable stability and homogeneity of this Raman signature all over the sample. We performed mea-surements on the same sample 4 months later, and the signal was still the same. This point is remarkable as, for SERS measurements (in particular in the case of single‐ molecule detection), strong fluctuations of the Raman signal are usually observed.[10]This is not the case here; the signal is remarkably stable. In addition, we performed this measurement using two Raman spectrometers in different laboratories, and the signal was still the same.
To be sure that we really have an SERS effect, we per-formed Raman measurements using a different excitation wavelength: 514 nm instead of 633 nm. It is established that the EM enhancement of an SERS substrate is strongly related to its plasmonic properties: It is much higher when the excitation wavelength is close to the plasmonic resonance.[11]For gold substrates prepared with our pro-tocol, the resonance is much closer to 633 than 514 nm, which is confirmed by optical absorption measurements (not shown). As a consequence, the EM enhancement should be much higher at 633 nm compared with 514 nm. As can be seen, comparing both excitation wave-lengths in Figure 1, this is exactly what we observed: At 514 nm, the Raman signal, even if it is still present, has a very low intensity. Low‐wavenumber modes are not visible anymore, and only the 2,130 cm−1 peak is still present. This result demonstrates that Raman signal is really coming from an SERS effect. It must be noticed that we also observe a rather strong background with the 514‐nm excitation, this probably comes from the lumi-nescence of gold nanostructures.[12]
The question now is the identification of the chemical species responsible for this SERS signal. Bulk gold has no Raman signal, and the unidentified modes cannot be associated with the vibrational signature of this metal. In the particular case of gold nanoparticles, acoustic modes can be observed at very low wavenumber (typically 35 cm−1 for nanoparticles of 3.2 nm diameter, and the wavenumber downshifts if the diameter increases).[13] This suggests that these modes are coming from a mole-cule present at the surface of the metal.
dioxygen (O2) and nitrogen (N2). The Raman spectrum
of O2has a typical band at 1,550 cm‐1,[14]not present in
our experimental data. N2 has a band at 2,330 cm−1,
neither observed.[15] Therefore, it appears clearly that these two gases are not responsible of the modes observed on the gold surface. As there is no spectral signature between 1100 and 1800 cm−1, it is clear that these modes do not come from carbon soot potentially present in the atmosphere.[16]In addition, it is clearly established that a molecule can give rise to an intense SERS signal only if it has a strong affinity for the metallic surface. As gold has a rather low chemical reactivity, the number of chemical functional groups that can strongly adsorb on its surface is limited. The most commonly used functional group that can react with a gold surface is the thiol func-tion (‐SH). This kind of molecules is extensively used as probe molecules in SERS measurements.[17]In this case, some Raman bands at typically 200–300 cm−1 appear and are associated with the Au–S stretching mode.[18,19] In our measurements, we do not observe such modes. In addition, it is also well known that the molecules with a thiol functional group have strong odors (they are used as additives in the domestic gas to facilitate its detection) and their presence in the air (even in a very low amount) can be easily detected by the experimentalists themselves. It was not the case during our experiments. We can there-fore safely assume that the reported modes cannot be associated with thiol molecules. The other functional groups with an affinity for gold potentially present in the air are those with a nitrogen atom. These various compounds with nitrogen atoms can react with the gold surface to form specific molecules. It has already been shown that the CN functional group can react with gold and the SERS signature of cyanide compounds has already been extensively studied,[20–23] in particular the dicyanoaurate Au(CN)2− molecules.[24–26] In Figure 2,
we compare the DFT calculations of this molecule with our experimental Raman measurements. DFT calcula-tions have been performed with two configuracalcula-tions: first, the free Au(CN)2−molecule and, second, with the same
molecule in interaction with a gold surface. It appears clearly that the molecule remains linear when it is free whereas it is bended when it bends when interacting with the gold surface. This point has already been reported[25]
and is confirmed by our calculations. In this study, Jacobs et al. have also reported the transformation of dicyanoaurate ions to tetracyanoaurate ions Au(CN)4−.
We have here not observed the low‐wavenumber modes associated with this new compound (notably the mode around 500 cm−1); therefore, the transformation does not occur in our measurements.
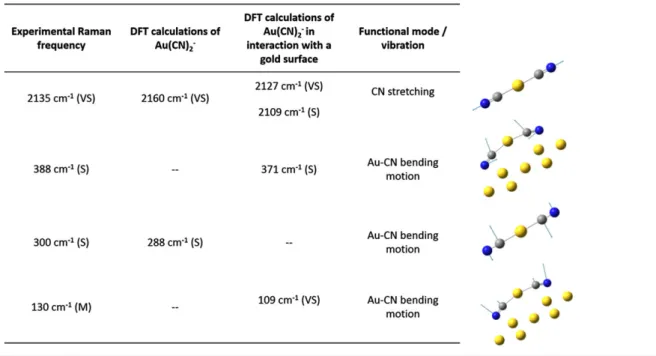
Independent of the dicyanoaurate configuration, we observe a remarkable agreement between the calculations and the experimental spectra. The intense mode around 2,100 cm−1 is notably present for both configurations, even if it is associated with a doublet with the molecule in interaction with a gold surface. The experimental peak at 2,100 cm−1is too broad to determine if it is composed of a doublet or a single mode. The main differences between the two configurations are for the low‐wavenumber modes. For the free molecule, only one mode is observed, which can be associated with the experimental mode at 300 cm−1. For the molecule in interaction with the gold surface, two modes are observed in the low‐wavenumber region: one at 130 cm−1and the other around 390 cm−1. Some much weaker modes are also present in the calculations, but their intensities are too weak to give an observable mode. Thus, with DFT calculations of Au(CN)2−molecules free or in interaction with a gold
sur-face, it is possible to identify all the experimental Raman modes. The fact that we observe both modes from the free and in interaction molecule suggest that we have different sites of adsorption on the gold surface. This is not surpris-ing as the crystallinity of the gold nanostructures pre-pared using our protocol is rather poor and they offer a large variety of such adsorption sites.
The different modes observed and calculated are reported in Table 1. The Raman signal thus originates from this cyanide molecule adsorbed on the hot spots of our SERS substrate. The high EM enhancement makes
them detectable by Raman spectroscopy even if they are present in a very low amount.
The presence of cyanide compounds on gold surfaces could be useful: A recent study performed by Kim et al.[27]have demonstrated that cyanide SERS substrates could be used to detect organic volatile compounds and metal ions. To do so, they proposed to exploit the suscep-tibility of the CN stretching wavenumber of cyanide on Au (around 2100 cm−1). As this mode is spontaneously present in the SERS substrates (and very stable in time), our method could greatly facilitate their protocol. Never-theless, as these molecules are highly toxic, for other applications of nanostructured gold surfaces, it is highly desirable to reduce their amount. To do so, we performed maximum laser power illumination (10 mW with the 633‐nm excitation) of the sample during a few seconds. In Figure 3, we compare the SERS spectrum before and after this illumination. It is obvious that the Raman signal is notably affected. The intensity of 300, 388, and 2135 cm−1 modes has considerably decreased, and new modes between 1100 and 1,800 cm−1 are visible. These new modes are associated with the D and G bands of car-bon species.[28] These features suggest that the cyanide molecules present at the gold surface have been partly degraded in carbon by the high power laser illumination. The catalytic activity of gold nanoparticles could also pro-mote this reaction.[29] This method is thus efficient to reduce the amount of cyanide molecules on the surface. We have also performed SERS measurements using argon atmosphere and the Raman signature from the cyanide molecules rapidly decreased between 100 and 200°C confirming that they can be easily removed from the surface.
The next question is the origin of the cyanide compounds. As these molecules are not present in the air, we can reasonably assume that they are formed
FIGURE 2 Comparison between experimental data and density functional theory (DFT) calculations [Colour figure can be viewed at wileyonlinelibrary.com]
during the sputtering process. It is clear that the use of a primary vacuum does not prevent the presence of organic molecules in the chamber that could react during the sputtering process to form the contaminant molecules on the gold surface.
We performed identical measurements using a different gold evaporator device (EDWARDS Auto 306, pressure: 3.6 10−6 mbar, deposition rate: 0.12 nm/s). A typical Raman spectrum of this new sample can be seen in Figure 4.
Obviously, the SERS signal is totally different. None of the previously observed modes are present, indicating that cyanide compounds are not present anymore. This result confirms that cyanide compounds are formed during the
sputtering process and not as a pollution coming from ambient air, otherwise the signal should be the same whatever the method used for the preparation of the gold surface.
Three modes are now observed: a first one at 1375 cm−1, potentially associated with aromatic azo functions, a sec-ond one at 1560 cm−1, also associated with nitrogen groups, and a broad one, between 2840 and 2960 cm−1 usually associated with C–H functions. The presence of theses modes suggests that once again, nitrogen‐ and carbo‐based molecules are present on the gold surface. In a similar way to the previous sample, if the gold surface
FIGURE 3 Comparison between the Raman spectrum of the gold surface before and after high power laser illumination. Both spectra have been recorded in the same experimental conditions with the 633‐nm excitation
FIGURE 4 Surface‐enhanced Raman spectroscopy spectrum of a different gold surface
Note. DFT = density functional theory; VS = very strong; S = strong; M = medium. ‐‐, Not observed.
is submitted to a high power laser illumination, the mole-cules are transformed into carbon species and the D and G bands are observed (spectrum 514 here). This result proves that this method can be efficiently used to clean an SERS substrate independently of the organic species present at its surface.
In this study, we have demonstrated using SERS that organic molecules with nitrogen functions are formed during sputtering of gold under primary vacuum. For some specific conditions, these molecules can be cyanide compounds. The presence of such molecules should be systematically taken into account for the surface analysis of gold prepared using such protocols. We have also shown that an optical treatment can be used to transform these potentially toxic molecules in carbon species. This study proves the high sensitivity of SERS for the analysis of metallic surfaces.
A C K N O W L E D G E M E N T
The authors would like to thank Petra Hansen (Institute of Energy and Climate Research of Jülich, Germany) for complementary measurements.
O R C I D
A. Merlen http://orcid.org/0000-0002-8453-299X
R E F E R E N C E S
[1] P. G. Etchegoin, E. C. Le Ru, Principles of Surface‐Enhanced
Raman Spectroscopy and Related Plasmonic Effects, Elsevier, Amsterdam, the Netherlands 2009.
[2] C. M. Ruan, W. Wang, B. H. Gu, J. Raman Spectrosc. 2007, 38, 568.
[3] M. V. Canamares, C. Chenal, R. L. Birke, J. R. Lombardi,
J. Phys. Chem. C2008, 112, 20295.
[4] E. C. Le Ru, M. Meyer, P. G. Etchegoin, J. Phys. Chem. B 2006,
110, 1944.
[5] J. Docherty, S. Mabbott, E. Smith, K. Faulds, C. Davidson, J. Reglinski, D. Graham, Analyst 2016, 141, 5857.
[6] O. Péron, E. Rinnert, M. Lehaitre, P. Crassous, C. Compère,
Talanta2009, 79, 199.
[7] P. A. Mosier‐Boss, S. H. Lieberman, Anal. Chim. Acta 2003, 488, 15.
[8] W. Zhang, B. S. Yeo, T. Schmid, R. Zenobi, J. Phys. Chem. C
2007, 111, 1733.
[9] M. J. Frisch, G. W. Trucks, H. B. Schlegel, G. E. Scuseria, M. A. Robb, J. R. Cheeseman, G. Scalmani, V. Barone, B. Mennucci, G. A. Petersson, et al., Gaussian, Inc., Wallingford CT, 2009, Gaussian, Inc., Wallingford CT 2009.
[10] K. A. Bosnick, J. Jiang, L. E. Brus, J. Phys. Chem. B 2002, 106, 8096. [11] A. Merlen, V. Gadenne, J. Romann, V. Chevallier, L. Patrone, J.
C. Valmalette, Nanotechnology 2009, 20, 7.
[12] K. Lin, J. Yi, J. Zhong, S. Hu, B. Liu, J. Liu, C. Zong, Z. Lei, X. Wang, J. Aizpurua, et al., Nat. Commun. 2017, 8, 14891. [13] V. Mankad, P. K. Jha, T. R. Ravindran, J. Appl. Phys. 2013, 113. [14] A. Weber, E. A. Mcginnis, J. Mol. Spectrosc. 1960, 20, 195. [15] R. C. de Boer, P. H. M. van Loosdrecht, H. L. M. Meekes,
J. Cryst. Growth1994, 140, 361.
[16] A. Sadezky, H. Muckenhuber, H. Grothe, R. Niessner, U. Pöschl, Carbon N. Y.2005, 43, 1731.
[17] C. A. Szafranski, W. Tanner, P. E. Laibinis, R. L. Garrell,
Langmuir1998, 7463, 3570.
[18] F. Bensebaa, Y. Zhou, A. Brolo, D. Irish, Y. Deslandes, E. Kruus, T. Ellis, Spectrochim. Acta Part A Mol. Biomol. Spectrosc.
1999, 55, 1229.
[19] G. Cabello, X. Chen, R. Panneerselvam, Z.‐Q. Tian, J. Raman
Spectrosc.2016, 47, 1207.
[20] R. K. Lauridsen, T. Rindzevicius, S. Molin, H. K. Johansen, R. W. Berg, T. S. Alstrøm, K. Almdal, F. Larsen, M. S. Schmidt, A. Boisen, Sens. Bio‐Sensing Res. 2015, 5, 84.
[21] P. Pienpinijtham, X. X. Han, S. Ekgasit, Y. Ozaki, Anal. Chem.
2011, 83, 3655.
[22] P. Fang, J. Li, X. Lin, J. R. Anema, D. Wu, B. Ren, Z. Tian,
J. Electroanal. Chem.2012, 665, 70.
[23] X. Li, A. A. Gewirth, J. Am. Chem. Soc. 2003, 125, 11674. [24] K. U. Von Raben, R. K. Chang, B. L. Laube, Chem. Phys. Lett.
1981, 79, 465.
[25] M. B. Jacobs, P. W. Jagodzinski, T. E. Jones, M. E. Eberhart,
J. Phys. Chem. C2011, 115, 24115.
[26] B. Bozzini, L. D'Urzo, C. Mele, V. Romanello, J. Phys. Chem. C
2008, 112, 6352.
[27] K. Kim, J. W. Lee, K. S. Shin, Analyst 2013, 138, 2988. [28] C. Pardanaud, C. Martin, P. Roubin, Vib. Spectrosc. 2014, 70, 187. [29] D. T. Thompson, NANO 2007, 2, 40.
![FIGURE 1 Typical Raman spectra of blank surface ‐ enhanced Raman spectroscopy surface (633 ‐ and 514 ‐ nm excitation) [Colour figure can be viewed at wileyonlinelibrary.com]](https://thumb-eu.123doks.com/thumbv2/123doknet/13691401.432484/3.892.192.706.73.253/figure-typical-spectra-surface-enhanced-spectroscopy-excitation-wileyonlinelibrary.webp)
![FIGURE 2 Comparison between experimental data and density functional theory (DFT) calculations [Colour figure can be viewed at wileyonlinelibrary.com]](https://thumb-eu.123doks.com/thumbv2/123doknet/13691401.432484/5.892.85.556.59.368/figure-comparison-experimental-density-functional-calculations-colour-wileyonlinelibrary.webp)