HAL Id: hal-02410039
https://hal.archives-ouvertes.fr/hal-02410039
Submitted on 2 Nov 2020
HAL is a multi-disciplinary open access
archive for the deposit and dissemination of
sci-entific research documents, whether they are
pub-lished or not. The documents may come from
teaching and research institutions in France or
abroad, or from public or private research centers.
L’archive ouverte pluridisciplinaire HAL, est
destinée au dépôt et à la diffusion de documents
scientifiques de niveau recherche, publiés ou non,
émanant des établissements d’enseignement et de
recherche français ou étrangers, des laboratoires
publics ou privés.
Part 2: history of desert dust deposition
Stanislav Kutuzov, Michel Legrand, Susanne Preunkert, Patrick Ginot,
Vladimir Mikhalenko, Karim Shukurov, Aleksei Poliukhov, Pavel Toropov
To cite this version:
Stanislav Kutuzov, Michel Legrand, Susanne Preunkert, Patrick Ginot, Vladimir Mikhalenko, et al..
The Elbrus (Caucasus, Russia) ice core record – Part 2: history of desert dust deposition.
Atmospheric Chemistry and Physics, European Geosciences Union, 2019, 19 (22), pp.14133-14148.
�10.5194/acp-19-14133-2019�. �hal-02410039�
https://doi.org/10.5194/acp-19-14133-2019 © Author(s) 2019. This work is distributed under the Creative Commons Attribution 4.0 License.
The Elbrus (Caucasus, Russia) ice core record – Part 2:
history of desert dust deposition
Stanislav Kutuzov1, Michel Legrand2,3, Susanne Preunkert2,3, Patrick Ginot2,3,6, Vladimir Mikhalenko1, Karim Shukurov4, Aleksei Poliukhov5,7, and Pavel Toropov1,5
1Institute of Geography, Russian Academy of Sciences, Moscow, 119017, Russia
2Université Grenoble Alpes, CNRS, IRD, Grenoble INP, Institut des Géosciences de l’Environnement, 38000 Grenoble,
France
3Université Grenoble Alpes, CNRS, IRD, Observatoire des Sciences de l’Univers de Grenoble, Grenoble, 38400, France 4A. M. Obukhov Institute of Atmospheric Physics of Russian Academy of Sciences, Moscow, 119017, Russia
5Faculty of Geography, Lomonosov Moscow State University, Moscow, 119991, Russia
6Observatoire des Sciences de l’Univers de Grenoble, IRD/UGA/CNRS, Grenoble, 38400, France 7Hydrometeorological Research Center of Russian Federation, Moscow, 123242, Russia
Correspondence: Stanislav Kutuzov (kutuzov@igras.ru) Received: 29 April 2019 – Discussion started: 22 May 2019
Revised: 10 October 2019 – Accepted: 26 October 2019 – Published: 22 November 2019
Abstract. Ice cores are one of the most valuable paleo-archives. Records from ice cores provide information not only about the amount of dust in the atmosphere, but also about dust sources and their changes in the past. In 2009, a 182 m long ice core was recovered from the western plateau of Mt Elbrus (5115 m a.s.l.). This record was further ex-tended after a shallow ice core was drilled in 2013. Here we analyse Ca2+concentrations, a commonly used proxy of dust, recorded in these Elbrus ice records over the time period of 1774–2013 CE. The Ca2+ record reveals quasi-decadal variability with a generally increasing trend. Using multiple regression analysis, we found a statistically significant spatial correlation of the Elbrus Ca2+summer concentrations with precipitation and soil moisture content in the Levant region (specifically Syria and Iraq). The Ca2+record also correlates with drought indices in North Africa (r = 0.67, p<0.001) and Middle East regions (r = 0.71, p<0.001). Dust concen-trations prominently increase in the ice core over the past 200 years, confirming that the recent droughts in the Fer-tile Crescent (1998–2012 CE) present the most severe aridity experienced in at least the past two centuries. For the most recent 33 years recorded (1979–2012 CE), significant cor-relations exist between Ca2+and Pacific circulation indices (Pacific Decadal Oscillation, Southern Oscillation Index and Niño 4), which suggests that the increased frequency of
ex-treme El Niño and La Niña events due to a warming climate has extended their influence to the Middle East. Evidence demonstrates that the increase in Ca2+concentration in the ice core cannot be attributed to human activities, such as coal combustion and cement production.
1 Introduction
Atmospheric dust is the most important aerosol emitted to the atmosphere in terms of mass (Knippertz and Stuut, 2014) and impacts. Despite the significance of atmospheric dust and its impacts on the planetary radiation balance, atmospheric chemistry, biosphere and human health (Middleton, 2017), knowledge of its regional variability and long-term trends over past centuries is still poor (Mahowald et al., 2010). Dust concentration in the atmosphere depends on specific meteorological conditions, which may also be influenced by large-scale circulation patterns (e.g. ENSO, NAO). Long-term trends are controlled by changes in precipitation and vegetation cover in dust source regions, with the vegetation cover being dependent on both natural (climatic changes) and anthropogenic (land cover change) causes. The complex-ity of dust emission, atmospheric transport and deposition mechanisms can result in large uncertainties in atmospheric
dust models (Mahowald et al., 2007). The discrepancies be-tween models are partly explained by limited observations of past dust variability, which has limited possibilities for eval-uating models’ capability of reproducing of the dust cycle. However, reliable information on multiannual dust variabil-ity dating back to 1980 is now available from satellite data (e.g. Gautam et al., 2009; Chudnovsky et al., 2017; Li and Sokolik, 2018).
Analyses of recent aerosol patterns over different land and ocean regions show that, despite significant trends over some major continental source regions, average values demon-strate little change in the past three decades (1980–2009) because opposite trends cancel each other out in the global average (e.g. Chin et al., 2014). Recent broad-scale assess-ments of changes in dust emissions show a doubling of the dust deposition in many sedimentary archives since the mid-18th century, which was attributed to anthropogenic land use and short-term climate variability (Hooper and Marx, 2018). Globally, anthropogenic dust sources account for 25 % of emissions, but this value varies and can be considerably higher – up to 75 % in some regions (Ginoux et al., 2012). Climate–aerosol model simulations with the ability to sepa-rate natural and anthropogenic dust sources show that there was a 25 % increase in dust emissions between the 19th century and today. These changes are attributed to climate change (56 %) and anthropogenic land cover change (40 %) although the model underestimates dust concentrations in Asia, the Middle East and the US (Stanelle et al., 2014).
Records of past changes in dust concentrations are essen-tial to better constrain interconnections between dust emis-sions and both natural and anthropogenic environmental changes. In this respect, proxy data are fundamental. Ice cores are natural archives of past concentrations of various impurities present in the atmosphere, including dust (e.g. Legrand and Mayewski, 1997). Beyond dust, these records also grant insight into the strength of the particular dust sources and their changing magnitude through the time. Po-lar ice cores from Greenland and Antarctica reconstruct the changes in dust content in the atmosphere over hundreds thousands of years at a hemispherical scale (e.g. De Ange-lis et al., 1997; Delmonte et al., 2002; Legrand, 1987; Petit et al., 1999; Ruth et al., 2003). In contrast, data from ice cores drilled at mid-latitude mountain glaciers proximal to arid ar-eas reconstruct local- to regional-scale dust aerosol emission histories over shorter timescales (e.g. Grigholm et al., 2015, 2017; Kaspari et al., 2009; Osterberg et al., 2008; Thompson et al., 2000; Bohleber et al., 2018).
Mineral dust from North Africa and deserts of the Mid-dle East is regularly deposited on glaciers in the Caucasus Mountains (Kutuzov et al., 2013). Due to its high elevation (over 5000 m a.s.l.) and proximity to arid and semi-arid ar-eas, the Caucasus are a natural trap for desert dust. The ab-sence of meltwater infiltration near the summit of Elbrus en-sures the preservation of a climatic record in an ice core while high accumulation rates promote greater temporal resolution
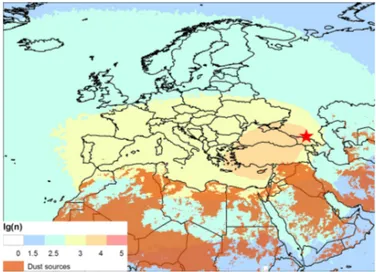
Figure 1. Location of Elbrus (red star) and dust sources (orange polygons) based on Ginoux et al. (2012). Annual NOAA HYS-PLIT_4 10 d backward trajectory density plots for the period 1948– 2013 using NCEP/NCAR Reanalysis. Trajectories were run every 6 h.
(Mikhalenko et al., 2015). A study focusing on the long-term trend of black carbon in the Elbrus ice (Lim et al., 2017) is currently underway as well as several studies investigating additional chemical species, including investigations of cal-cium and of sulfate. Data are discussed in two companion papers including the glaciochemistry of the deep Elbrus ice core drilled in 2009 (Preunkert et al., 2019). Here, we re-port changes in Ca2+concentrations recorded in the Elbrus ice core between 1774 and 2012 CE and connections with natural variability, climatic and land use changes in the dust source regions.
2 Location, climatology and backward air-mass trajectories
The Caucasus are situated between the Black and Caspian seas and generally trend east–south-east, with the Greater Caucasus range often considered as the divide between Eu-rope and Asia. The 2020 glaciers in the Caucasus cover an area of 1193 ± 27 km2(Tielidze and Wheate, 2018). El-brus mountain glaciers contain about 10 % of Caucasus ice volume and cover an area of 112.6 km2 (Kutuzov, et al., 2015) (Fig. 1). Glaciers cover an altitudinal range from 2800 to 5642 m a.s.l. with the coldest conditions present above 5200 m a.s.l., where mean summer air temperature stays be-low 0◦C.
To characterize possible sources of aerosols deposited on glaciers, we calculated three-dimensional backward trajec-tories of air parcels (elementary air particles) arriving at the Elbrus plateau (5100 m a.s.l.) using the NOAA HYS-PLIT_4 trajectory model (Draxler and Hess, 1998; Stein et al., 2015) and NCEP/NCAR Reanalysis data on 2.5◦×2.5◦
grids (Kistler et al., 2001) for the 1948–2013 period. The 10 d backward trajectories were calculated for every 6 h for the whole period, resulting in a total of ∼ 100 k modelled back-ward trajectories. Over this time period, air particle transport is defined by the westerlies. Elbrus glaciers receive air par-ticles which are very likely polluted with aerosols originat-ing in the Mediterranean region: Turkey, eastern and central Europe, the Middle East, North Africa and southern Russia (Fig. 1b).
To identify potential dust source contributions, we also analysed vertical distribution of the backward trajectories. An objective criterion was chosen to extract locations of pos-sible dust entrainment along the trajectories. The criterion is met when the air parcel is close to the ground (i.e. within the well-mixed boundary layer), allowing the uptake of mineral aerosols (Sodemann et al., 2006). Density plots were calcu-lated only for 10 d backward trajectories which descended below mixed layer depth. The depth is calculated by HYS-PLIT_4 (using NCEP/NCAR Reanalysis data) for each point of backward trajectory as the height exceeding potential air temperature over surface air temperature by 2 K (Draxler and Hess, 1998).
3 Methodology 3.1 Ice core analysis
During August–September 2009, an ice core measuring 181.8 m in length was recovered at the western plateau of El-brus in the central Caucasus (43◦20053.900N, 42◦25036.000E; 5115 m a.s.l.). Drilling was performed in a dry borehole with a lightweight electromechanical drilling system. Bore-hole temperatures ranged from −17◦C at 10 m depth to −2.4◦C at 181 m (Mikhalenko et al., 2015). Ice cores were packed in insulated core boxes and shipped in a frozen state to the cold laboratory of the Institute des Géosciences de l’Environnement (IGE) in Grenoble, France, for analyses. A total of 3724 samples were prepared from the surface to a depth of 168.6 m for the Elbrus core. Cores were subsam-pled and decontaminated at −15◦C using the pre-cleaned electric plane tool methodology described by Preunkert and Legrand (2013). After the ice samples were cut using a band saw, all surfaces of the ice samples were cleaned under a clean air bench by using a pre-cleaned electric plane tool over which the ice was slid. Sampling was continuous along the core. To control the decontamination efficiency process, blank ice samples, consisting of ultrapure frozen Milli-Q wa-ter, were preceded regularly.
We determined cations (Na+, K+, Mg2+, Ca2+and NH+4) using a Dionex ICS-1000 chromatograph equipped with a CS12 separator column. For anions, a Dionex 600 equipped with an AS11 separator column was used with an eluent mixture of H2O and NaOH at 2.5 and 100 mM, as well
as CH3OH. A gradient pump system allows the
determina-tion of inorganic species (Cl−, NO−3 and SO2−4 ) as well as short-chain carboxylates (Legrand et al., 2013). For all inves-tigated ions, ice decontamination blanks were insignificant compared to respective concentrations in the ice cores. 3.2 Dating the ice core
Seasonal ice core stratigraphy of chemical parameters and ice core dating based on annual layer counting of the deep Elbrus ice core is described in detail in Mikhalenko et al. (2015). The seasonal oscillations of NH+4and succinic acid allow dat-ing the core with seasonal resolution. Based on the ammo-nium and succinic acid profiles, each annual layer was di-vided into two parts corresponding to snow deposition under winter conditions and spring–summer–autumn conditions (Preunkert et al., 2000; Legrand et al., 2013; Mikhalenko et al., 2015). The annual counting was confirmed with 1-year uncertainty over the last 100 1-years by reference zons from a 1963 tritium peak and the 1912 Katmai hori-zon (Mikhalenko et al., 2015). Though the annual counting becomes less straight forward prior to 1860, Mikhalenko et al. (2015) reported an ice age of 1825 at 156.6 m depth (i.e. 122.3 m water equivalent, m.w.e.). This timescale is consis-tent with the presence of a volcanic horizon at approximately 1833–1840 CE, which can be attributed to the eruption of the Cosigüina volcano in 1835. More recently, Preunkert et al. (2019) extended the annual counting down to 168.5 m depth (i.e. 131.6 m.w.e.) using the ammonium and succinate records demonstrating that the seasonally resolved record ex-tends back to 1774.
Due to the glacier compression with depth, we applied a variable sampling resolution of 10 cm from 0 to 157 m and then a sampling resolution of every 2 cm below 157 m depth. As a result (Fig. 3), the temporal resolution remains relatively consistent throughout the core, with 12 samples per summer over the 1950–2010 CE time period to 14 samples each sum-mer over the 1900–1950 CE time period.
It should be noted that Fig. 2 shows the thickness of an-nual layers and does not represent the linear change in ac-cumulation rate. In order to obtain an acac-cumulation rate, layer thickness must be corrected for any compression which might have occurred following deposition (e.g. Paterson and Waddington, 1984), which is beyond the scope of this paper. In addition, In June 2013 the existing ice record was ex-panded to include the years 2009–2012 CE via a 20.5 m long ice core which was extracted at the same drill site. In total, 515 samples of the firn core were analysed (85 samples per year).
For the 2013 ice core the succinic acid data were not avail-able. We therefore used a combination of NH+4, BC and δ18O profiles for annual counting and seasonal dissection. These results suggest that the 2013 firn core extends back to 2007, as confirmed by the similar patterns of NH+4, Ca2+and δ18O between the first 3.8 m.w.e. of the 2009 core and the 7.2– 10.7 m.w.e. interval of the 2013 core (Lim et al., 2017).
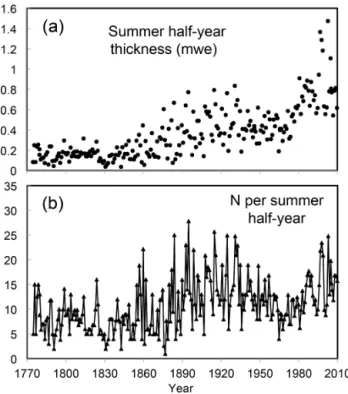
Figure 2. (a) Mean summer half-year thickness along the Elbrus deep ice core. (b) Numbers of samples (N ) spanning summer half-years. See details in Preunkert et al. (2019).
3.3 Climatic data analysis
In order to assess which factors drive the variations in dust content in the Elbrus ice core, we compared the dust concen-trations with various climatic parameters in the potential dust sources. For climate data which may potentially influence the dust emission (temperature, precipitation, wind speed, soil moisture) we used ERA-Interim reanalysis fields for the pe-riod of 1979–2013 CE (Dee et al., 2011). Since the variables used in this study are continuous and normally distributed, the Pearson correlation coefficient was used. The statistical significance of the correlation was checked using Student’s t distribution for probability. The correlations between Ca2+ concentrations in the ice core and each climatological pa-rameter fields were computed.
The Standardised Precipitation-Evapotranspiration Index (SPEI) was selected for use as a drought proxy (Vicente-Serrano et al., 2010) as its capacity for investigating the relationship between dust emission and drought has been well documented (Achakulwisut et al., 2018). We considered SPEI calculated over periods of 1, 2, 3, 6 and 12 months. The time series of SPEI were obtained by averaging over the re-gions of interest.
We also investigated the Ca2+record in relation to vari-ous circulation indices in order to identify the possible fac-tors which influence the dryness in the dust sources and dust transport to the Caucasus Mountains. The following indices were analyzed: North Atlantic Oscillation (NAO), Pacific
Figure 3. NOAA HYSPLIT_4 10 d backward trajectories density plots for the period 1948–2013 for December–February (a), March– May (b), June–August (c), and September–November (d) using NCEP/NCAR Reanalysis. Trajectories were run every 6 h. Only backward trajectories within the boundary layer were considered.
Decadal Oscillation (PDO), Atlantic Multidecadal Oscilla-tion (AMO), Tripole Index (TPI) for the Interdecadal Pacific Oscillation (IPO) and El Niño–Southern Oscillation (ENSO) indexes, Southern Oscillation Index (SOI), Niño 3, Niño 3.4, Niño 4 and Niño 1–2 (https://www.esrl.noaa.gov/psd/gcos_ wgsp/Timeseries/, last access: 8 November 2019). Correla-tions were calculated for periods of 30 years, using 5-year sliding windows. All series were detrended prior to analysis.
4 Results and discussion
The amount of dust in ice cores depends on many factors and corresponds to the presence of dust particles in the atmo-sphere. Primarily, dust emissions are influenced by the char-acteristics of the dust source (soil type, geomorphology, soil moisture) as well as by meteorological conditions (surface winds). Once dust clouds are uplifted to the mid-troposphere, their transport depends on the main circulation patterns. In mountainous areas with high snow accumulation, wet de-position defines annual and seasonal aerosol concentrations. During spring and summer, the majority of air masses arrive to the Elbrus site from arid areas with calcareous soils. If all of the Ca2+in the Elbrus ice core is assumed to be of natural origin, then Ca2+concentrations can be considered a proxy for dust.
The total dust deposited at Mt Elbrus may have three different natural components: (i) dust from local sources (nunataks, rock outcrops), (ii) sporadic arrival of large ae-olian desert dust events and (iii) large-scale background con-tinuous terrigenous aerosol emissions. Apart from regions
strongly impacted by sea-salt aerosols, the presence of cal-cium in aerosols in continental atmospheres is expected to mainly originate from exposed continental sediments. Even in polar regions (Antarctica or Greenland), calcium in ice mainly comes from dust where only a small fraction is related to sea salt emitted from the ocean (De Angelis et al., 1997; Legrand, 1987). Assuming that Na+ present in the Elbrus melted ice samples is only related to sea-salt emissions and considering the [Na+] / [Ca2+] ratio of 0.038 in seawater, we conclude that only 1.0 ± 0.7 % in summer (1.40 ± 1.0 % in winter) of total Ca2+ may be attributable to sea-salt emis-sions. That percentage is clearly an upper limit since – in precipitation deposited at continental free-tropospheric sites (e.g. Legrand, 2002) – Na+ is not only related to sea salt due to the presence of leachable sodium in aluminosilicate particles but also Na+from halide evaporates present in the deserts.
The volcanic rocks of Elbrus near the drilling site do not contain calcite; therefore, we can assume that Ca2+present in the Elbrus ice archives information on past dust emissions, including continuous background emissions and large dust plumes reaching the site. In the following sections, we at-tempt to separate these two possible calcium sources. 4.1 Calcium concentrations during desert dust events
and background conditions
The majority of the calculated backward trajectories show a south-west origin with the highest frequency over the Middle East, eastern Mediterranean and North Africa in all seasons. In winter (December–February), air masses tend to come from more remote locations, whereas summer (June–August) reveals possible transport from the Caspian Sea region and southern Russia (Fig. 3).
Large dust plumes reach the Caucasus Mountains, which originate from the Middle East – and less frequently from the Sahara (Kutuzov et al., 2013). As seen in the Alps, these events impacts the chemistry of snow deposits to cre-ate calcium-rich alkaline snow layers (Wagenbach et al., 1996). Deposition of these plumes increases the concentra-tions of numerous chemical species in Alpine ice due to ei-ther their presence in the dust at its emission stage or, being acidic, their interaction with alkaline material during trans-port (Usher et al., 2003). Deposition of light-absorbing im-purities (in particular black carbon and dust) plays an impor-tant role in changes in the snow and glaciers and enhances the response of the mountain cryosphere to climate changes via snow–albedo feedbacks (Ginot et al., 2014; Gabbi et al., 2015; Di Mauro et al., 2017; Skiles et al., 2018).
In this work, as well as in Preunkert et al. (2019), Elbrus samples are considered to be impacted by dust events if two criteria are met: (1) they contain more than 120 ppb of cal-cium and (2) they fall below the 25 % quartile of a robust spline calculated through the raw acidity profile. These se-lection criteria result in 616 dust deposition summer samples
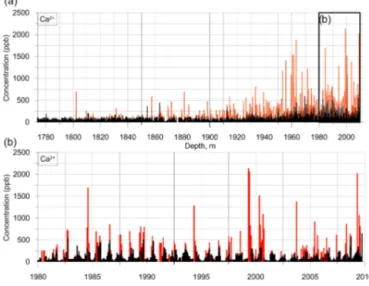
Figure 4. (a) Total (red) and background (black) Ca2+ concentra-tions (ppb) in Elbrus ice core samples. The full record (a) and the upper section of the ice core (b) are shown. Note that the back-ground concentration values reflect removal of samples which were found to have been influenced by large dust deposition events.
(from a total of 2524) and 67 winter samples (from a total of 1150). Similar results were obtained when changing the cal-cium concentration criteria from 120 ppb to 100 or 140 ppb.
Using ammonium and succinate stratigraphy to separate the winter and summer seasons (Sect. 3.2), we determined half-year summer and winter means from 1774 to 2010 CE (Fig. 4). In Fig. 5, we report the seasonal cycle of calcium and ammonium averaged over two different periods of the 20th century (1900–1950 and 1950–2010 CE).
The mean concentration of Ca2+was 145 ppb with a maxi-mum of 5506 ppb. Most of the dust from long-distance trans-port is deposited on Elbrus during warm seasons. The av-erage background summer Ca2+concentration was 103 ppb compared to 44 ppb in winter layers. Most of the large dust deposition events also occur during the warm season, which further increases the difference between summer (178 ppb) and winter (54 ppb) layers (Table 1).
As seen in Fig. 6, most of long-term calcium trend is de-tected in summer with (1) more frequent arrivals of large dust events after 1950 and (2) an increase of 100 ppb of the calcium background level after 1950. The maximum annual concentrations were found in 1999 and 2000 annual layers (980 and 850 ppb). There was a pronounced period of in-creased dust content in the 1960s with a following decrease in late 1970s. When compared to the background, excep-tional peaks occurred during the following years: 1802, 1957, 1863, 1917, 1933, 1963, 1984, 1989, 1999, 2000, 2008 and 2009.
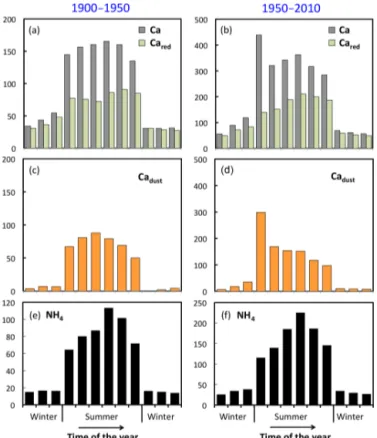
Figure 5. (a) Averaged concentrations of calcium and ammonium (used for determining seasonality as described in the text) over 1900–1950 CE (a, c, e) and 1950–2010 CE (b, d, f). Total calcium concentrations are the grey bars in the top panels, while calcium concentrations calculated after the removal of samples are in red. The middle panels refer to calcium concentrations corresponding to the dust fraction (i.e. [Ca2+] − [Ca2+red], orange bars). Note that the equidistant binning of the summer and winter layers applied in order to derive these 12 values per year does not necessary corre-spond to monthly means. This would only be the case if there were an absence of seasonality in precipitation. Nevertheless, the figure clearly illustrates the occurrence of a dust-related calcium peak at the beginning of the summer season.
Table 1. Ca2+ concentrations in Elbrus ice cores from different periods – including total concentrations and excluding background samples from the large dust deposition events.
Period Ca2+concentration (ppb)
Summer Summer Winter Winter (total) (background) (total) (background)
1774–1800 65 64 42 42 1800–1850 78 69 52 46 1850–1900 100 69 43 36 1900–1950 156 83 37 33 1950–2000 344 181 75 58 2000–2012 439 212 99 64 1774–2012 172 103 54 44
Figure 6. Total and background (grey lines) Ca2+concentrations in the Elbrus ice core during summer and winter. The 5-year moving averages are shown as black lines.
4.2 Increasing frequency of desert dust events
Warm season layers contain an increase in Ca2+ through-out the duration of the investigated time period. The most pronounced increase in peak Ca2+ concentrations occurred after the 1950s (Fig. 6). It is important to emphasize that this appearance of more frequent calcium peaks after 1950 (compared to the preceding decades) cannot be attributed to a decreasing time resolution of the record (e.g. via smooth-ing of events with depth) (Fig. 2). More specifically, the en-hanced occurrence of summer calcium peaks between 1960 and 1970 compared to 1950–1960 CE does not correspond to a significant decrease in the temporal resolution (from 9 sam-ples over the 1960–1970 years compared to 11–12 samsam-ples over the 1950–1960 years).
In recent decades (1950–2010 CE), over which time pe-riod more dust events were detected in the Elbrus ice, a clear spring maximum of the dust fraction is observed (Fig. 5). These dust peaks are consistent with the timing of the ar-rival of large dust plumes at the site (Kutuzov et al., 2013). A major long-range dust outbreak event recently occurred over North Africa, as well as the eastern Mediterranean and Cau-casus on 22 and 23 March 2018 (Solomos et al., 2018), which resulted in significant dust deposition on glaciers.
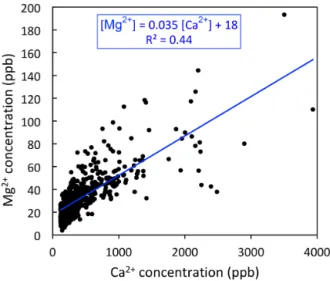
Figure 7. Magnesium versus calcium concentrations (in ppb) in dust ice samples from Elbrus.
The calcium peaks in Elbrus ice containing dust are ac-companied by an increase in magnesium (Fig. 7). Interest-ingly, the mean [Mg2+] / [Ca2+] ratio in Elbrus samples con-taining dust (0.035, Fig. 7) is similar to those in atmospheric dust aerosols from the Sahara or Middle East. For instance, Koçak et al. (2012) reported dust-event-related aerosol con-centrations of sodium, magnesium and calcium from two eastern Mediterranean sites: in Erdemli, Turkey, with dust arriving from the Middle East and from Heraklion, Crete, with dust from the Sahara. Importantly, the atmospheric con-centrations of these cations also correspond to their water-soluble fraction (not the total fraction) – which were mea-sured with ion chromatography – much like in the Elbrus ice core. In the case of Erdemli, during Middle East dust events, Koçak et al. (2012) reported atmospheric concentra-tions of 7085 ng m−3 for Ca2+ and 423 ng m−3 for Mg2+ (Table 2). Since Erdemli is located at 22 m above sea level and is situated 10 m away from the sea, a fraction of mag-nesium originates from sea salt in addition to the leachable fraction of magnesium from dust. To correct concentration from the sea-salt contribution, we have used the Na+ concen-tration (1148 ng m−3) and assumed a mean [Na+] / [Ca2+] ratio in dust of 0.08 as observed in Elbrus ice samples con-taining dust (not shown). Thus, neglecting the sea-salt cal-cium contribution, we estimate a dust sodium contribution of 567 ng m−3 (0.08 × 7085 ng m−3). With that, and using the [Mg2+] / [Na+] ratio in seawater (0.12), we estimate that 70 ng m−3 of magnesium originated from sea salt and cal-culate a [Mg2+] / [Ca2+] ratio for dust aerosol close to 0.05 (Table 2). A similar value is obtained for aerosol at Heraklion during a Saharan dust event (0.043, Table 2). The content of Mg2+in Elbrus samples impacted by dust is therefore very consistent with what is observed in atmospheric aerosol from the eastern Mediterranean region during dust events.
4.3 Enhanced background concentrations
Figure 6 demonstrates an increase in the calcium background concentrations after 1950. This increase may be influenced by human activities, such as coal combustion and cement production, thereby contributing to the background calcium trend detected in the Elbrus ice. Similar impacts of anthro-pogenic emissions on various species in natural dust emis-sions (including calcium) were reported by Kalderon-Asael and colleagues (2009); this demonstrates that, under strong stratification in the lower atmosphere in Israel, part of the atmospheric calcium may be anthropogenic in nature. At the scale of Europe, Lee and Pacyna (1999) estimated that 0.8 Tg of anthropogenic calcium is emitted per year, with coal com-bustion contributing 60 % and cement contributing 30 % of the total. However, to date, these anthropogenic calcium emissions remain 1 order of magnitude weaker than dust calcium emissions from north-eastern Africa (12 Tg yr−1) or west Asia (12.7 Tg yr−1) (Zhang et al., 2015).
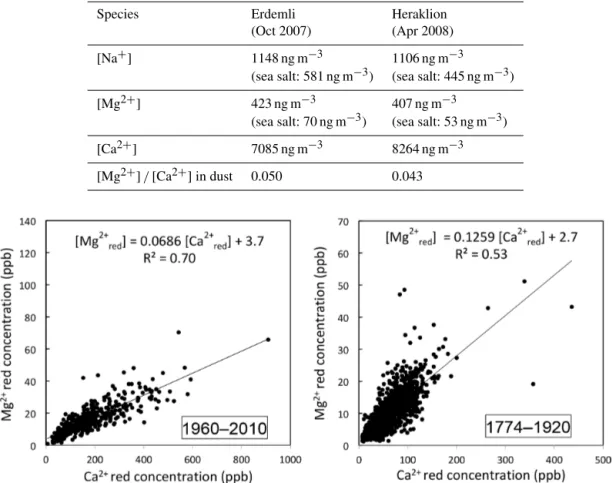
Particles emitted during both coal combustion and cement production are rich in calcium (calcite). Therefore, we may expect a weaker [Mg2+] / [Ca2+] ratio in particles emitted by these anthropogenic processes compared to that in nat-ural dust particles. Examination of Mg2+ and Ca2+ in El-brus ice layers that are not impacted by dust events helps to determine a possible contribution of anthropogenic ac-tivities to the increasing background calcium trend in El-brus ice. As seen in Fig. 8, the [Mg2+red.] / [Ca2+red.]
ra-tio in Elbrus summer ice is of 0.069 overs 1960–2010 com-pared to 0.126 over 1774–1920. If we attribute this recent decrease in [Mg2+red.] / [Ca2+red.] to a growing impact over
the recent decades of calcium from cement (neglecting the presence of soluble magnesium in cement), the mean in-crease in Mg2+red.level (10.8 ppb over the 1774–1920 years
and 17.6 ppb over the 1960–2010 years) would lead to a Ca2+red.increase of 55 ppb from 1774–1920 to 1960–2010.
This value is half of the observed Ca2+red.increase between
the two time periods (71 ppb over 1774–1920 and 183 ppb over 1960–2010). These calculations suggest that half of the observed increase in background calcium concentration af-ter 1950 is attributable to anthropogenic activities. As seen in Fig. 9, even prior to 1950 the [Mg2+red.] / [Ca2+red.]
ratio sometimes dropped to values as low as 0.1 or less (around 1820, 1850, 1865 or 1908). Although the time pe-riod 1940–1950 has a low ratio (0.09), the calcium con-centrations moderately increased (27 ppb; less than a third of the overall increase after 1950). Figure 9 suggests that a decrease in the [Mg2+red.] / [Ca2+red.] ratio is not
al-ways associated with enhanced calcium levels but that en-hanced magnesium levels also lead to an enhancement of the [Mg2+red.] / [Ca2+red.] ratio. For instance, over 1853–1861,
a mean [Mg2+red.] / [Ca2+red.] ratio of 0.22 occurs at the
same time as a relatively high Mg2+red.level (16 ppb instead
Table 2. Composition of aerosol collected at Erdemli during dust events from the Middle East and at Heraklion during dust events from the Sahara (from Koçak et al., 2012). The magnesium sea-salt contributions were calculated via the Na+content after subtracting its dust contribution, which was calculated as 0.08 times the Ca2+content (see text).
Species Erdemli Heraklion (Oct 2007) (Apr 2008) [Na+] 1148 ng m−3 1106 ng m−3
(sea salt: 581 ng m−3) (sea salt: 445 ng m−3) [Mg2+] 423 ng m−3 407 ng m−3
(sea salt: 70 ng m−3) (sea salt: 53 ng m−3) [Ca2+] 7085 ng m−3 8264 ng m−3 [Mg2+] / [Ca2+] in dust 0.050 0.043
Figure 8. [Mg2+red.] versus [Ca2+red.] in individual Elbrus ice summer samples (not impacted by dust events) over the recent decades (left) and prior to the 1950 increase in calcium.
De Angelis and Gaudichet (1991) presented additional ev-idence to suggest that cement production and use (despite its growing impact) does not represent the dominant contribu-tion to background calcium levels at Elbrus derived in their study of calcium and aluminium at the Col du Dôme site, Mont Blanc, France. The authors demonstrate that the in-crease in both dust arrival frequency in the 1980s and the background dust levels occurred without any coinciding de-crease in the aluminium to calcium ratio. Given the low alu-minium content of cement as compared to desert dust, these observations suggest that the Col du Dôme site is not sig-nificantly impacted by the growing use of cement. We may expect that this impact is even weaker at the Elbrus site. 4.4 Climatic factors
Two major dust sources contribute mineral particles to the Elbrus glaciers: the Sahara and the Middle East. It was es-tablished that a majority of the small-scale dust sources in the Middle East are located in northern Mesopotamia (north-ern Syria–north-west(north-ern Iraq) and the Syrian Desert
(Kutu-zov et al., 2013). The Levant is a major source of atmospheric dust (Middleton, 1986) with natural, anthropogenic and hy-drological (intermittent streams and lakes) sources. The area between the Tigris and the Euphrates in Iraq contains natu-ral desert dust sources, while the Nineveh region in Iraq was recently identified as the most active dust source in the Mid-dle East (Moridnejad et al., 2015). In the northern Sahara, strong sporadic dust storms originating in the Libyan desert and the foothills of the Hoggar Mountains in eastern Algeria sometimes reach the Caucasus in the spring (Kutuzov et al., 2013).
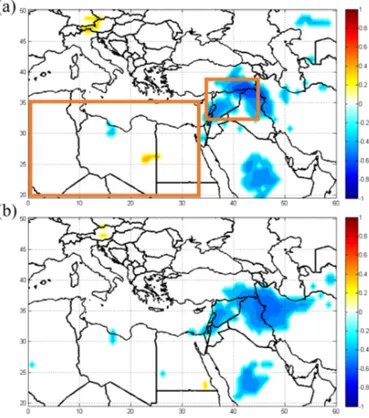
A statistically significant spatial correlation occurs be-tween Ca2+and precipitation as well as between soil mois-ture content in the Middle East (Fig. 10). Unlike in the Mid-dle East, no spatial correlation was found between Ca2+ and the amount of precipitation in North Africa. However, it should be noted that the observation network is very sparse in the arid areas, and there are much larger uncertainties in Global Precipitation Climatology Centre (GPCC) data sets in North Africa.
Figure 9. Individual summer means of background levels of Ca2+, Mg2+and of the [Mg2+red.] / [Ca2+red.] mass ratio along the El-brus ice cores.
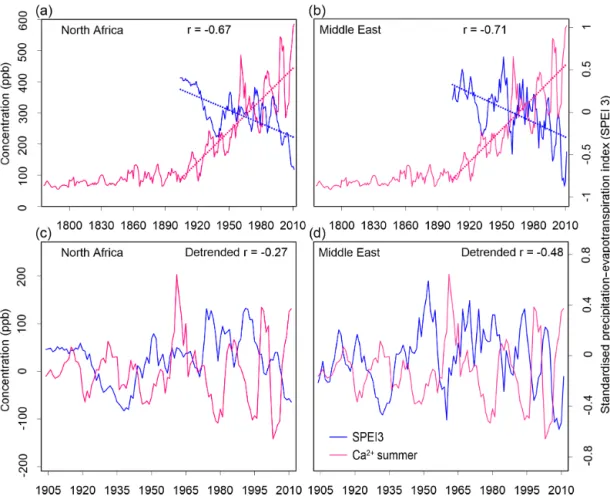
The Ca2+record was also compared with drought indices in potential dust sources in the Middle East (32–37◦N, 38– 45◦E) and in North Africa (20–35◦N, 0–35◦E) (Fig. 10). Ca2+ significantly correlates with drought indices for both regions. The highest correlations were found for the SPEI3 index, which is determined by aridity over the three pre-vious months. The correlation coefficient for the Middle East is statistically significant (p<0.001) and reaches −0.71. The correlation remains significant after trend removal (r = −0.48, p<0.001, for 1904–2012 CE and −0.63, p<0.001, for 1970–2012) (Fig. 11b, d). Periods of dryer conditions in the Middle East region coincide with the increased Ca2+ con-centrations and vice versa. During the period of droughts in both regions, a greater amount of mineral particles is emit-ted into the atmosphere and transporemit-ted to Caucasus glaciers during the spring and summer. The general increasing trend in dust content corresponds to negative trends in precipitation and increased dryness of the soil.
Ca2+correlates significantly with the SPEI3 drought index for the North African region (r = 0.67, p<0.001), but most of the correlation is defined by similar tendencies in two se-ries. Drier conditions at the dust source region correspond to a positive trend in dust concentrations in the Elbrus ice core. The correlation weakens for the full detrended series (r = 0.27, p<0.05) and increases in the later period, reach-ing 0.73 (p<0.001) in 1970–2012 CE (Fig. 11a, c). Large portions of the annual dust flux in Elbrus can be deposited
Figure 10. Spatial correlation of Elbrus Ca2+concentrations with soil moisture (a), and precipitation (b) ERA-Interim from 1979 to 2013. North African and Middle Eastern domains are shown by or-ange boxes.
during a single strong deposition event. Such events are more often associated with dust transport from the Sahara (Kutu-zov et al., 2013). Dust emitted from North Africa can also mix with dust from Middle Eastern sources during transport (Shahgedanova et al., 2013).
As evidenced by the Elbrus ice core record, the frequency of dust events and total Ca2+concentrations has increased, and the most notable trend occurs after the 1950s. This in-crease corresponds with the recent analysis of centennial climate change trends in Africa which depict a significant northward expansion of the Saharan desert in the winter (Thomas and Nigam, 2018). The desert conditions are ob-served across larger territories in recent years and are asso-ciated with a slightly negative trend in winter precipitation and an increase in surface air temperatures. In coastal North Africa, dry conditions dominated and rainfall decreased since the 1980s (Nicholson et al., 2018). The number of dust days in the eastern Mediterranean increased over the period 1958– 2006 CE (Ganor et al., 2010).
Two periods of maximum Ca2+concentrations in the ice core correspond to the two most severe drought episodes in the Middle East since the1940s and occur during 1998–2000 and 2007–2009 CE (Barlow et al., 2016). The significant pre-cipitation decline (up to 70 %) during these years is explained by the dominance of high-pressure systems over the eastern
Figure 11. Ca2+and Standardised Precipitation-Evapotranspiration Index (SPEI3) averaged over the regions of (a, c) North Africa (20– 35◦N, 0–35◦ E) and (b, d) the Middle East (32–37◦N, 38–45◦E). Outlines of the regions are presented on Fig. 10. Detrended records are shown at the bottom graphs.
Mediterranean during the winter and spring months (Trigo et al., 2010).
Our findings are supported through analysis of the fre-quency of droughts in Syria. For the period between 1961 to 2009 CE, droughts were observed in 25 of the exam-ined years, resulting in ∼ 40 % of the years being classi-fied as drought years. On average, droughts lasted 4.5 years, although in the 1970s a single drought lasted 10 years (Breisinger et al., 2011). Droughts lasting 2 or more years significantly impacted agricultural production and livestock in the north-east of the country, where a single drought in 1961 resulted in the loss of 80 % of camels and 50 % of sheep. During the drought of 1998–2001 CE, 329 000 people of which 47 000 were nomadic families were forced to elimi-nate livestock numbers and experienced an acute shortage of food (De Châtel, 2014).
Anthropogenic land use and changes in land cover im-pact the soil erodibility and dust emission. The magnitude of such impacts is highly uncertain as both climatic and anthro-pogenic processes occur simultaneously (Webb and Pierre, 2018). Unsustainable agricultural practices, overgrazing and deforestation may significantly increase the area of the dust
sources. It should be noted that only around 5 % of the land in North Africa and the Middle East is suitable for agriculture; the rest consists of pastures, forests, shrubs, urban zones, badlands, rocky areas, and deserts (Sivakumar and Stefanski, 2007).
4.4.1 Atmospheric circulation patterns
The general increase in dust concentrations in the Elbrus ice core is accompanied by a quasi-decadal variability. The re-lationship of precipitation in the Middle East region to the different large-scale circulation patterns is summarized in a recent review of the droughts in the Middle East and south-western Asia (Barlow et al., 2016, and references therein). The precipitation and occurrence of droughts in the Middle East region may be influenced by several major climatic fea-tures such as the NAO, south-west Asian and Indian mon-soon, global-scale variability associated with ENSO and state of the western Pacific which together determine the strength of the general atmospheric circulation (Barlow et al., 2016).
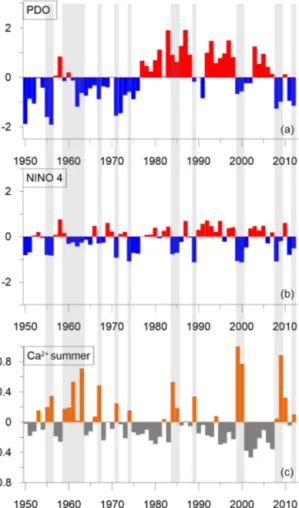
For the 33 year time period (1979–2012), significant cor-relations exist between Ca2+ and PDO, SOI and Niño 4 in the preceding winter period (Table 3). A significant
cor-Figure 12. PDO (a), Niño 4 indices (December–June aver-age) (b), and normalized Ca2+ record (c). Grey shading indi-cates years when high dust concentrations coincided with negative Niño 4 phases.
relation (r = 0.47, p<0.01) for the Niño 4 index also ex-ists for December–June in 1948–2012. The relationship be-tween dust concentrations and circulation indices of the Pa-cific Ocean is illustrated by the spatial correlation of Ca2+ with sea surface temperatures (Supplement Fig. S1). A to-tal of 23 out of 47 years of high dust deposition recorded in the Elbrus ice core coincide with negative Niño 4 phases in 1900–2012 CE. After the 1950s, 19 out of 23 years of in-creased dust concentration correspond to the negative Niño 4 and negative PDO (Fig. 12). No statistically significant cor-relation was found between the dust in the Elbrus ice core and the NAO index. Ca2+also correlates with the SOI of the preceding autumn and winter (November–January) over the last 50 years. It is still unclear whether circulation in the Pa-cific played a significant role in the precipitation patterns in these dust source regions before the mid-20th century or not. The uncertainties in reanalysis data in this period are large and therefore do not allow us to draw any conclusions about the stability of the revealed correlations in time.
Table 3. Correlation coefficient of the Elbrus Ca2+data and large-scale atmospheric circulation indices.
1948–2012 1979–2012 PDO (Dec–Jun) −0.35 −0.42 SOI (Oct–Jan) 0.40 0.49 Niño 4 (Dec–Jun) −0.47 −0.57
A significant negative correlation was found between at-mospheric dust concentrations in Syria and the PDO in springtime during 2003–2015 CE. It was shown that a pos-itive geopotential height anomaly is formed over the Ara-bian Peninsula and North Africa during the positive phases of PDO (Pu and Ginoux, 2016). A positive PDO is char-acterized by an increase in cyclonic activity over the north-ern Pacific and northnorth-ern Atlantic, which occurs together with the intensification of subtropical anticyclones. Despite an in-crease in geopotential height, the positive PDO inin-creases the probability of moisture transport to North Africa and Mid-dle Eastern regions in the spring (Dai, 2013; Pu and Ginoux, 2016). This moisture is due to increased advection from the Mediterranean Sea which causes deep convection due to un-stable stratification in the lower troposphere. The negative PDO phases on the other hand are associated with a nega-tive geopotential height anomaly in the middle troposphere over the Mediterranean and the Middle East and cyclonic activity in the region. Low-pressure anomalies over Europe, the southern Arabian Peninsula, and north-eastern to eastern Africa create favourable conditions for westerly winds from North Africa and increase the probability of dust transport to the Caucasus.
Studies of interannual decadal variability of dust activity in the Arabian peninsula and Fertile Crescent suggest that the occurrence of severe droughts and increased dust emis-sion were influenced by the La Niña phase amplified by the negative PDO (Notaro et al., 2015). There are still large un-certainties in such connections due the lack of long-term ob-servations (Pu and Ginoux, 2016). The correlation between Pacific circulation indices and the amount of dust in the El-brus ice core supports these previous findings and may indi-cate an increase in the frequency of extreme El Niño and La Niña events with climate warming (Cai et al., 2015), which can then influence circulation over the Pacific Ocean and ex-tend to the Middle East.
Our results are also in line with previous conclusions about the possible influence of large circulation patterns on the aridity of the tropics. Dai (2011) suggests that the El Niño– Southern Oscillation, tropical Atlantic sea surface tempera-ture (SST) and Asian monsoons played a significant role in the increase in global aridity since the 1970s over Africa, southern Europe, East and South Asia, and eastern Australia while recent warming has increased atmospheric moisture demand contributing to the drying. It is expected that due to
anthropogenic climate change the tropical belt may expand toward the poles and shift precipitation patterns, which ul-timately will lead to an increase in the territory affected by droughts (Seidel et al., 2008). Model studies show that un-der global warming the large-scale circulation systems (jet streams and storm tracks) may shift poleward (Mbengue and Schneider, 2017). The size and intensity of the Hadley cell and the associated shift of the subtropical anticyclone zone are likely to occur over the 21st century, which should primarily affect the precipitation regime in subtropical lati-tudes (Lu et al., 2007). An expansion of the global tropics since 1979 by 1 to 3◦latitude was identified in both hemi-spheres, although the mechanisms behind this tropical ex-pansion are still unclear (Lucas et al., 2014).
4.5 Comparison to other paleo-records
The first record of dust deposition history in the Caucasus was obtained by Davitaya in 1962 (Davitaya, 1969). This work was based on sampling of the firn layers from a crevasse located at the Kazbek plateau (4600 m a.s.l.). Based on dust layer counting Davitaya estimated that sampled firn layers covered the period between 1793 and 1962. Dust concentra-tions clearly increased by a factor of 3 since the late 1920s. This increase was attributed to various reasons, including local dust influence due to glacier retreat, industry devel-opment, fires, World War II and volcanic activity. Despite different methodology and location, we qualitatively deter-mined a similar long-term dust trend in the Elbrus ice core record. The average Ca2+concentration over the same peri-ods increases by a factor of 2.5 from 88 ppb in 1793–1925 CE to 224 ppb in 1925–1962 CE.
An overall increasing trend in dust content and Ca2+ ex-ists in Colle Gnifetti (Alps) ice cores after 1870 (Thevenon et al., 2009). Unlike in the Elbrus Ca2+records, no significant long-term trend over the past 300 years exists in the Alps (Bohleber et al., 2018). In Central Asia, negative trends in dust concentrations were found in ice cores in the Tien Shan (Grigholm et al., 2017) and in the Tibetan Plateau (Grigholm et al., 2015). After the 1950s, calcium concentrations and multiannual and decadal variability significantly decrease in both Central Asian regions due to changes in dust storm fre-quency in arid areas related to regional trends in reduced zonal wind strengths (Grigholm et al., 2015).
A review of the dust paleo-records demonstrates that 16 of the 25 compiled sedimentary archives from across the globe depict a doubling in dust emissions over the past ∼ 250 years which was attributed to the impact of anthropogenic activ-ity in source regions (Hooper and Max, 2018). Previous esti-mates for the atmospheric dust variability also suggests that desert dust doubled during the 20th century with some ex-ceptions (Mahowald et al., 2010). All of the existing regional and global estimates of atmospheric dust variations in the past have large uncertainties due to limited and unevenly dis-tributed paleo-data records, which is especially true for the
important dust sources of the North Africa, East Asia and the Middle East/Central Asia (Mahowald et al., 2010). Tree ring reconstructions of the June–August drought variability over the past 900 years in the Mediterranean revealed that 1998– 2012 CE was the driest period in the Levant since the 12th century (Cook et al., 2016). Similarly, the latter half of the 20th century was found to be one of the driest in the last nine centuries in north-western Africa (Touchan et al., 2011).
Information about variations in dust concentrations over the Caucasus leads to a better understanding of the climate change consequences and atmospheric circulation patterns in the dust source regions. Arid and semi-arid regions in North Africa and the Middle East are unstable under the recent cli-matic changes. Temperature and hydrological anomalies dur-ing the last millennium have led to large variations in human migration patterns and agricultural production, with precip-itation variability as a key factor in the productivity in the Middle East region (Kaniewski, 2012). The Elbrus ice core record confirms previous findings (Cook et al., 2016; Kelley et al., 2015) that the recent droughts in 1998–2012 CE were the most severe over at least the past three centuries.
5 Conclusions
This paper presents the Ca2+ record from the Elbrus ice core and provides a valuable archive of regional atmospheric dust variability in the past. Ca2+concentrations in the Elbrus ice core are a proxy for atmospheric dust transported over long distances from primary dust sources in North Africa and the Middle East. The Ca2+ record shows that recent decades were characterized by the highest dust emission ac-tivity since 1774. From the 1970s onward, Saharan dust de-position events significantly impact the dust dede-position in the Caucasus. The increase in frequency and intensity of dust deposition events is related to an overall trend towards dryer conditions and consequently an increased probability of dust emission from the aforementioned dust production sites. Ca2+ significantly spatially correlates with precipita-tion and soil moisture content in the Middle East. The corre-lation between circucorre-lation indices and the amount of dust in the Elbrus ice core indicate the influence of circulation over the Pacific Ocean extended to the Middle East.
Data availability. Calcium data can be made available for scientific purposes upon request to the authors (contact ku-tuzov@igras.ru, suzanne.preunkert@univ-grenoble-alpes.fr or michel.legrand@univ-grenoble-alpes).
Supplement. The supplement related to this article is available on-line at: https://doi.org/10.5194/acp-19-14133-2019-supplement.
Author contributions. SK performed field research, analyzed the data and wrote the original manuscript. ML analyzed ice sam-ples, assessed data and contributed to the original manuscript. SP analyzed ice samples and provided comments on the original manuscript. PG and VM performed analysis and provided com-ments on the original manuscript. KS calculated backward trajecto-ries and provided comments on the original manuscript. AP and PT analyzed climatic data, assessed atmospheric circulation patterns and provided comments on the original manuscript.
Competing interests. The authors declare that they have no conflict of interest.
Acknowledgements. We thank Natalie M. Kehrwald and For-rest S. Schoessow for valuable comments on the original manuscript and English language editing. We thank two anonymous reviewers for their useful comments, which significantly improved the quality of the manuscript.
Financial support. This research was supported by the Russian Science Foundation (RSF, grant no. 17-17-01270). The Les En-veloppes Fluides et l’Environnement – Chimie Atmosphérique (CNRS) programme entitled “Evolution séculaire de la charge et composition de l’aérosol organique au dessus de l’Europe” pro-vided funding for analysis in France, with the support of Agence de l’Environnement et de la Maîtrise de l’Energie. Backward trajectory analysis was supported by the Presidium of the Russian Academy of Sciences (grant no. 20). Interpretation of the shallow core was sup-ported by the President Grants for Government Support of Young Russian Scientists and the Leading Scientific Schools of the Rus-sian Federation (grant no. 2508.2017.5).
Review statement. This paper was edited by Yves Balkanski and reviewed by two anonymous referees.
References
Achakulwisut, P., Mickley, L. J., and Anenberg, S. C.: Drought-sensitivity of fine dust in the US Southwest: Implications for air quality and public health under future climate change, Environ. Res. Lett., 13, 054025, https://doi.org/10.1088/1748-9326/aabf20, 2018.
Barlow, M., Zaitchik, B., Paz, S., Black, E., Evans, J., and Hoell, A.: A review of drought in the Middle East and southwest Asia, J. Clim., 29, 8547–8574, https://doi.org/10.1175/JCLI-D-13-00692.1, 2016.
Bohleber, P., Erhardt, T., Spaulding, N., Hoffmann, H., Fischer, H., and Mayewski, P.: Temperature and mineral dust variability recorded in two low-accumulation Alpine ice cores over the last millennium, Clim. Past, 14, 21–37, https://doi.org/10.5194/cp-14-21-2018, 2018.
Breisinger, C., Zhu, T., Al Riffai, P., Nelson, G. C., Robertson, R., Funes, J., and Verner, D.: Global and Local Economic
Im-pacts of Climate Change in Syria and Options for Adaptation, Food Policy, available at: http://www.ifpri.org/publication/ (last access: 8 November 2019), 2011.
Cai, W., Santoso, A., Wang, G., Yeh, S. W., An, S. Il, Cobb, K. M., Collins, M., Guilyardi, E., Jin, F. F., Kug, J. S., Lengaigne, M., Mcphaden, M. J., Takahashi, K., Timmer-mann, A., Vecchi, G., Watanabe, M., and Wu, L.: ENSO and greenhouse warming, Nat. Climate Chang., 5, 849–859, https://doi.org/10.1038/nclimate2743, 2015.
Chin, M., Diehl, T., Tan, Q., Prospero, J. M., Kahn, R. A., Remer, L. A., Yu, H., Sayer, A. M., Bian, H., Geogdzhayev, I. V., Holben, B. N., Howell, S. G., Huebert, B. J., Hsu, N. C., Kim, D., Kucsera, T. L., Levy, R. C., Mishchenko, M. I., Pan, X., Quinn, P. K., Schus-ter, G. L., Streets, D. G., Strode, S. A., and Torres, O.: Multi-decadal aerosol variations from 1980 to 2009: A perspective from observations and a global model, Atmos. Chem. Phys., 14, 3657– 3690, https://doi.org/10.5194/acp-14-3657-2014, 2014. Chudnovsky, A. A., Koutrakis, P., Kostinski, A., Proctor,
S. P., and Garshick, E.: Spatial and temporal variabil-ity in desert dust and anthropogenic pollution in Iraq, 1997–2010, J. Air Waste Manag. Assoc., 67, 17–26, https://doi.org/10.1080/10962247.2016.1153528, 2017. Cook, B. I., Anchukaitis, K. J., Touchan, R., Meko, D. M., and
Cook, E. R.: Spatiotemporal drought variability in the mediter-ranean over the last 900 years, J. Geophys. Res., 121, 2060–2074, https://doi.org/10.1002/2015JD023929, 2016.
Dai, A.: Drought under global warming: A review, Wiley Interdiscip. Rev. Clim. Chang., 2, 45–65, https://doi.org/10.1002/wcc.81, 2011.
Davitaya, F. F.: Atmospheric dust content as a factor affecting glaciation and climatic change, Ann. Assoc. Am. Geogr., 59, 552–560, https://doi.org/10.1111/j.1467-8306.1969.tb00690.x, 1969.
De Angelis, M. and Gaudichet, A.: Saharan dust deposition over Mont Blanc (French Alps) during the last 30 years, Tellus B, 43, 61–75, https://doi.org/10.1034/j.1600-0889.1991.00005.x, 1991. De Angelis, M., Steffensen, J. P., Legrand, M., Clausen, H., and Hammer, C.: Primary aerosol (sea salt and soil dust) deposited in Greenland ice during the last climatic cycle: Comparison with east Antarctic records, J. Geophys. Res.-Ocean., 102, 26681– 26698, https://doi.org/10.1029/97JC01298, 1997.
De Châtel, F.: The Role of Drought and Climate Change in the Syrian Uprising: Untangling the Triggers of the Revolution, Middle East. Stud., 50, 521–535, https://doi.org/10.1080/00263206.2013.850076, 2014.
Dee, D. P., Uppala, S. M., Simmons, A. J., Berrisford, P., Poli, P., Kobayashi, S., Andrae, U., Balmaseda, M. A., Balsamo, G., Bauer, P., Bechtold, P., Beljaars, A. C. M., van de Berg, L., Bid-lot, J., Bormann, N., Delsol, C., Dragani, R., Fuentes, M., Geer, A. J., Haimberger, L., Healy, S. B., Hersbach, H., Hólm, E. V., Isaksen, L., Kållberg, P., Köhler, M., Matricardi, M., Mcnally, A. P., Monge-Sanz, B. M., Morcrette, J. J., Park, B. K., Peubey, C., de Rosnay, P., Tavolato, C., Thépaut, J. N., and Vitart, F.: The ERA-Interim reanalysis: Configuration and performance of the data assimilation system, Q. J. R. Meteorol. Soc., 137, 553–597, https://doi.org/10.1002/qj.828, 2011.
Delmonte, B., Petit, J.-R., and Maggi, V.: Glacial to Holocene im-plications of the new 27000-year dust record from the EPICA
Dome C (East Antarctica) ice core, Clim. Dynam., 18, 647–660, https://doi.org/10.1007/s00382-001-0193-9, 2002.
Di Mauro, B., Baccolo, G., Garzonio, R., Giardino, C., Massabò, D., Piazzalunga, A., Rossini, M., and Colombo, R.: Impact of impurities and cryoconite on the optical properties of the Morter-atsch Glacier (Swiss Alps), The Cryosphere, 11, 2393–2409, https://doi.org/10.5194/tc-11-2393-2017, 2017.
Draxler, R. R. and Hess, G. D.: An overview of the HYSPLIT_4 modeling system of trajectories, dispersion, and deposition, Aust. Meteorol. Mag., 47, 295–308, 1998.
Gabbi, J., Huss, M., Bauder, A., Cao, F., and Schwikowski, M.: The impact of Saharan dust and black carbon on albedo and long-term mass balance of an Alpine glacier, The Cryosphere, 9, 1385– 1400, https://doi.org/10.5194/tc-9-1385-2015, 2015.
Ganor, E., Osetinsky, I., Stupp, A., and Alpert, P.: Increas-ing trend of African dust, over 49 years, in the east-ern Mediterranean, J. Geophys. Res.-Atmos., 115, 1–7, https://doi.org/10.1029/2009JD012500, 2010.
Gautam, R., Liu, Z., Singh, R. P., and Hsu, N. C.: Two contrasting dust-dominant periods over India observed from MODIS and CALIPSO data, Geophys. Res. Lett., 36, L06813, https://doi.org/10.1029/2008GL036967, 2009.
Ginot, P., Dumont, M., Lim, S., Patris, N., Taupin, J. D., Wagnon, P., Gilbert, A., Arnaud, Y., Marinoni, A., Bonasoni, P., and Laj, P.: A 10 year record of black carbon and dust from a Mera Peak ice core (Nepal): Variability and potential impact on melting of Himalayan glaciers, The Cryosphere, 8, 1479–1496, https://doi.org/10.5194/tc-8-1479-2014, 2014.
Ginoux, P., Prospero, J. M., Gill, T. E., Hsu, N. C., and Zhao, M.: Global-scale attribution of anthropogenic and nat-ural dust sources and their emission rates based on MODIS Deep Blue aerosol products, Rev. Geophys., 50, 1–36, https://doi.org/10.1029/2012RG000388, 2012.
Grigholm, B., Mayewski, P. A., Kang, S., Zhang, Y., Morgenstern, U., Schwikowski, M., Kaspari, S., Aizen, V., Aizen, E., Takeuchi, N., Maasch, K. A., Birkel, S., Handley, M., and Sneed, S.: Twen-tieth century dust lows and the weakening of the westerly winds over the Tibetan Plateau, Geophys. Res. Lett., 42, 2434–2441, https://doi.org/10.1002/2015GL063217, 2015.
Grigholm, B., Mayewski, P. A., Aizen, V., Kreutz, K., Aizen, E., Kang, S., Maasch, K. A., and Sneed, S. B.: A twentieth century major soluble ion record of dust and anthropogenic pollutants from Inilchek Glacier, Tien Shan, J. Geophys. Res., 122, 1884– 1900, https://doi.org/10.1002/2016JD025407, 2017.
Hooper, J. and Marx, S.: A global doubling of dust emissions during the Anthropocene?, Glob. Planet. Change, 169, 70–91, https://doi.org/10.1016/j.gloplacha.2018.07.003, 2018.
Kalderon-Asael, B., Erel, Y., Sandler, A., and Dayan, U.: Min-eralogical and chemical characterization of suspended atmo-spheric particles over the east Mediterranean based on synoptic-scale circulation patterns, Atmos. Environ., 43, 3963–3970, https://doi.org/10.1016/j.atmosenv.2009.03.057, 2009.
Kaniewski, D.: Drought is a recurring challenge in the Mid-dle East, P. Natl. Acad. Sci. USA, 109, 3862–3867„ https://doi.org/10.1073/pnas.1116304109, 2012.
Kaspari, S., Mayewski, P. a., Handley, M., Kang, S., Hou, S., Sneed, S., Maasch, K., and Qin, D.: A High-Resolution Record of Atmospheric Dust Composition and Variability since a.d.
1650 from a Mount Everest Ice Core, J. Clim., 22, 3910–3925, https://doi.org/10.1175/2009JCLI2518.1, 2009.
Kelley, C. P., Mohtadi, S., Cane, M. A., Seager, R., and Kushnir, Y.: Climate change in the Fertile Crescent and implications of the recent Syrian drought, P. Natl. Acad. Sci. USA, 112, 3241–3246, https://doi.org/10.1073/pnas.1421533112, 2015.
Kistler, R., Collins, W., Saha, S., White, G., Woollen, J., Kalnay, E., Chelliah, M., Ebisuzaki, W., Kanamitsu, M., Kousky, V., van den Dool, H., Jenne, R., and Fiorino, M.: The NCEP–NCAR 50–Year Reanalysis: Monthly Means CD–ROM and Documen-tation, B. Am. Meteorol. Soc., 82, 247–267, 2001. Knippertz, P. and Stuut, J. B. W. (Eds.): Mineral dust: A key player in the https://doi.org/10.1007/978-94-017-8978-3, 2014.
Koçak, M., Theodosi, C., Zarmpas, P., Séguret, M. J. M., Herut, B., Kallos, G., Mihalopoulos, N., Kubilay, N., and Nimmo, M.: Influence of mineral dust transport on the chemical composition and physical properties of the East-ern Mediterranean aerosol, Atmos. Environ., 57, 266–277, https://doi.org/10.1016/j.atmosenv.2012.04.006, 2012.
Kutuzov, S., Shahgedanova, M., Mikhalenko, V., Ginot, P., Lavren-tiev, I., and Kemp, S.: High-resolution provenance of desert dust deposited on Mt. Elbrus, Caucasus in 2009–2012 using snow pit and firn core records, The Cryosphere, 7, 1481–1498, https://doi.org/10.5194/tc-7-1481-2013, 2013.
Kutuzov, S. S., Lavrentiev, I. I., Vasilenko, E. V., Macheret, Y. Y., Petrakov, D. A., and Popov, G. V.: Estimation of the greater cau-casus glaciers volume, using radio-echo sounding data and mod-elling, Earth’s Cryosph., 19, 78–88, 2015.
Lee, D. S. and Pacyna, J. M.: An industrial emissions inven-tory of calcium for Europe, Atmos. Environ., 33, 1687–1697, https://doi.org/10.1016/S1352-2310(98)00286-6, 1999. Legrand, M.: Chemistry of Antarctic snow and
ice, Le J. Phys. Colloq., 48, C1-77–C1-86, https://doi.org/10.1051/jphyscol:1987111, 1987.
Legrand, M.: Seasonally resolved Alpine and Green-land ice core records of anthropogenic HCl emissions over the 20th century, J. Geophys. Res., 107, 4139, https://doi.org/10.1029/2001JD001165, 2002.
Legrand, M. and Mayewski, P.: Glaciochemistry of po-lar ice cores: A review, Rev. Geophys., 35, 219–243, https://doi.org/10.1029/96RG03527, 1997.
Legrand, M., Preunkert, S., May, B., Guilhermet, J., Hoffman, H., and Wagenbach, D.: Major 20th century changes of the content and chemical speciation of organic carbon archived in Alpine ice cores: Implications for the long-term change of organic aerosol over Europe, J. Geophys. Res.-Atmos., 118, 3879–3890, https://doi.org/10.1002/jgrd.50202, 2013.
Li, L. and Sokolik, I. N.: Analysis of dust aerosol retrievals using satellite data in Central Asia, Atmosphere, 9, 1–28, https://doi.org/10.3390/atmos9080288, 2018.
Lim, S., Faïn, X., Ginot, P., Mikhalenko, V., Kutuzov, S., Paris, J.-D., Kozachek, A., and Laj, P.: Black carbon variability since preindustrial times in the eastern part of Europe reconstructed from Mt. Elbrus, Caucasus, ice cores, Atmos. Chem. Phys., 17, 3489–3505, https://doi.org/10.5194/acp-17-3489-2017, 2017. Lu, J., Vecchi, G. A., and Reichler, T.: Expansion of the Hadley
cell under global warming, Geophys. Res. Lett., 34, L06805, https://doi.org/10.1029/2006GL028443, 2007.
Lucas, C., Timbal, B., and Nguyen, H.: The expanding trop-ics: a critical assessment of the observational and model-ing studies, Wiley Interdiscip. Rev. Clim. Chang., 5, 89–112, https://doi.org/10.1002/wcc.251, 2014.
Mahowald, N. M., Ballantine, J. A., Feddema, J., and Ramankutty, N.: Global trends in visibility: implications for dust sources, At-mos. Chem. Phys., 7, 3309–3339, https://doi.org/10.5194/acp-7-3309-2007, 2007.
Mahowald, N. M., Kloster, S., Engelstaedter, S., Moore, J. K., Mukhopadhyay, S., McConnell, J. R., Albani, S., Doney, S. C., Bhattacharya, A., Curran, M. A. J., Flanner, M. G., Hoffman, F. M., Lawrence, D. M., Lindsay, K., Mayewski, P. A., Neff, J., Rothenberg, D., Thomas, E., Thornton, P. E., and Zender, C. S.: Observed 20th century desert dust variability: Impact on climate-and biogeochemistry, Atmos. Chem. Phys., 10, 10875–10893, https://doi.org/10.5194/acp-10-10875-2010, 2010.
Mbengue, C. and Schneider, T.: Storm-Track Shifts under Climate Change: Toward a Mechanistic Understanding Using Baroclinic Mean Available Potential Energy, J. Atmos. Sci., 74, 93–110, https://doi.org/10.1175/JAS-D-15-0267.1, 2017.
Middleton, N. J.: Desert dust hazards: A global review, Aeolian Res., 24, 53–63, https://doi.org/10.1016/j.aeolia.2016.12.001, 2017.
Mikhalenko, V., Sokratov, S., Kutuzov, S., Ginot, P., Legrand, M., Preunkert, S., Lavrentiev, I., Kozachek, A., Ekaykin, A., Faïn, X., Lim, S., Schotterer, U., Lipenkov, V., and Toropov, P.: Investigation of a deep ice core from the Elbrus western plateau, the Caucasus, Russia, The Cryosphere, 9, 2253–2270, https://doi.org/10.5194/tc-9-2253-2015, 2015.
Moridnejad, A., Karimi, N., and Ariya, P. A.: A new inventory for Middle East dust source points, Environ. Monit. Assess., 187, 1–11, https://doi.org/10.1007/s10661-015-4806-x, 2015. Nicholson, S. E., Funk, C., and Fink, A. H.: Rainfall
over the African continent from the 19th through the 21st century, Glob. Planet. Change, 165, 114–127, https://doi.org/10.1016/j.gloplacha.2017.12.014, 2018.
Notaro, M., Yu, Y. and Kalashnikova, O. V: Regime shift in Arabian dust activity, triggered by persistent Fertile Crescent drought, J. Geophys. Res.-Atmos., 120, 229–249, https://doi.org/10.1002/2015JD023855, 2015.
Osterberg, E., Mayewski, P., Kreutz, K., Fisher, D., Handley, M., Sneed, S., Zdanowicz, C., Zheng, J., Demuth, M., Waskiewicz, M., and Bourgeois, J.: Ice core record of rising lead pollution in the North Pacific atmosphere, Geophys. Res. Lett., 35, L05810, https://doi.org/10.1029/2007GL032680, 2008.
Petit, J. R., Jouzel, J., Raynaud, D., Barkov, N. I., Barnola, J. M., Basile, I., Bender, M., Chappellaz, J., Davis, M., Delaygue, G., Delmotte, M., Kotlyakov, V. M., Legrand, M., Lipenkov, V. Y., Lorius, C., Pépin, L., Ritz, C., Saltzman, E., and Stievenard, M.: Climate and atmospheric history of the past 420,000 years from the Vostok ice core, Antarctica, Nature, 399, 429–436, https://doi.org/10.1038/20859, 1999.
Preunkert, S. and Legrand, M.: Towards a quasi-complete re-construction of past atmospheric aerosol load and compo-sition (organic and inorganic) over Europe since 1920 in-ferred from Alpine ice cores, Clim. Past, 9, 1403–1416, https://doi.org/10.5194/cp-9-1403-2013, 2013.
Preunkert, S., Wagenbach, D., Legrand, M., and Vincent, C.: Col du Dôme (Mt Blanc Massif, French Alps)
suit-ability for ice-core studies in relation with past atmo-spheric chemistry over Europe, Tellus B, 52, 993–1012, https://doi.org/10.3402/tellusb.v52i3.17081, 2000.
Preunkert, S., Legrand, M., Kutuzov, S., Ginot, P., Mikhalenko, V., and Friedrich, R.: The Elbrus (Caucasus, Russia) ice core record – Part 1: reconstruction of past anthropogenic sulfur emissions in south-eastern Europe, Atmos. Chem. Phys., 19, 14119–14132, https://doi.org/10.5194/acp-19-14119-2019, 2019.
Pu, B. and Ginoux, P.: The impact of the Pacific Decadal Os-cillation on springtime dust activity in Syria, Atmos. Chem. Phys., 16, 13431–13448, https://doi.org/10.5194/acp-16-13431-2016, 2016.
Ruth, U., Wagenbach, D., Steffensen, J. P., and Bigler, M.: Continuous record of microparticle concentration and size distribution in the central Greenland NGRIP ice core dur-ing the last glacial period, J. Geophys. Res., 108, 4098, https://doi.org/10.1029/2002JD002376, 2003.
Seidel, D. J., Fu, Q., Randel, W. J., and Reiohler, T. J.: Widening of the tropical belt in a changing climate, Nat. Methods, 1, 21–24, https://doi.org/10.1038/ngeo.2007.38, 2008.
Shahgedanova, M., Kutuzov, S., White, K. H., and Nosenko, G.: Using the significant dust deposition event on the glaciers of Mt. Elbrus, Caucasus Mountains, Russia on 5 May 2009 to develop a method for dating and “provenancing” of desert dust events recorded in snow pack, Atmos. Chem. Phys., 13, 1797–1808, https://doi.org/10.5194/acp-13-1797-2013, 2013.
Sivakumar, M. V. K. and Stefanski, R.: Climate and Land Degrada-tion – an Overview, in Climate and Land DegradaDegrada-tion, edited by M. V. K. Sivakumar and N. Ndiang’ui, Springer Berlin Heidel-berg, Berlin, HeidelHeidel-berg, 105–135, 2007.
Skiles, S. M., Flanner, M., Cook, J. M., Dumont, M., and Painter, T. H.: Radiative forcing by light-absorbing particles in snow, Nat. Clim. Change, 8, 964–971, https://doi.org/10.1038/s41558-018-0296-5, 2018.
Sodemann, H., Palmer, A. S., Schwierz, C., Schwikowski, M., and Wernli, H.: The transport history of two Saharan dust events archived in an Alpine ice core, Atmos. Chem. Phys., 6, 667–688, https://doi.org/10.5194/acp-6-667-2006, 2006.
Solomos, S., Kalivitis, N., Mihalopoulos, N., Amiridis, V., Kouvarakis, G., Gkikas, A., Binietoglou, I., Tsekeri, A., Kazadzis, S., Kottas, M., Pradhan, Y., Proestakis, E., Nastos, P., and Marenco, F.: From Tropospheric Folding to Khamsin and Foehn Winds: How Atmospheric Dynamics Advanced a Record-Breaking Dust Episode in Crete, Atmosphere, 9, 1–20, https://doi.org/10.3390/atmos9070240, 2018.
Stanelle, T., Bey, I., Raddatz, T., Reick, C., and Tegen, I.: Anthropogenically induced changes in twentieth century mineral dust burden and the associated impact on radia-tive forcing, J. Geophys. Res.-Atmos., 119, 13526–13546, https://doi.org/10.1002/2014JD022062, 2014.
Stein, A. F., Draxler, R. R., Rolph, G. D., Stunder, B. J. B., Cohen, M. D., and Ngan, F.: Noaa’s Hysplit atmospheric transport and dispersion modeling system, B. Am. Meteorol. Soc., 96, 2059– 2077, https://doi.org/10.1175/BAMS-D-14-00110.1, 2015. Thevenon, F., Anselmetti, F. S., Bernasconi, S. M., and
Schwikowski, M.: Mineral dust and elemental black car-bon records from an Alpine ice core (Colle Gnifetti glacier) over the last millennium, J. Geophys. Res., 114, D17102, https://doi.org/10.1029/2008JD011490, 2009.
Thomas, N. and Nigam, S.: Twentieth-century climate change over Africa: Seasonal hydroclimate trends and sahara desert expan-sion, J. Clim., 31, 3349–3370, https://doi.org/10.1175/JCLI-D-17-0187.1, 2018.
Thompson, L. G., Yao, T., Mosley-Thompson, E., Davis, M. E., Henderson, K. A., and Lin, P. N.: A high-resolution millennial record of the South Asian Mon-soon from Himalayan ice cores, Science, 289, 1916–1919, https://doi.org/10.1126/science.289.5486.1916, 2000.
Tielidze, L. G. and Wheate, R. D.: The Greater Caucasus Glacier Inventory (Russia, Georgia and Azerbaijan), The Cryosphere, 12, 81–94, https://doi.org/10.5194/tc-12-81-2018, 2018.
Touchan, R., Anchukaitis, K. J., Meko, D. M., Sabir, M., Attalah, S., and Aloui, A.: Spatiotemporal drought variability in north-western Africa over the last nine centuries, Clim. Dynam., 37, 237–252, https://doi.org/10.1007/s00382-010-0804-4, 2011. Trigo, R. M., Gouveia, C. M., and Barriopedro, D.: The intense
2007-2009 drought in the Fertile Crescent: Impacts and associ-ated atmospheric circulation, Agr. Forest Meteorol., 150, 1245– 1257, https://doi.org/10.1016/j.agrformet.2010.05.006, 2010. Usher, C. R., Michel, A. E., and Grassian, V. H.:
Re-actions on Mineral Dust, Chem. Rev., 103, 4883–4940, https://doi.org/10.1021/cr020657y, 2003.
Vicente-Serrano, S. M., Beguería, S., and López-Moreno, J. I.: A Multiscalar Drought Index Sensitive to Global Warming: The Standardized Precipitation Evapotranspiration Index, J. Clim., 23, 1696–1718, https://doi.org/10.1175/2009JCLI2909.1, 2010. Wagenbach, D., Preunkert, S., Schäfer, J., Jung, W., and Tomadin,
L.: Northward Transport of Saharan Dust Recorded in a Deep Alpine Ice Core, in: The Impact of Desert Dust Across the Mediterranean, edited by: Guerzoni, S. and Chester, R., Springer Netherlands, Dordrecht, 291–300, 1996.
Webb, N. P. and Pierre, C.: Quantifying Anthro-pogenic Dust Emissions, Earth’s Future, 6, 286–295, https://doi.org/10.1002/2017EF000766, 2018.
Zhang, Y., Mahowald, N., Scanza, R. A., Journet, E., Desboeufs, K., Albani, S., Kok, J. F., Zhuang, G., Chen, Y., Cohen, D. D., Paytan, A., Patey, M. D., Achterberg, E. P., Engelbrecht, J. P., and Fomba, K. W.: Modeling the global emission, transport and deposition of trace elements associated with mineral dust, Biogeosciences, 12, 5771–5792, https://doi.org/10.5194/bg-12-5771-2015, 2015.
![[PDF] Cours PDF complet avec exemples sur le langage JavaScript méthodes et applications - Cours Javascript](data:image/gif;base64,R0lGODlhAQABAIAAAP///wAAACH5BAEAAAAALAAAAAABAAEAAAICRAEAOw==)