HAL Id: insu-01891409
https://hal-insu.archives-ouvertes.fr/insu-01891409
Submitted on 9 Nov 2018
HAL is a multi-disciplinary open access
archive for the deposit and dissemination of sci-entific research documents, whether they are pub-lished or not. The documents may come from teaching and research institutions in France or abroad, or from public or private research centers.
L’archive ouverte pluridisciplinaire HAL, est destinée au dépôt et à la diffusion de documents scientifiques de niveau recherche, publiés ou non, émanant des établissements d’enseignement et de recherche français ou étrangers, des laboratoires publics ou privés.
Assessment of the impacts of climate variability on total
water storage across Africa: implications for
groundwater resources management
Tales Carvalho Resende, Laurent Longuevergne, Jason Gurdak, Marc Leblanc,
Guillaume Favreau, Nienke Ansems, Jac van der Gun, Cheikh Gaye, Alice
Aureli
To cite this version:
Tales Carvalho Resende, Laurent Longuevergne, Jason Gurdak, Marc Leblanc, Guillaume Favreau, et al.. Assessment of the impacts of climate variability on total water storage across Africa: implications for groundwater resources management. Hydrogeology Journal, Springer Verlag, 2019, 27 (1), pp.493-512. �10.1007/s10040-018-1864-5�. �insu-01891409�
1
Assessment of the impacts of climate variability on total water storage across
1
Africa: implications for groundwater resources management
2
Tales Carvalho Resende, UNESCO International Hydrological Programme (IHP), Paris, France1 3
Laurent Longuevergne, University of Rennes, Géosciences Rennes - UMR 6118, Rennes, France 4
Jason J. Gurdak, San Francisco State University, Department of Earth & Climate Sciences, San 5
Francisco, United States 6
Marc Leblanc, University of Avignon-INRA, Hydrogeology Laboratory, UMR EMMAH, 7
Avignon, France 8
Guillaume Favreau, IRD, UMR HydroSciences, University of Montpellier, Montpellier, France; 9
IRD, University of Grenoble-Alpes, CNRS, Environmental Geosciences Institute, Grenoble, 10
France 11
Nienke Ansems, International Groundwater Resources Assessment Centre (IGRAC), Delft, The 12
Netherlands 13
Jac Van der Gun, Van der Gun Hydro-Consulting, The Netherlands 14
Cheikh B. Gaye, University Cheikh Anta Diop, Department of Geology, Dakar, Senegal 15
Alice Aureli, UNESCO International Hydrological Programme (IHP), Paris, France 16
17
2 18
Key words: GRACE, climate change, groundwater management, groundwater storage, Sub-19 Saharan Africa 20 21 Abstract 22
The links between climate variability, depicted by times series of oceanic indices, and changes in
23
total water and groundwater storage are investigated across nine large aquifer basins of the
24
African continent. The Gravity Recovery and Climate Experiment (GRACE) mission’s
25
observations represent a remarkable tool that can provide insight into the dynamics of terrestrial
26
hydrology in areas where direct in-situ observations are limited. In order to evaluate the impact
27
of inter-annual and multi-decadal climate variability on groundwater resources, this study
28
assesses the relationship between synoptic controls on climate and total water storage estimates
29
from (i) GRACE from 2002 to 2013 and (ii) a two-variables climate-driven model that is able to
30
reconstruct past storage changes from 1982 to 2011. The estimates are then compared to time
31
series of groundwater levels to show the extent to which total water storage covaries with
32
groundwater storage. Results indicate that rainfall patterns associated with the El Niño Southern
33
Oscillation (ENSO) are the main driver of inter-annual groundwater storage changes, whereas
34
the Atlantic Multi-Decadal Oscillation (AMO) plays a significant role in decadal to
multi-35
decadal variability. The combined effect of ENSO and AMO could trigger significant changes in
36
recharge to the aquifers and groundwater storage, in particular in the Sahel. These findings could
3
help decision-makers prepare more effective climate-change adaptation plans at both national
38
and transboundary levels.
39 40
NOTE TO COPYEDITOR - PLEASE INSERT THE FOLLOWING AS A FIRST-PAGE 41
FOOTNOTE: 42
This article is part of the topical collection “Determining groundwater sustainability from long-43
term piezometry in Sub-Saharan Africa” 44 45 46 47 1. Introduction 48
Africa faces major water resources management challenges, largely because water is unevenly 49
distributed over the continent and over time. About 64% of the population rely on limited and 50
highly variable amounts of water, and 25% of the population experience difficulties in water use 51
due to accessibility or mobilizations issues (e.g. water infrastructure, flow controls, costs) 52
(Vorosmarty et al., 2005). As a result of rapid population growth and higher industrial activity, 53
water demand in Africa is projected to more than double by the end of the 21st century (Wada 54
and Bierkens, 2014), which may compromise the future livelihoods of millions of people and 55
their living standards. Global climate change and variability is expected to exacerbate this issue 56
as it will bring more extreme climate conditions such as droughts (Prudhomme et al., 2014; 57
Trenberth et al., 2014; Malherbe et al., 2016). Groundwater plays an important role in society’s 58
adaptation to climate change and variability, especially because it is more resilient to the effects 59
of climate change than surface water (Green et al., 2011; Treidel et al., 2012; Van der Gun, 2012; 60
Taylor et al., 2013a). Groundwater’s unique buffer capacity provides a major strength to reduce 61
the risk of temporary water shortage, and to create conditions for survival in areas were climate 62
change is expected to cause water stress (Falkenmark, 2013). 63
4 An estimated 75% or more of Africans use groundwater as their main source of drinking water 64
(UNEP, 2010), particularly in rural areas that rely on low-cost dug wells and boreholes. There is 65
very limited reliable and comprehensive statistics on groundwater use in Africa, but previous 66
assessments indicate an underutilized potential to support irrigated agriculture as most farming in 67
Africa is currently rainfed (Wani et al., 2009). Groundwater is over-exploited for irrigation in 68
many parts of the world (Famiglietti, 2014; Konikow 2015) including Asia where 14% of 69
cultivated land is irrigated with groundwater (Siebert et al., 2010) but in Africa ~1% of the 70
cultivated land (about 2×10⁶
hectares) is irrigated with groundwater (Altchenko and Villholth, 71
2015). In contrast to other regions in the world such as Western Mexico, the High Plains in the 72
central U.S., the Middle East, North-East Pakistan, North-West India, and North-East China, 73
most of Sub-Saharan Africa has not yet experienced the “groundwater crisis” (Famiglietti, 2014) 74
caused by the widespread over-abstraction of groundwater to support large-scale agriculture. 75
Moreover, some major African aquifers tend to coincide with areas of relatively lower 76
population density and water demand (e.g. the Sahel aquifer Basins, the Congo Basin in Central 77
Africa, and the Kalahari Basins in Southern Africa) (Foster et al., 2006; Wada et al., 2010; 78
Gleeson et al., 2012; MacDonald et al., 2012). Many African countries and/or joint bodies in 79
charge of implementing transboundary water agreements thus have an opportunity to anticipate 80
future groundwater use and management challenges through planning, sustainable utilization, 81
and effective protection of groundwater resources (Tuinhof et al., 2011; Gorelick and Zheng, 82
2015). 83
However, the development of long-term effective and reliable groundwater management 84
strategies for coping with water scarcity threats and climate variability and change in Africa is 85
undermined by the lack of adequate data for decision-making (Bates et al., 2008). In recent 86
5 years, there has been a substantial decline in hydrometeorological data collection and 87
management in Africa (Houghton-Carr and Fry, 2006; Robins et al., 2006). Decades ago, Africa 88
had a relatively dense network of stations to measure rainfall, temperature and other weather 89
data, but some weather centres have aged badly because of reductions in budgets for field 90
maintenance and inspection, and many of these stations are no longer operating (Giles, 2005). 91
The current density of hydrometeorological stations in Africa is eight times lower than the 92
minimum recommended by the World Meteorological Organization (WMO, 1996). Many 93
governments have a limited ability to collect the data needed for long-term water resources 94
management, and current efforts have mainly focused on rainfall and river flow data collection. 95
As a result, most African countries lack groundwater-monitoring stations and this limits the 96
understanding of the response of groundwater to human and natural conditions (Gaye and 97
Tindimugaya, 2012). 98
Over the last decade, significant advances in the remote sensing techniques have led to a more 99
complete overview of the water cycle at the global scale. Launched in March 2002, the Gravity 100
Recovery and Climate Experiment (GRACE) is the first satellite mission able to provide global 101
observations of terrestrial water storage changes (ΔTWS) (Richey et al., 2015; Chen et al., 2016). 102
Given that the dynamics of groundwater are affected by inter-annual to multi-decadal climate 103
variability (Gurdak et al., 2007; Kuss and Gurdak, 2014), longer observations than GRACE’s 104
current 15 year record (2002 to 2017) are desirable to better evaluate the past and current 105
evolution of groundwater resources, as well as to provide pointers for the future. 106
To overcome GRACE’s time frame limitation and the lack of adequate long-term piezometry 107
data, this study used an approach to reconstruct past water storage variations in major aquifers 108
across Africa through a climate-driven model using precipitation and actual evapotranspiration 109
6 data from global datasets over the period of 1982 to 2011. Validation of the results is carried out 110
by comparing the results of modeled total water storage changes (ΔTWSMODEL) with GRACE-111
based total water storage changes (ΔTWSGRACE) estimates from 2002 to 2013. The model and 112
GRACE-based estimates are then compared to long-term piezometry measurements to show the 113
extent to which total water storage changes covary with observed groundwater storage changes 114
(ΔGWSOBSERVED). Using this approach also allows one to quantify teleconnections between total 115
water and groundwater storage changes with global-scale climatic oscillations such as the El 116
Niño Southern Oscillation (ENSO), North Atlantic Oscillation (NAO), and Atlantic Multidecadal 117
Oscillation (AMO). 118
Acronyms and abbreviations are given in the Appendix. 119 120 2. Background 121 2.1. Study areas 122
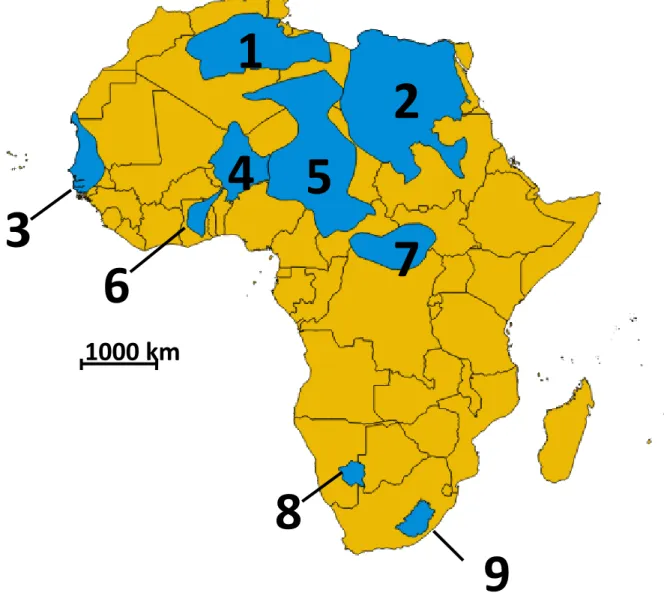
Nine large aquifer systems in Africa were selected for this study on the basis of hydrogeological, 123
climate and governance conditions as presented in Table 1 and Figure 1. 124
The distribution of aquifers in Africa is now reasonably mapped following long-term 125
programmes launched in the 1960s by national and international agencies and supported 126
variously by UNESCO, IAEA, and British, French, German and Dutch technical assistance. 127
These efforts were subsequently integrated by the International Association of Hydrogeologists 128
(IAH)/UNESCO/BGR WHYMAP Africa Groundwater Resources Map in 2008, which was the 129
baseline for the first quantitative maps of groundwater resources in Africa (MacDonald et al., 130
2012). Approximately 45% of the African land surface is underlain by large sedimentary basins 131
7 hosting relatively homogeneous aquifers that may offer good conditions for groundwater 132
abstraction. Approximately 11% of the land has a geologically complex structure, highly 133
productive aquifers in heterogeneous folded or faulted regions in close vicinity to non-aquifers. 134
Almost half of the territory (44%) consists of regions with only limited groundwater resources, 135
generally in local and shallow aquifers in weathered crystalline bedrock or alluvial deposits that 136
locally may be productive (BGR and UNESCO, 2008; Maurice et al., 2018). 137
With regards to storage, a considerable proportion of Africa’s groundwater resources is located 138
in the large sedimentary basins in (semi)arid zones (e.g. North Africa, Sahel, and the Kalahari 139
and Karoo basins in Southern Africa) and tropical zones (e.g. the Congo Basin in Central Africa) 140
(MacDonald et al., 2012). These basins usually contain multi-layered aquifer systems with major 141
alluvial formations forming shallow unconsolidated aquifers underlain by consolidated 142
sedimentary rocks forming deeper aquifers. Even in semi-arid parts of Africa the shallow 143
unconsolidated aquifers can be recharged in response to episodic storm events, climate 144
oscillations, and land-use change (Taylor et al. 2009, 2013b). In the Sahara/Sahel aquifers, 145
isotope and hydrochemical investigations have revealed that recharge mainly occurs by direct 146
infiltration of rainwater or by river/surface water interaction as in the case of the Senegal and 147
Niger Rivers (Diaw et al., 2012; Nazoumou et al., 2015; Abdou Babaye et al., 2018). Stable and 148
radioactive isotopes contents in shallow aquifers confirm the presence of modern infiltration 149
water (Lapworth et al., 2013; Zouari, 2015). Recharge rate over these areas are usually low and 150
range from 0.1 to 5% of annual precipitation (Scanlon et al., 2006). The recharge mechanisms 151
and dynamics of the deeper aquifers is still uncertain. Data from the Sahara/Sahel tend to exhibit 152
piston-flow behavior (i.e. new water “pushing” old water downwards). Depleted stable isotopes 153
contents observed in some aquifers (Taoudeni and Iullemmeden basins) suggests the presence of 154
8 palaeoclimatic water or old-recent mixed groundwater (Fontes et al., 1991; Zouari, 2015). 155
However, the deeper aquifers can be considered as not being actively recharged as most of the 156
recharge dates back to more than 5000 years ago (Edmunds, 2008). 157
Most of these aquifers located in large sedimentary basins are transboundary. More than 75 158
transboundary aquifers have been identified in Africa, but as more information and knowledge 159
becomes available this number is likely to increase (IGRAC-UNESCO, 2015). The identified 160
transboundary aquifers represent approximately 42% of African continental land area and 30% 161
of the population. Arrangements for the management of these transboundary aquifers remain 162
insufficiently developed as groundwater has been traditionally considered a national matter. Only 163
three transboundary aquifers are under an operational agreement, namely the Nubian Sandstone 164
Aquifer System (NSAS), the North-Western Sahara Aquifer System (NWSAS), and the 165
Stampriet Transboundary Aquifer System (STAS). A Memorandum of Understanding was 166
signed in 2014 for the establishment of a consultation mechanism for the Iullemmeden, 167
Taoudeni/Tanezrouft Aquifer System (ITTAS) but has not entered into force yet. Africa is 168
however the continent with the highest proportion of transboundary surface water catchments 169
under an operational arrangement (Meyer, 2016; UNESCO and UNECE, 2017). Given that 170
aquifers and river/lake basins do not necessarily coincide, the most appropriate body to oversee 171
the management of a transboundary aquifer may not necessarily be a river or lake basin 172
organization (if existent). However, these arrangements and institutions could play a crucial role 173
in promoting cooperation over transboundary aquifers through action programmes. 174
INSERT TABLE 1 HERE 175
INSERT FIGURE 1 HERE 176
9
2.2. Climate variability modes in Africa
177
Exchanges between the Earth’s atmosphere, oceans, cryosphere and continental hydrology give 178
rise to some natural climate fluctuations, of various periodicities. Some of the most important 179
global-scale climate oscillations on interannual to multidecadal timescales that influence local 180
water resources include the El Niño Southern Oscillation (ENSO), North Atlantic Oscillation 181
(NAO), Pacific Decadal Oscillation (PDO), and Atlantic Multidecadal Oscillation (AMO). These 182
natural climate oscillations are monitored using scalar-valued indices, which characterize 183
positive, negative, and neutral phases of a climate variability mode and to identify the strength of 184
these phases. 185
ENSO is considered as the most important pattern of natural interannual climate variability on 186
Earth (Palmer and Anderson, 1994). It is a coupled ocean-atmospheric phenomenon that has 187
interannual variability with irregular 2- to 7-year cycles between the warm (El Niño) and cold 188
(La Niña) phases that has been occurring for at least the past 700 years (Li et al., 2013). El Niño 189
is characterized by stronger than average sea surface temperatures in the central and eastern 190
equatorial Pacific Ocean, reduced strength of the easterly trade winds in the Tropical Pacific, and 191
an eastward shift in the region of intense tropical rainfall. La Niña is characterized by the 192
opposite – cooler than average sea surface temperatures, stronger than normal easterly trade 193
winds, and a westward shift in the region of intense tropical rainfall. Three very strong El Niño 194
events have occurred since the early 1980s, i.e. 1982–1983, 1997–1998, and more recently 2015-195
2016. Although ENSO is centered in the tropics, the changes associated with El Niño and La 196
Niña events affect climate around the world. ENSO’s influence upon annual rainfall levels have 197
been reported all across Africa, particularly in Southern Africa (Manatsa et al., 2011). Droughts 198
10 occur most of the time during the warm phase of ENSO (Masih et al., 2014). On the other hand, 199
the trend to more La Niña-like conditions since 2000 is a likely contributing factor driving the 200
increase in Southern Africa rainfall (Maidment et al, 2015). As compared to the other African 201
regions, the climate of Central Africa and its variability has been the subject of very few studies. 202
The few existing studies suggest that there is not a significant relationship between ENSO and 203
precipitation in Central Africa (Philippon et al., 2012; Taylor et al., 2013b). ENSO has also been 204
linked to the devastating droughts of the 1970s and 1980s in the Sahel (e.g. Giannini et al., 205
2003). Drier (wetter) decades in the Sahel are usually correlated with El Niño (La Niña) events 206
(e.g. Nicholson and Selato, 2000; Janicot et al., 2011). Several different ENSO indices have 207
developed over time, but the Multivariate ENSO Index (MEI) is favored over other indices 208
because it combines the significant features of all observed surface fields in the tropical Pacific. 209
MEI monthly values were obtained from the NOAA Earth System Research Laboratory (NOAA, 210
2017). 211
The PDO is often described as a long-lived El Niño-like pattern of Pacific climate variability 212
(Zhang et al. 1997). The PDO index is based upon patterns of variation in sea surface 213
temperature of the North Pacific Ocean with warm and cold phases that can persist for 20-30 214
years. Unlike ENSO, the PDO is not a single physical mode of ocean variability, but rather the 215
sum of several processes with different dynamic origins. The PDO monthly values were obtained 216
from the NOAA Earth System Research Laboratory database (NOAA, 2017). 217
The NAO represents a north-south oscillation atmospheric mass between the Icelandic low-218
pressure system and the Azores high-pressure system. The positive phase of the NAO reflects 219
below-normal surface pressure over the Icelandic to Arctic regions and above-normal surface 220
11 pressure over the subtropical Atlantic. The negative phase reflects the opposite. The NAO 221
exhibits considerable interseasonal, interannual and multidecadal variability with irregular 1- to 222
24-year cycles (Hurrell 1995, Chelliah and Bell 2005), but has a dominant quasiperiod 223
oscillation of 3 to 6 years and a less significant 8 to 10 year mode (Hurrell et al. 2003). The NAO 224
is among the known modes of natural variability influencing North Africa precipitation on a 225
variety of time-scales, especially in winter and early spring. Drier (wetter) decades in North 226
Africa largely correspond to positive (negative) NAO phase (Lopez-Moreno et al., 2011). 227
Correlations are however particularly stronger for negative NAO phases (Donat et al., 2014). For 228
example, the negative phase of the NAO from the mid-1950s to late 1970s indicates relatively 229
wet conditions with a gradual shift towards drier conditions in the early 1970s. Recent years have 230
also been considered wetter. NAO monthly values were obtained from the NOAA Earth System 231
Research Laboratory database (NOAA, 2017). 232
The AMO is an index of sea surface temperature over the North Atlantic Ocean (quasi-period 233
cycles of roughly 50 to 70 years) with negative and positive phases that may last for 20-40 years 234
each and lead to differences of about 15°C between extremes. Paleoclimatologic studies have 235
confirmed that these changes have been occurring over the past 8000 years (Knudsen et al., 236
2011). The AMO was in positive phases from 1860 to 1880 and 1930 to 1960, and in negative 237
phases from 1905 to 1925 and 1970 to 1990. The AMO flipped to a positive phase in the mid-238
1990s and it is believed that the AMO is gradually moving to a negative phase (McCarthy et al., 239
2015). Higher rainfall over the Sahel is associated to positive phases of the AMO (Diatta and 240
Fink, 2014), while the opposite occurs in the Gulf of Guinea (Mohino et al., 2011). The AMO 241
monthly values were obtained from the NOAA Earth System Research Laboratory database 242
(NOAA, 2017). 243
12 The interaction of climate variability modes can enhance or diminish certain climatic forcings on 244
local hydrologic processes (Hanson et al. 2004). When El Niño (La Niña) occurs with the warm 245
(cold) PDO phase, rainfall tends to increase over the Sahara to the Gulf of Guinea and Southern 246
Africa, while the opposite occurs in the Horn of Africa (Wang et al., 2014). Several studies 247
suggest that the AMO modulates the ENSO and NAO variability (Dong et al. 2006; Dong and 248
Sutton 2007; Timmermann et al. 2007; Zhang et al., 2012; García-García and Ummenhofer, 249
2015). Strengthened (weakened) La Niña effects coincide with a positive (negative) phase of the 250
AMO (Geng et al., 2016). In the Sahel (Lake Chad), the severe impact of droughts of the 1970s 251
and 1980s are tied to the combined effect of the negative phase of the AMO and El Niño events 252
(Okonkwo et al., 2015). Finally, ENSO and AMO are well-known climate teleconnections that 253
have been associated with extreme rainfall variability in Western/Central Africa (Ndehedehe et 254
al., 2017). An inverse relationship exists between the AMO and the NAO decadal tendencies. 255
When the AMO is negative, NAO tends more often to the positive state. Statistical analyses over 256
the 20th century suggest that the AMO precedes NAO by 10-15 years (Peings and Magnusdottir, 257
2014). These findings provide an interesting possibility of decadal forecasting. 258 259 3. Methods 260 3.1. GRACE observations 261
There has been great interest in the use of GRACE satellites to monitor changes in water storage, 262
especially in regions with limited ground-based data such as Africa (Henry et al., 2011; Ramilien 263
et al., 2014; Richey et al., 2015; Chen et al., 2016; Hassan and Jin, 2016; Rateb et al., 2017). 264
GRACE satellites provide a spatially filtered image of real TWS that needs to be processed to 265
13 produce information on changes in TWS. There are generally three approaches to process 266
GRACE total water storage change signals: the scaling factor approach, the additive correction 267
approach and the multiplicative correction approach. The validation of GRACE-based estimates 268
is challenging because results can differ by up to 100% depending on which processing approach 269
is used, in particular over i) (semi-)arid areas, ii) areas with intensive irrigation, and iii) relative 270
small basins (i.e. ≤200,000 km2) for which the additive correction approach may be more 271
appropriate (Long et al., 2015). It is thus imperative to compare GRACE-based estimates with 272
ground-based data to assess their validity. 273
Considering that most of the studied aquifer systems are located in arid and semi-arid areas, the 274
additive correction approach as presented by Longuevergne et al. (2010) to provide total water 275
storage estimates from 2002-2013 at a monthly basis has been used. This is based upon monthly 276
spherical harmonic (SH) gravity field solutions R05 monthly data from CSR (Center for Space 277
Research, Univ. of Texas at Austin, US), truncated at degree and order 60 (Bettadpur, 2007), 278
including a destriping filter (Swenson and Wahr, 2006) and additional 300 km Gaussian 279
smoothing. Alternate methods for leakage corrections encompass the mascon-type approach. The 280
basic difference between spherical harmonics (SH) and mascons is that SH solutions are global 281
whereas mascons can be applied at regional to global scales. A recent study has shown that 282
although long-term trends for SH are lower than those for mascons, they remain highly 283
correlated (Scanlon et al., 2016). The method used for detrending total water storage time series 284
is fitting and removing a trend model consisting of a long-term linear and seasonal cycles by 285
using linear regression (Sun et al., 2017). Results are compared with groundwater changes from 286
piezometry (ΔGWSOBSERVED) and modeled changes in total water storage (ΔTWSMODEL) in order 287
to identify any long-term covariance. Particular attention is given to aquifer systems whose area 288
14 is below the limit of the GRACE footprint (Karoo Sedimentary, Stampriet Transboundary 289
Aquifer System and Volta Basin Aquifer). 290
291
3.2. A modelling approach to extend the GRACE timeframe
292
Trends during the GRACE era (2002 – 2017) are dominated by internal climate variability (i.e., 293
arising from interactions and chaotic variability within the climate system, particularly in 294
rainfall) rather than by the forced response (i.e., driven primarily by human induced changes in 295
atmospheric composition) (Fasullo et al., 2016). Key to understanding reported changes during 296
the GRACE record is quantifying the character of internal climate modes. The GRACE era only 297
covers a very limited number of climatic oscillation cycles as some modes like the AMO, PDO, 298
and NAO have oscillation periods longer than the GRACE observation record. Several studies 299
indicate that low-frequency cycles like AMO and PDO are particularly influential in modulating 300
high-frequency cycles such as ENSO. To bridge this gap, there is a need to extend the GRACE 301
timeframe to the “past” using a model that is able to reconstruct the interannual to decadal 302
climate-driven changes in water storage. A climate-driven model to estimate long-term water 303
storage dynamics, independent from GRACE data, was developed and applied at the aquifer 304
scale. 305
According to MacDonald et al. (2012), groundwater development stress is relatively low in most 306
of the large African aquifers with renewable groundwater resources. This suggests that changes 307
in groundwater storage in such aquifers tend to be dominated by climatic variations. For that 308
reason, human influences (such as abstraction and land-use changes) are neglected in the simple 309
simulation model. This model is based on elaboration of the general water balance equation: 310
15 𝑑TWS
𝑑𝑡 = 𝑃 − 𝐸 − 𝑅 (Eq. 1) 311
where P is precipitation, E is actual evapotranspiration, R is runoff (or discharge at the basin 312
outlet), and TWS is total water storage (sum of water stored in vegetation, ice, snow, lakes and 313
streams, soil moisture and groundwater). All components are given in millimetres per month. 314
Mean precipitation and actual evapotranspiration were computed by averaging data available 315
from global datasets with spatial resolutions of 0.5° x 0.5° at aquifer scale from 1982 to 2011 316
(Global Precipitation Climatology Centre dataset for precipitation (Becker et al., 2013), and Max 317
Planck Institute dataset for actual evapotranspiration) (Jung et al., 2010). These datasets were 318
selected because of their capability to capture the regionally averaged seasonal cycles (Mueller et 319
al., 2011; Sun et al., 2018). 320
Integration of Eq. 1 gives: 321
∆TWS = ∫ 𝑃𝑑𝑡 − ∫ 𝐸𝑑𝑡 − ∫ 𝑅𝑑𝑡 (Eq. 2) 322
ΔTWS is the change of total water storage over the time interval of integration, thus it includes 323
the changes in water stored in vegetation, snow, ice, lakes and streams, soil moisture and 324
groundwater. Integration over time of P, E, and R will generate a long-term trend in ΔTWS, 325
which is attributed to integration of systematic errors in these variables. Unbiased datasets are 326
therefore required. Considering that P is the dominant factor controlling long-term variations of 327
E, and R, it is assumed that runoff is constant over time, i.e. contribution to storage as a linear
328
trend (Bouwer et al., 2006; Liu et al., 2013). By doing so, when estimating storage changes by 329
integration of R, a long-term trend related to runoff is removed. Thus, Eq. 2 becomes: 330
∆TWSMODEL = ∫ 𝑃𝑑𝑡 − ∫ 𝐸𝑑𝑡 − ∫ 𝑅𝑑𝑡 ≈ detrend(∫ 𝑃𝑑𝑡 − ∫ 𝐸𝑑𝑡) (Eq. 3) 331
In absence of detailed field data on all these storage components it is difficult to isolate the 332
change in groundwater storage (ΔGWS), but under certain circumstances ‒ to be judged by the 333
16 modeller‒ it is plausible that ΔGWS is nearly equal to ΔTWSMODEL. Such circumstances may, for 334
instance, apply to relatively long integration intervals (several years) in arid and semi-arid 335
regions where the assumed combined non-groundwater storage capacity is small compared to the 336
simulated change in total water storage (ΔTWSMODEL). 337
338
3.3.Ground-based measurements
339
Due to the general lack of continuous long-term groundwater level data, the selection of records 340
for the validation of GRACE-based estimates was done based on the limited data available in 341
literature and their representativeness. The selected records are usually located no farther than 20 342
km from surface water bodies (e.g. river, lake, oued) and tap shallow unconfined aquifers. The 343
records provide groundwater levels at a monthly basis for different periods ranging from 5 to 20 344
years (Figure 2 and Table 2). In order to compare piezometry with total water storage, long-term 345
groundwater level data were detrended by using the MATLAB function detrend that substracts 346
the mean or a best-fit line (in the least-square sense) from data. If the data do have a trend, 347
detrending forces the mean to zero and reduces overall variation. 348
INSERT TABLE 2 HERE 349
INSERT FIGURE 2 HERE 350
351
3.4.Wavelet analysis
17 Wavelet transforms to analyze teleconnections between groundwater level, GRACE-based 353
estimates, climate-driven model and climate indices time series were used both in amplitude and 354
frequency. A MATLAB script developed by Grinsted et al. (2004) that enables doing continuous 355
wavelet transform (CWT), cross wavelet transform (XWT) and wavelet coherence (WTC) plots 356
was applied. CWT expands the time series into time frequency space, XWT finds regions in time 357
frequency space where the time series show high common power and WTC finds regions in time 358
frequency space where the two time series co-vary (but does not necessarily have high power) 359
(Torrence and Compo, 1998; Labat et al., 2000; Grinsted et al., 2004; Labat 2005; 2008; Holman 360
et al., 2011). Although the three methodological steps described previously were necessarily 361
followed, the presentation of the results and discussion focuses on the WTC plots. High 362
correlation between time series is indicated by light yellow zones. The arrows → and ← in zones 363
of the WTC figures indicate the positive (in-phase) and negative (anti-phase) relationships 364
between two time-series, respectively. Meanwhile, the arrows ↓ and ↑ show that time series 1 365
lags time series 2 by 90°. The interpretation of lags in these zones can be however challenging 366
and should be done carefully as a lead of 90° can also be interpreted as a lag of 270° or a lag of 367
90° relative to the anti-phase (opposite sign). A good indication to support that there is a 368
connection and link between times series is that the phase-arrows generally point only in one 369
direction for a given wavelength. 370
371
4. Results and discussion 372
4.1. Evaluation of GRACE-based and climate-driven model estimates
18 GRACE-based and climate-driven model total water storage changes (ΔTWSGRACE and 374
ΔTWSMODEL, respectively) are compared to groundwater levels in the studied aquifers to assess 375
to what extent they covary with ΔGWSOBSERVED. All data were detrended in order to focus the 376
analysis on the fluctuations in the data. However, it is worth mentioning that total water storage 377
time series are nonlinear, nonstationary and tend to vary at multiple temporal scales, making 378
filtering and detrending of total water storage a nontrivial task (Sun et al., 2017). The data 379
were further normalized based on the mean and standard deviation of each dataset in order to 380
provide a benchmark and comparison basis. Results suggest that changes in total water storage 381
estimates describe generally well groundwater-level dynamics (Figure 3). These results are 382
further verified by wavelet transform analysis that indicate that there exists a high correlation 383
between GRACE-based and climate-driven model water storage estimates and groundwater level 384
both at intra-annual and inter-annual scale (Figure 4a and Figure 4b). Given that comparison is 385
done with groundwater level records from shallow boreholes that are located in the vicinity of 386
surface water bodies (usually <20 km) which are likely to have a strong surface water / 387
groundwater interaction, it is fair to conclude that ΔTWSGRACE, ΔTWSMODEL and 388
ΔGWSOBSERVED representative of groundwater fluctuations in shallow unconfined aquifers are 389
strongly correlated. This could also suggest that storage changes in deep aquifers are limited, 390
thus supporting the assumptions that they are not being actively recharged and that they are 391
exploited still largely at low rates. The near-synchronous signals of groundwater levels and the 392
climate-driven model water storage estimates (Figure 3, Figure 4a and Figure 4b) reveal that 393
shallow aquifers are highly responsive to rainfall temporal patterns, and reinforce the concept 394
that natural climate variability, in particular changes in precipitation, considerably contributes to 395
groundwater storage changes. 396
19 INSERT FIGURE 3 HERE
397
INSERT FIGURE 4a HERE 398
INSERT FIGURE 4b HERE 399
400
Results of the model allowed identifying four different types of groundwater storage dynamics 401
that are largely correlated with African climate zones. The model indicates that the North-402
Western Sahara Aquifer System (NWSAS) located in Northern Africa had a decrease in storage 403
from early-1980s to late-1980s, an increase in early 1990s followed by a decrease from mid-404
1990s to mid-2000s, an increase in mid-2000s, and a decrease since then (Figure 5). This is in 405
relatively good agreement with rainfall pattern and shallow groundwater fluctuation in the 406
vicinity of oueds in the Ouargla Plain in Algeria/Tunisia (Bellaoueur, 2008) and central Tunisia 407
(Massuel and Riaux, 2017) (Figure 2). The model’s water storage increase in mid-2000s also 408
supports the assumption that the shallow aquifers (including outcrops of the deep aquifers) of the 409
North-Western Sahara Aquifer System are receiving a fraction of modern water as recharge from 410
infiltration of rainfall coming from the Sahara Atlas Mountains in Algeria and the Dahar and 411
Nafusa Mountains in Tunisia and Lybia (Baba-Sy, 2005; Al-Gamal, 2011). It should be noted 412
however that groundwater abstraction in the NWSAS has steeply risen over the past decades 413
because of tapping confined aquifers by drilling deep boreholes in the 1980s for water supply 414
and irrigation schemes (OSS, 2003). These boreholes have had very little maintenance since they 415
were drilled and recently observed water table rises in shallow aquifers could be locally 416
influenced by upward leakage through corroded borehole casing (Messekher et al., 2012). 417
20 INSERT FIGURE 5 HERE
418
The aquifers located in the Sahel (Nubian Sandstone Aquifer System, Lake Chad Basin, Irhazer-419
Iullemmeden Basin, and Senegalo-Mauritanian Basin) have a similar multi-decadal behavior, 420
which is characterized by a significant decrease in groundwater storage from early-1980s to mid-421
1990s followed by a partial recovery (Figure 6). As rainfall in the Sahel has generally increased 422
since mid-1990s, this result proves to be in good agreement with the observations from 423
piezometry indicating that the water table has risen since the mid-1980s in large parts of the 424
central Sahel (Favreau et al., 2009, 2012). It also supports the assumption that rainfall infiltration 425
is a primary source of recharge, though recharge from surface water bodies such as the Niger and 426
the Nile Rivers is non-negligible and limited to the vicinities of the rivers (perennial and 427
seasonal) and endoreic ponds (Nazoumou et al., 2015; Ngounou-Ngatcha et al., 2015). Aquifers 428
located in the tropics (Volta Basin and Karoo Carbonate) show an opposite behavior although 429
changes are not as pronounced as in the aquifers in the Sahel (Figure 7). This result is in line 430
with recent observations that indicate a drying trend in central equatorial Africa (west of 431
Albertine Rift) (Diem et al., 2014) and over Guinea regions, such as Benin and Nigeria (Bamba 432
et al., 2015). 433
INSERT FIGURE 6 HERE 434
INSERT FIGURE 7 HERE 435
Contrary to the aquifers in the Sahel, the aquifers in Southern Africa do not show a particular 436
multi-decadal pattern, but rather a strong inter-annual pattern. The model indicates a decrease in 437
storage from early-1980s to late-1980s, an increase in late-1980s/early-1990s, a decrease from 438
21 early-1990s to mid-1990s/late-1990s, an increase in late-1990s/early-2000s, a decrease from 439
early-2000s to mid-2000s, and an increase since mid-2000s (Figure 8). This result is consistent 440
with studies that revealed that long-term rainfall trends in Southern Africa are weak but exhibit 441
an increased variability since 1970 (Richard et al., 2001). 442
INSERT FIGURE 8 HERE 443
4.2. Groundwater storage variability and its association with climate teleconnections
444
Groundwater storage variability and its association with climate teleconnections is studied by 445
applying wavelet transforms between simulated changes in total water storage (ΔTWSMODEL) 446
and climate indices (NAO, ENSO, and AMO). In Northern Africa, groundwater storage appears 447
to be correlated to NAO (Figure 5c). WTC reveals three regions with high coherence (good 448
correlation), i.e. 6-8 year band from 1990 to 1995 (Box 1 in Figure 5c), 1-2 year band from mid-449
1990s to mid-2000s (Box 2 in Figure 5c), and 2-3 year band from mid-2000s onwards (Box 3 in 450
Figure 5c), which indicates that NAO exerts an influence on changes in groundwater storage. 451
Positive (negative) NAO phase largely correspond to decreasing (increasing) groundwater 452
storage. The results confirm that inter-annual correlations tend to be stronger for negative NAO 453
phases (Box 2 and Box 3 in Figure 5c). This has been particularly true since the AMO shift back 454
to a positive phase in mid-1990s, thus suggesting that the AMO exerts a low-frequency 455
modulating influence on groundwater storage changes. 456
The influence of the AMO on groundwater storage appears to be much more direct in the Sahel. 457
The AMO appears to exert a multi-decadal influence as a positive (negative) phase largely 458
corresponds to increasing (decreasing) aquifer storage (Figure 6). For instance, all aquifers in the 459
22 Sahel show a significant modeled decrease in aquifer storage during a negative phase of the 460
AMO from the early-1980s to mid-1990s followed by an increase in groundwater storage during 461
a positive phase of the AMO since the mid-1990s. Mega-droughts in the Sahel are considered to 462
be linked to the combined effect of the negative phase of the AMO and El Niño events 463
(Shanahan et al., 2009; Masih et al., 2014). Such combination also appears to have a substantial 464
adverse effect on groundwater storage as it could potentially result, depending on recharge 465
processes in play, in both reduced recharge to the aquifers and in water level declines attributed 466
to climate-induced pumping (Gurdak 2017; Russo and Lall 2017). The AMO exerts an opposite 467
influence in the aquifers located in the tropics (Volta Basin and Karoo Carbonate), as positive 468
(negative) phase largely corresponds to (increasing) decreasing groundwater storage (Figure 7). 469
Total water storage and consequently groundwater storage inter-annual variability both in the 470
Sahel and in Equatorial Africa are likely to be impacted by ENSO, as WTC plots for the Nubian 471
Sandstone Aquifer System and the Senegalo-Mauritanian Basin (Figure 9) and for the Volta 472
Basin and Karoo Carbonate Aquifers (Figure 10) reveal several regions with high coherence 473
(good correlation). These regions largely coincide with El Niño events (1982-1983, 1986-1988, 474
1991-1992, and 1997-1998) and La Niña events (1998-2000). A recent study by Siamand Eltahir 475
(2017) revealed a strong correlation between ENSO, rainfall and flow in the Nile basin. El Niño 476
years usually lead to drought conditions, whereas La Niña years are more flood-prone. 477
Considering that recharge of the shallow aquifers mainly occurs by rainfall infiltration and 478
river/surface water interaction, it could be assumed that El Niño (La Niña) years could lead to 479
decreased (increased) groundwater storage. This assumption could be extended to the Sahel 480
and/or Equatorial Africa as similar observations have been found for Lake Chad (Okonkwo et 481
al., 2015), the Senegal and Niger River basins (Diaw et al., 2012; Nazoumou et al., 2015), and 482
23 Lake Volta (Owusu et al., 2008). Due to the relative shortage of long-term climate data, any 483
assumption on cause-effect relationship in the correlation results of the model and climate 484
indices in Central Africa is particularly more complex as there has been only a very limited 485
number of studies of the climate of this region (Philippon et al., 2012). Central Africa has the 486
lowest gauge density in sub-Saharan Africa (Washington et al., 2013) and has seen a dramatic 487
decline in the number of rain gauges, especially after 1980s (Asefi-Najafabady and Saatchi, 488
2013, Zhou et al., 2014). Studies diverge in their conclusions in this region. According to Gao et 489
al. (2016), drier conditions are associated with El Niño events while Taylor et al. (2013) suggest 490
that the influence of ENSO varies spatially and studies in has indicated an opposite pattern as El 491
Niño years are associated to increases in recharge generated by heavy rainfall (Taylor et al., 492
2013). 493
INSERT FIGURE 9 HERE 494
INSERT FIGURE 10 HERE 495
WTC plots for the Stampriet Transboundary Aquifer System and the Karoo Sedimentary Aquifer 496
in Southern Africa also reveal important correlation between groundwater storage and ENSO 497
events with El Niño (La Niña) events usually leading to drier (wetter) conditions and decreasing 498
(increasing) water levels (Figure 8). The dynamics of these aquifers are not similar and thus 499
indicates that other climate modes might also be exerting an influence in Southern Africa. 500
Previous studies present clear evidence of the importance of the Indian Ocean Dipole (IOD) 501
index in modulating rainfall variability in Eastern Africa (Taylor et al., 2013b). The IOD has 502
traditionally been linked to ENSO (Marchant et al., 2006; Fan and Liu, 2017). Major ENSO 503
warm (El Niño) events combined with a positive phase of the IOD have led to wet extremes and 504
24 significant recharge in the Karoo Sedimentary Aquifer (Figure 11). Conclusions about the 505
correlation between the IOD and groundwater storage changes for the Nubian Aquifer Sandstone 506
System and the Karoo Carbonate Aquifer are more challenging because the influence of IOD 507
varies across the aquifer basin (Awange et al., 2014; Onyutha and Willems, 2017) and because of 508
the lack of data, respectively. 509
INSERT FIGURE 11 HERE 510
511
5. Conclusions 512
A two-variables climate-driven model using precipitation and actual evapotranspiration data 513
from global datasets was developed to reconstruct past total water storage changes in Africa from 514
1982 to 2011. Although the model has the important limitation of not considering human 515
influences such as abstraction, land-use changes, and dam management, it offers robust pointers 516
to assess the monthly dynamics of groundwater storage at very little computational cost as 517
model-based total water storage changes ΔTWSMODEL and observed groundwater storage 518
changes ΔGWSOBSERVED (representative of shallow groundwater fluctuations) are strongly 519
correlated. GRACE-based ΔTWSGRACE estimates are also highly correlated with model-based 520
ΔTWSMODEL and ΔGWSOBSERVED. As GRACE Follow-On (GRACE-FO) mission is scheduled to 521
be launched in early 2018, ΔTWSGRACE estimates will thus prove to be a well-founded tool to 522
provide a general overview at basin scale of groundwater storage changes that are associated to 523
shallow groundwater fluctuations and that are likely to have a strong interaction with surface 524
25 water. The near-synchronous signals of groundwater levels, GRACE and the climate-driven 525
model estimates reveal that shallow aquifers are highly responsive to rainfall temporal patterns. 526
Obtained results indicate that recharge from rainfall patterns associated to NAO and ENSO are 527
the main drivers of inter-annual groundwater storage changes in Northern Africa and Sub-528
Saharan Africa, respectively. The AMO plays a significant role in decadal to multi-decadal 529
variability, particularly in the Sahel as positive (negative) AMO phase largely corresponds to 530
increasing (decreasing) groundwater storage. The AMO has been in a positive phase since mid-531
1990s and as a result, this has contributed to a water table rise in large parts of the Sahel. A 532
change of phase could have an overwhelming impact on surface-water and groundwater 533
resources, as mega-droughts in the early 1980s in the Sahel are tied to the combined effect of a 534
negative phase of the AMO and a positive phase of the ENSO. These devastating droughts could 535
trigger significant groundwater storage changes, resulting in reduced recharge to the shallow 536
aquifers and water level declines attributed to climate-induced pumping from dug-wells and 537
shallow boreholes. 538
The findings of this study could be beneficial to decision-makers and help to adequately prepare 539
effective climate variability and change adaptation plans both at national and transboundary 540
level. National groundwater governance frameworks in Africa usually need either reviewing and 541
upgrading water laws and policies or completing water law with regulations (FAO, 2015). 542
Integrating climate variability aspects into water laws and policies (e.g. drought and flood 543
management plans, provisions for Managed Aquifer Recharge (MAR) schemes), strengthening 544
national meteorological, hydrological and groundwater-monitoring networks, and in particular 545
strengthening links between water decision-makers and meteorological institutions are crucial 546
measures for improving groundwater governance with special reference to climate change. 547
26 Integrated Water Resources Management (IWRM) is now widely accepted by water decision-548
makers as the way forward for efficient, equitable and sustainable development and management 549
of the world’s limited water resources and for coping with conflicting demands (UNESCO, 550
2009). IWRM structures in Africa are rolled out across the continent with the present focus on 551
the establishment of river basin / catchment organizations at national and transboundary level. 552
However, groundwater is still poorly integrated into these organizations’ IWRM and climate 553
adaptation plans. MAR is a promising adaptation approach to reduce vulnerability to climate 554
variability and aquifer over-exploitation. Findings from this study illustrate that MAR operations 555
might take advantage of temporal patterns in precipitation to enhance recharge during the 556
corresponding wet phases of ENSO, NAO, and AMO. Institutions in charge of the management 557
of groundwater resources at national and transboundary level, as well as river basin / catchment 558
organizations, should strengthen their support to MAR programs and initiatives to incentivize 559
local water managers to store excess renewable water in aquifers during wet periods which can 560
be used to off-set limited surface-water supplies during dry periods. The findings suggest that 561
preferred periods for artificial recharge are negative phases of the NAO in Northern Africa, 562
positive phases of the AMO in the Sahel, and La Niña years in Southern Africa. Finally, it is 563
worth emphasizing that developing long-term effective and reliable strategies for coping with 564
water scarcity threats and climate variability and change will also have to overcome the fact that 565
there are still large uncertainties and limited adequate data for decision-making. In this regard, it 566
is also important to undertake joint actions in data collection interpretation and reporting as a 567
means to promote inter-basin/inter-aquifer collaboration, to harmonise strategies and promote 568
exchange of experiences. 569
27 References:
571
Abdou Babaye, M.S., Orban, P., Ousmane, B., Favreau, G., Brouyère, S., Dassargues, A. (2018) 572
Characterisation of recharge mechanisms in a Precambrian basement aquifer in semi-arid south-573
west Niger. Hydrogeology Journal, https://link.springer.com/article/10.1007/s10040-018-1799-x 574
Al-Gamal, S. (2011) An assessment of recharge possibility to North-Western Sahara Aquifer 575
System (NWSAS) using environmental isotopes. Journal of Hydrology, 398, pp. 184-190, 576
doi:10.1016/j.jhydrol.2010.12.004. 577
Altchenko, Y.; Villholth, K. G. (2015) Mapping irrigation potential from renewable groundwater 578
in Africa – a quantitative hydrological approach, Hydrology and Earth System Sciences, 19, pp. 579
1055-1067, doi:10.5194/hess-19-1055-2015. 580
Asefi-Najafabady, S., Saatchi, S. (2013) Response of African humid tropical forests to recent 581
rainfall anomalies. Philosophical Transactions of the Royal Society B: Biological Sciences, 582
368(1625), 20120306, doi:10.1098/rstb.2012.0306.
583
Awange, J.L., Forootan, E., Kuhn, M., Kusche, J., Heck, B. (2014) Water storage change and 584
climate variability within the Nile Basin between 2002 and 2001. Advances in Water Resources, 585
73, pp. 1-15, doi : 10.1016/j.advwatres.2014.06.010.
586
Baba-Sy, J. (2005) Recharge et paléorecharge du système aquifère du Sahara septentrional, 587
Ph.D. Thesis, Univ. Tunis, Tunisia. 588
Bamba, A., Dieppois, B., Konaré, A., Pellarin, T., Balogun, A., Dessay, N., Kamagaté, B., 589
Savané, I. and Diédhiou, A. (2015) Changes in Vegetation and Rainfall over West Africa during 590
the Last Three Decades (1981-2010). Atmospheric and Climate Sciences, 5, pp. 367-379, 591
doi:10.4236/acs.2015.54028. 592
28 Bates, B.C., Kundzewicz Z.W., Wu S. and J.P. Palutikof (eds) (2008) Climate Change and
593
Water. Technical Paper of the Intergovernmental Panel on Climate Change, IPCC Secretariat, 594
Geneva, 210 pp. 595
Becker, A., Finger, P., Meyer-Christoffer, A., Rudolf, B., Schamm, K., Schneider, U. and Ziese, 596
M. (2013) A description of the global land-surface precipitation data products of the Global 597
Precipitation Climatology Centre with sample applications including centennial (trend) analysis 598
from 1901–present, Earth System Science Data, 5, pp. 71-99, doi:10.5194/essd-5-71-2013. 599
Bellaoueur, A.A. (2008) Etude hydrogéologique des eaux souterraines de la région de Ouargla 600
soumise à la remontée des eaux de la nappe phréatique et perspectives de solutions palliatives 601
(Sahara Nord-Est Septentrional – Algérie) (Hydrogeological study of groundwater in the Ouargla 602
region subjected to upwelling of the water table and prospects of palliative solutions (North-603
Eastern Sahara - Algeria)). MSc. Thesis, Univ. El-Hadj Lakhdar – Batna, Algeria. 604
Bettadpur, S. (2007) Level-2 gravity field product user handbook, GRACE 327-734, GRACE 605
Proj. Cent. For Space Res., Univ. of Texas, Austin. 606
BGR and UNESCO (2008) Groundwater Resources of Africa [map]. World-wide 607
Hydrogeological Mapping and Assessment Programme (WHYMAP). 608
https://www.whymap.org/whymap/EN/Maps_Data/Additional_maps/addimaps_node_en.html. 609
Cited 6 June 2017. 610
Bouwer, L.M., Aerts, J.C., Droogers, P., Dolman, A.J. (2006) Detecting the long-term impacts 611
from climate variability and increasing water consumption on runoff in the Krishna river basin 612
(India), Hydrology and Earth System Sciences, 10, pp. 703-713, doi: 10.5194/hess-10-703-2006. 613
Chelliah, M. and Bell, G.D. (2004) Tropical multidecadal and interannual climate variations in 614
the NCEP–NCAR reanalysis. Journal of Climate, 17, pp. 1777–1803, doi: 10.1175/1520-0442. 615
29 Chen, J., Famiglietti, J.S., Scanlon, B.R., Rodell, M. (2016) Groundwater Storage Changes: 616
Present Status from GRACE Observations. Surveys in Geophysics, 37(2), pp. 397 – 417, doi: 617
10.1007/s10712-015-9332-4. 618
Cuthbert, M.O., Gleeson, T., Reynolds, S.C., Bennett, M.R., Newton, A.C., McCormack, C.J. 619
and Ashley, G.M. (2017) Modelling the role of groundwater hydro-refugia in East African 620
hominin evolution and dispersal, Nature Communications, 8, doi:10.1038/ncomms15696. 621
Diatta, S., Fink, A. H. (2014) Statistical relationship between remote climate indices and West 622
African monsoon variability. International Journal of Climatology, 34, pp. 3348–3367, 623
doi:10.1002/joc.3912. 624
Diaw, F., Stichler, W., Mloszewski, P. (2012) Isotopic and geochemical characteristics of 625
groundwater in the Senegal River delta aquifer: implication of recharge and flow regime. 626
Environmental Earth Sciences, 66, 4, pp. 1011-1020, doi: 10.1007/s12655-010-0710-4.
627
Diem, J.E., Ryan, S.J, Hartter, J., Palace, M.W. (2014) Satellite-based rainfall data reveal a 628
recent drying trend in central equatorial Africa. Climatic Change, 126(1-2), pp. 263–272, doi: 629
10.1007/s10584-014-1217-x. 630
Donat, M. G., Peterson, T. C., Brunet, M., King, A.D., Almazroui, M., Kolli, R.K., Boucherf, D., 631
Al-Mulla, A.Y., Nour, A.Y., Aly, A.A., Ali Nada, T.A., Semawi, M.M., Al Dashti, H.A., Salhab, 632
T.G., El Fadli, K.I., Muftah, M.K., Eida, S.D., Badi, W., Driouech, F., El Rhaz, K., Abubaker, 633
M.J.Y., Ghulam, A.S., Erayah, A.S., Mansour, M.B., Alabdouli, W.O., Al Dhanhani, J.S. and Al 634
Shekaili, M .N. (2014) Changes in extreme temperature and precipitation in the Arab region: 635
long-term trends and variability related to ENSO and NAO. International Journal of 636
Climatology, 34, pp. 581–592, doi:10.1002/joc.3707.
30 Dong, B., Sutton, R.T. (2007) Enhancement of ENSO Variability by a Weakened Atlantic
638
Thermohaline Circulation in a Coupled GCM. Journal of Climate, 20, pp. 4920–4939, 639
doi:10.1175/JCLI4284.1. 640
Dong, B., Sutton, R.T., Scaife, A.A. (2006) Multidecadal modulation of El Niño – Southern 641
Oscillation (ENSO) variance by Atlantic Ocean sea surface temperatures, Geophysical Research 642
Letters, 33, doi:10.1029/ 2006GL025766.
643
Edmunds, W.M. (2008) ‘Groundwater in Africa – Palaeowater, climate change and modern 644
recharge’ in Adelana S.M.A. and MacDonald A.M. (eds) Applied groundwater research in 645
Africa. IAH Selected Papers in Hydrogeology 13. Amsterdam: Taylor and Francis. 646
El Shazli, Ahmed (2018) Water balance of the Aswan High Dam Reservoir. Ph.D. Thesis, Kiel 647
University. 648
Falkenmark, M. (2013) Adapting to climate change: towards societal water security in dry-649
climate countries. International Journal of Water Resources Development, 29, pp. 123-136, 650
doi:10.1080/07900627.2012.721714. 651
Famiglietti, J.S. (2014) The global groundwater crisis. Nature Climate Change, 4, pp. 945-948, 652
doi :10.1038/nclimate2425. 653
Fan, L. and Liu, Q. (2017) Indian Ocean Dipole Models Associated with Different Types of 654
ENSO Development. Journal of Climate, 30, pp. 2233–2249, doi: 10.1175/JCLI-D-16-0426.1. 655
FAO (2015) Global Diagnostic on Groundwater Governance (Special edn. For World Water 656
Forum 7). Groundwater Governance – A Global Framework for Action, GEF Groundwater 657
Governance Project. http://www.groundwatergovernance.org. Cited 6 June 2017. 658
31 Fasullo, J.T., Lawrence, D.M., Swenson, S.C. (2016) Are GRACE-era Terrestrial Water Trends 659
Driven by Anthropogenic Climate Change? Advances in Meteorology, vol. 2016, 660
doi:10.1155/2016/4830603. 661
Favreau, G., Cappelaere, B., Massuel, S., Leblanc, M., Boucher, M., Boulain, N. and Leduc, C. 662
(2009), Land clearing, climate variability, and water resources increase in semiarid southwest 663
Niger: A review. Water Resources Research, 45, doi:10.1029/2007WR006785. 664
Favreau, G., Nazoumou, Y., Leblanc, M., Guéro, A., Goni, I.B. (2012) Groundwater resources in 665
the Iullemmeden Basin, West Africa. In: Treidel, H., Martin-Bordes, J.L., Gurdak, J.J. (Eds.) 666
Climate Change Effects on Groundwater Resources: A Global Synthesis of Findings and 667
Recommendations”. International Contributions to Hydrogeology, 27, 7, pp. 113-128, CRC 668
Press Inc., Leiden, The Netherlands. 669
Fontes, J.C., Andrew, J.N., Edmunds, W.M., Guerre, A., Travi, Y. (1991) Paelorecharge by the 670
Niger River (Mali) deduced from groundwater geochemistry, Water Resources Research, 27, 2, 671
pp. 199-214, doi:10.1029/90WR01703. 672
Foster, S., Tuinhof, A., Garduño, H. (2006) Groundwater Development in Sub-Saharan Africa: A 673
Strategic Overview of Key Issues and Major Needs. World Bank GWP Associate Program. 674
Sustainable Groundwater Management: Concepts and Tools. Case Profile Collection No. 15. 675
Gao, H., Zhang, S., Fu, R., Li, W. and Dickinson, R.E. (2016) Interannual Variation of the 676
Surface Temperature of Tropical Forests from Satellite Observations. Advances in Meteorology, 677
doi:10.1155/2016/4741390. 678
García-García, D., Ummenhofer, C.C. (2015) Multidecadal variability of the continental 679
precipitation annual amplitude driven by AMO and ENSO, Geophysical Research Letters, 42, 680
pp. 526–535, doi:10.1002/2014GL062451. 681
32 Gaye, C.B., Tindimugaya, C. (2012) Challenges and opportunities for sustainable groundwater 682
management in Africa. International Symposium, Enhancing Water Management Capacity in a 683
Changing World, Sao Paulo, June 2012. 684
Geng, X., Zhang, W., Stuecker, M.F., Liu, P., Jin, F.F., Tan, G. (2016) Decadal modulation of 685
the ENSO-East Asian winter monsoon relationship by the Atlantic Multidecadal Oscillation, 686
Climate Dynamics, 11, doi:10.1007/s00382-016-3465-0.
687
Giannini, A., Saravanan, R., Chang, P. (2003) Oceanic forcing of Sahel rainfall on interannual to 688
interdecadal time scales. Science, 302, pp. 1027-1030, doi:10.1126/science.1089357. 689
Giles, J. (2005) Solving Africa’s climate data problem. Nature, 435, pp. 862-863, doi: 690
10.1038/435862a. 691
Gleeson, T., Wada, Y., Bierkens, M.F.P., van Beek, L.P.H. (2012) Water balance of global 692
aquifers revealed by groundwater footprint, Nature, 488, pp. 197-200, doi:10.1038/nature11295. 693
Gning, A.A. (2015) Etude et modélisation hydrogéologique des interactions eaux de surface-694
eaux souterraines dans un context d’agriculture irriguée dans le delta du fleuve Sénégal 695
(Hydrogeological study and modeling of surface water-groundwater interactions in an irrigated 696
agriculture context in the Senegal River delta), Ph.D. Thesis, Univ. De Liège, Belgium. 697
Gorelick, S.M., Zheng, C. (2015) Global change and the groundwater management challenge, 698
Water Resources Research, 51(5), pp. 3013-3051, doi:10.1002/2014WR016825.
699
Green, T., Taniguchi, M., Kooi, H., Gurdak, J.J., Allen, D.M., Hishcock, K.M., Treidel, H. and 700
Aureli, A. (2011) Beneath the surface of global change: Impacts of climate change on 701
groundwater. Journal of Hydrology, 405, pp. 532-560, doi:10.1016/j.jhydrol2011.05.002. 702
33 Grinsted, A., Moore, J.C., Jevrejeva, S. (2004) Application of the cross wavelet transform and 703
wavelet coherence to geophysical time series, Nonlinear Processes in Geophysics, 11, pp. 561– 704
566, doi:10.5194/npg-11-561-2004. 705
Gurdak, J.J. (2017) Groundwater: Climate-induced pumping. Nature Geoscience, 10(71), 706
doi :10.1038/ngeo2885. 707
Gurdak, J.J., Hanson, R.T., McMahon, P.B., Bruce, B.W., McCray, J.E., Thyne, G.D. and 708
Reedy, R.C. (2007) Climate variability controls on unsaturated water and chemical movement, 709
High Plains aquifer, USA. Vadose Zone Journal, 6(2), pp. 533-547, doi:10.2136/vzj/2006.0087. 710
Hanson, R.T., Newhouse, M.W., Dettinger, M.D. (2004) A methodology to assess relations 711
between climatic variability and variations in hydrologic time series in the southwestern United 712
States. Journal of Hydrology, 287, pp. 252-269, doi:10.1016/j.jhydrol.2003.10.006. 713
Hassan, A., Jin, S.G. (2016) Water storage changes and balances in Africa observed by satellite 714
gravimetry and hydrologic models. Geodesy and Geodynamics, 7(1), pp. 39–49, 715
doi:10.1016/j.geog.2016.03.002. 716
Henry, C.M., Allen, D.M., Huang, J. (2011) Groundwater storage variability and annual recharge 717
using well-hydrograph and GRACE satellite data. Hydrogeology Journal, 19, 2, pp. 741-755, 718
doi:10.1007/s10040-011-0724-3. 719
Holman, I.P., Rivas-Casado, M., Bloomfield, J.P., Gurdak, J.J. (2011) Identifying non-stationary 720
groundwater level response to North Atlantic ocean-atmosphere teleconnection patterns using 721
wavelet coherence. Hydrogeology Journal, 19, pp. 1269-1278, doi:10.1007/s10040-011-0755-9. 722
Houghton-Carr, H.A., Fry, M. J. (2006) The decline of hydrological data collection for 723
development of integrated water resource management tools in Southern Africa, Climate 724
34 Variabilibilty and Change – Hydrological Impacts, Proceedings of the Fifth FRIEND World 725
Conference, IAHS Publ. 308. 726
Hurrell, J.W. (1995) Decadal trends in the north atlantic oscillation: regional temperatures and 727
precipitation. Science, 4, pp. 676-679, doi:10.1126/science.269.5224.676. 728
Hurrell, J.W., Kushnir, Y., Ottersen, G., Visbeck, M. (2003) An overview of the North Atlantic 729
Oscillation. In: Hurrell, J.W., Kushnir, Y., Ottersen, G., Visbeck, M. (eds) Geophysical 730
Monograph Series. American Geopphysical Union, Washington, D.C., pp. 1-35. 731
IGRAC (2017) Global Groundwater Monitoring Network – GGMN. https://ggmn.un-igrac.org. 732
Cited 6 June 2017. 733
IGRAC-UNESCO (2015) Transboundary Aquifers of the World [map]. Edition 2015. Scale 1 : 734
50 000 000. Delft, Netherlands : IGRAC, 2015. 735
Janicot, S., Ganiaux, G., Chauvin, F., de Coetlogon, G., Fontaine, B., Hall, N., Kiladis, G., 736
Lafore, J.P., Lavaysse, C., Lavender, S.L., Leroux, S., Marteau, R., Mounier, F., Philippon, N., 737
Roehrig, R., Sultan, B. and Taylor, C.M. (2011) Intraseasonal variability of the West African 738
monsoon, Atmospheric Science Letters, 12(1), pp. 58-66, doi:10.1002/asl.280. 739
Jung, M., Reichstein, M., Ciais, P., Seneviratne, S.I., Sheffield, J., Goulden, M.L., Bonan, G., 740
Cascatti, A., Chen, J., de Jeu, R., Dolman, A.J., Eugster, W., Gerten, D., Gianelle, D., Gobron, 741
N., Heinke, J., Kimball, J., Law, B.E., Montagnani, L., Mu, Q., Mueller, B., Oleson, K., Papale, 742
D., Richardson, A.D., Roupsard, O., Running, S., Tomelleri, E., Viovy, N., Weber, U., Williams, 743
C., Wood, E., Zaehle, S. and Zhang, K. (2010) Recent decline in the global land 744
evapotranspiration trend due to limited moisture supply. Nature, 467, pp. 951-954, 745
doi:10.1038/nature09396. 746
35 Knudsen, M.F., Seidenkrantz, M-S., Jacobsen, B.H. (2011) Tracking the Atlantic Multidecadal 747
through the last 8,000 years. Nature Communications, 2, p. 178, doi:10.1038/ncomms1186. 748
Konikow, L.F. (2015) Long-Term Gorundwater Depletion in the United States. Groundwater, 749
53(1), pp. 2-9, doi:10.1111/gwat.12306. 750
Kuss, A.J.M., Gurdak, J.J. (2014) Groundwater level response in U.S. principal aquifers to 751
ENSO, NAO, PDO, and AMO. Journal of Hydrology, 519, pp. 1939-1952, 752
doi:10.1016/j.jhydrol.2014.09.069. 753
Labat, D. (2005). Recent advances in wavelet analyses: Part 1. A review of concepts. Journal of 754
Hydrology, 314, pp. 275-288, doi:10.1016/j.jhydrol.2005.04.003.
755
Labat, D. (2008). Wavelet analysis of the annual discharge records of the world’s largest rivers. 756
Advances in Water Resources, 31(1), pp. 109-117, doi:10.1016/j.advwatres.2007.07.004.
757
Labat, D., Ababou, R., Mangin, A (2000) Rainfall–runoff relations for karstic springs.Part II: 758
Continuous wavelet and discrete orthogonal multiresolution analyses. Journal of Hydrology, 759
238, pp. 149–178, doi:10.1016/S0022-1694(00)00322-X.
760
Lapworth, D.J., McDonald, A.M., Tijani, M.N., Darling, W.G., Gooddy, W.G., Bonsor, H.C., 761
Araguas-Araguas, L.J. (2013) Residence times of shallow groundwater in West Africa: 762
implications for hydrogeology and resilience to future changes in climate. Hydrogeology 763
Journal, 21, 3, pp. 673-686, doi: 10.1007/s10040-012-0925-4. 764
Li, J., Xie, S.P., Cook, E.R.,Morales, M.S., Christie, D.A., Nathaniel, C.J., Chen, F., D’Arrigo, 765
R., Fowler, A.M., and Gou, X. and Fang, K. (2013) El Niño modulations over the past seven 766
centuries. Nature Climate Change, 3, pp. 822-826, doi :10.1038/nclimate1936. 767