HAL Id: hal-00297397
https://hal.archives-ouvertes.fr/hal-00297397
Submitted on 3 Mar 2006
HAL is a multi-disciplinary open access
archive for the deposit and dissemination of
sci-entific research documents, whether they are
pub-lished or not. The documents may come from
teaching and research institutions in France or
abroad, or from public or private research centers.
L’archive ouverte pluridisciplinaire HAL, est
destinée au dépôt et à la diffusion de documents
scientifiques de niveau recherche, publiés ou non,
émanant des établissements d’enseignement et de
recherche français ou étrangers, des laboratoires
publics ou privés.
ENSO effects on primary productivity in Southern
Atacama desert
F. A. Squeo, Y. Tracol, D. López, J. R. Gutiérrez, A. M. Cordova, J. R.
Ehleringer
To cite this version:
F. A. Squeo, Y. Tracol, D. López, J. R. Gutiérrez, A. M. Cordova, et al.. ENSO effects on primary
productivity in Southern Atacama desert. Advances in Geosciences, European Geosciences Union,
2006, 6, pp.273-277. �hal-00297397�
© 2006 Author(s). This work is licensed under a Creative Commons License.
Geosciences
ENSO effects on primary productivity in Southern Atacama desert
F. A. Squeo1,2,3, Y. Tracol2, D. L´opez2, J. R. Guti´errez1,2,3, A. M. Cordova2, and J. R. Ehleringer4 1Departamento de Biolog´ıa, Facultad de Ciencias, Universidad de La Serena, Casilla 599, La Serena, Chile 2Centro de Estudios Avanzados en Zonas ´Aridas (CEAZA), Casilla 599, La Serena, Chile
3Instituto de Ecolog´ıa y Biodiversidad (IEB), Universidad de Chile, Casilla 653, Santiago, Chile 4Department of Biology, University of Utah, USA
Received: 7 August 2005 – Revised: 31 January 2006 – Accepted: 2 February 2006 – Published: 3 March 2006
Abstract. In the winter-rain southern Atacama Desert of the
Coquimbo Region of Chile, El Ni˜no – Southern Oscillation (ENSO) events modulate primary productivity. In this re-gion, there are important changes in water availability be-tween La Ni˜na (dry) and El Ni˜no (rainy) years. Using inter-annual comparisons of LANDSAT images from 30◦to 31◦S latitude, we observed changes in primary productivity be-tween dry and rainy years at the regional level. There were also significant, negative correlations between productivity and elevation, with changes occurring first at low elevation during rainy years. The limiting factors to dryland vegeta-tion primary productivity is different in regard to elevavegeta-tion. Rain during an El Ni˜no year is the main factor that explains the increase in primary productivity at low elevation, while lower temperatures reduce and delay the net primary produc-tivity at mid elevation.
1 Introduction
El Ni˜no – Southern Oscillation (ENSO) events have con-trasted effects on precipitation regimes in different world re-gions, either increasing or decreasing rainfall. In the western coastal regions of the Americas, an ENSO event is associated with increased precipitation (Allan et al., 1996; Montecinos and Aceituno 2003). This increase in precipitation enhances plant productivity in terrestrial ecosystems; this effect is es-pecially dramatic in desert ecosystems where water is the main limiting factor to plant productivity (Holmgren et al., 2006). An ENSO event could be considered a quasi-periodic phenomenon, with a periodicity of three to seven years, and a magnitude modulated by the interdecadal oscillations (El Viejo/La Vieja) (Cai et al., 2004).
In addition to precipitation, other climatic factors such as temperature, coastal fog and atmospheric thermal inversion could be modified during El Ni˜no years, and the reverse
situ-Correspondence to: F. A. Squeo
(f squeo@userena.cl)
ation could also be presented during La Ni˜na years (Allan et al., 1996).
There is evidence that ENSO events have occurred for 10 000 years. Vegetation has evolved under environmental pressure, and could be considered an integral natural phe-nomenon (Rosenthal and Broccoli, 2004; Squeo et al., 2001). An El Ni˜no event with a temperature anomaly +0.5◦C in Ni˜no Region 3.4 (bounded by 120◦W–170◦W longitude and 5◦S–5◦N latitude) (Trenberth, 1996, 1997) is teleconnected with an increase in precipitation in north-central Chile (30◦– 35◦S latitude), with a delay of 6 months. During El Ni˜no episodes there is a trend of above-average precipitation be-tween 30◦ and 35◦S latitude in winter (June to August), while a trend of below-average precipitation is characteris-tic during La Ni˜na events (Montecinos and Aceituno, 2003). Increase in plant productivity during rainy El Ni˜no years has been reported for coastal desert ecosystems in north-central Chile (Vidiella et al., 1999; Olivares and Squeo, 1999; Holm-gren et al., 2006). Most of the reports of El Ni˜no effects are qualitative, such as “the flowering desert” (Dillon et al., 1996). However, few works have the possibility to compare effect on plant productivity in all the climatic condition dur-ing an ENSO cycle, includdur-ing La Ni˜na dry years. In other cases, the observations have been realized in small areas or considering a few groups of plants.
High definition satellite images allow us to determine plant productivity on a regional to local scale concurrently, without the problem of accessibility. Comparison between seasons or years, and between different geographic regions are also possible, allowing for a better understanding of La Ni˜na and El Ni˜no effects in plant productivity.
The main goal of this study is to evaluate the primary pro-ductivity of two contrasting years associated with La Ni˜na and El Ni˜no events in low and midland areas of north-central Chile, using the soil-adjusted vegetation index (SAVI; Huete 1988).
274 F. A. Squeo et al.: ENSO effects on primary productivity in Southern Atacama desert
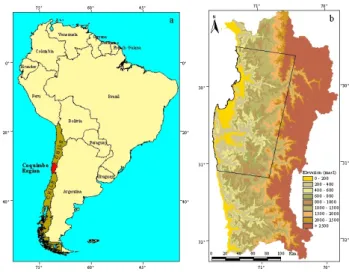
Figure 1: Study area and LANDSAT scene: a) Coquimbo Region (Chile) in South America, b) elevation gradient in Coquimbo Region, with LANDSAT image scheme.
12
Fig. 1. Study area and LANDSAT scene: (a) Coquimbo Region (Chile) in South America, (b) elevation gradient in Coquimbo Re-gion, with LANDSAT image scheme.
2 Methods
2.1 Study zone
Shrubland vegetation dominates the semi-arid zone located between 29 and 32.2◦S latitude and 70◦and 72◦W longitude at the southern part of the Atacama Desert, in the Coquimbo Region of Chile (Fig. 1). Approximately 75% of the Co-quimbo region is considered lowland (0–1000 m a.s.l.) and midland (1000–2000 m a.s.l.) shrubland, while agricultural areas represent less than 3%.
Rainfall occurs in an exclusive monomodal pattern cen-tered during the winter months in the southern hemisphere (June to September) (Squeo et al., 2004). Annual pre-cipitation measurements from the meteorological station El Romeral (1956–2003), located in the coastal dryland (29◦430S latitude, 71◦150W longitude, 300 m a.s.l.), show an average of 82.9 mm (76.5 mm in the last 30 years), with rainy years associated to ENSO events (Squeo et al., 2006). The annual precipitation and precipitation anomaly values for El Romeral were 34.1 mm and −0.59, respectively, in 1999, and 144.5 mm and 0.73, respectively, in 2002. The an-nual average of the Multivariate ENSO Index (MEI) (Wolter, 1987; Wolter and Timlin, 1998) for the study years were
−0.82±0.07 (±SE) in 1999 (a La Ni˜na year) and 0.78±0.13 in 2002 (an El Ni˜no year) (data from http://www.cdc.noaa. gov/people/klaus.wolter/MEI/).
2.2 Landsat scenes process
We used a set of LANDSAT images from position Path 001, Row 81 that focuses on the coastal to pre-alpine area of the Coquimbo Region (Fig. 1b). The images were taken be-tween spring and summer of a La Ni˜na year (1999–2000) and an El Ni˜no year (2002–2003) (Table 1). All the images were previously processed using geometric and atmospheric
Table 1. Dates of the images Landsat TM used in this study. La Ni˜na 1999–2000 El Ni˜no 2002–2003 28 September 1999 20 September 2002 7 November 1999 7 November 2002 10 January 2000 26 January 2003 14 March 2000 15 March 2003
corrections with ENVI 4.1 (Chuvieco, 1990; Chavez, 1996; Richards and Jia, 1999; ENVI, 2002; Chander and Markham, 2003). According to Chander and Markham (2003), it is expected that a radiometric accuracy of ±5% could be ob-tained by reprocessing raw archival data with these lifetime calibration updates. The Dynamic Ranges are obtained from Spectral Radiances, LMIN and LMAX in W/(m2sr µm) for LANDSAT-5 and LANDSAT-7 (Chavez, 1996; Chander and Markham, 2003).
To reduce the influence of the soil type below the veg-etation, we calculated the Soil Adjusted Vegetation Index (SAVI) using ENVI 4.1 and applied it to eight LANDSAT images as a productivity index (Huete, 1988)(Eq. 1):
SAVI=(1 + L)(NIR−RED)/(NIR + RED + L) (1)
Where NIR = near infrared (band 4, 0.7–1.1 µm), RED=red (band 3, 0.6–0.7 µm), and L is a parameter to min-imize the soil influence (ranging from 0 to 1). Its value, as determined for arid zones by Huete (1985, 1988), is 0.5. Ac-cording to Huete (1988), SAVI is the best index used to char-acterize the arid zone vegetation, knowing the sparse distri-bution of vegetation between bared soil patches.
For each month, we calculated the difference between im-ages of a La Ni˜na year and an El Ni˜no year (delta SAVI), using ArcView 3.3 with Spatial Analyses module 2.0 (ESRI 1996). The delta SAVI averages for each altitude range were obtained using a digital elevation model for the area. The delta SAVI values were between +3 and −3 units.
Natural grassland and shrubland (i.e., dryland) areas were identified using the Land Use and Vegetation Spa-tial Database (CONAF, 2004). The original area of the LANDSAT images was 15 166.11 km2, and dryland com-prised 14 044.27 km2 of that area. Irrigated and cultivated land was excluded.
Using LANDSAT, the absolute surface (brightness) tem-perature for each image was calculated (Chuvieco, 1990; Raed, 2003) using 6 L and 6 H bands (10.4–12.5 µm) and ArcView 3.3 with Spatial Analyses module 2.0 (ESRI, 1996). The emissivity is corrected according to Chander and Markham (2003).
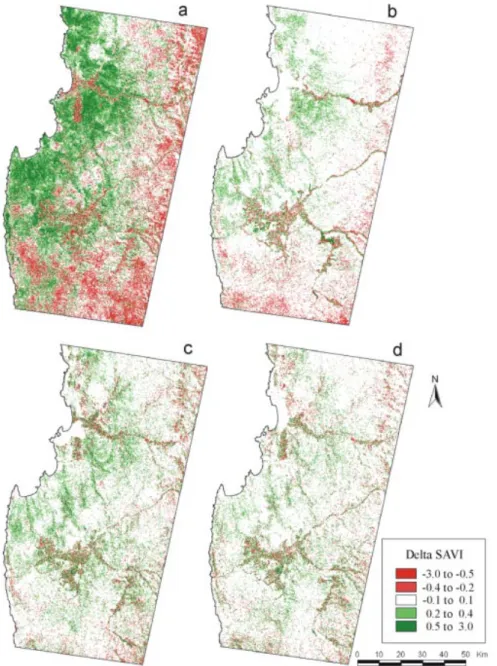
Figure 2: Satellite productivity difference (delta SAVI) between the rainy and dry year, a) September (2002-1999), b) November (2002-1999), c) January (2003-2000), d) March (2003-2000).
13
Fig. 2. Satellite productivity difference (delta SAVI) between the rainy and dry year, (a) September (2002–1999), (b) November (2002–1999), (c) January (2003–2000), (d) March (2003–2000).
3 Results
3.1 Satellite productivity estimation
The delta SAVI calculated from LANDSAT images suggests a change in net primary productivity between dry (1999) and rainy (2002) years at the regional level (Fig. 2). For every month a primary productivity gradient from the coast to the Andes is observed. The differences in productivity (positive or negative) between the dry year and the rainy year were greater in September (spring) and decreased after Novem-ber. During spring season, as expected, plant productivity in lowland areas increased from La Ni˜na to El Ni˜no condi-tions (Fig. 2a, b). However, unexpected change occurred in midland areas where plant productivity decreased.
3.2 The productivity gradient related with elevation To calculate a productivity gradient related to elevation, only the dryland areas (shrub and grassland) areas were consid-ered to reduce the artifact that could be due to irrigated and cultivated land. There was a strong inverse correlation be-tween delta SAVI and elevation during the spring (September and November), with a correlation coefficient of r2=−0.95, y −0.99 (Fig. 3). Positive productivity at low elevation and negative productivity at high elevation are illustrated. This relationship is decreased during January (r2=−0.88) and in-creased during March (r2=0.39) (Fig. 3). In others terms, at high altitude (near 2500 m a.s.l.), the primary productivity of the rainy year was less than that of the dry year, during the spring.
276 F. A. Squeo et al.: ENSO effects on primary productivity in Southern Atacama desert
Figure 3: Relation delta SAVI-Elevation between September (2002-1999) and March (2003-2000).
14
Fig. 3. Relation delta SAVI-Elevation between September (2002– 1999) and March (2003–2000).
3.3 The temperature gradient related with elevation The absolute surface temperature for each elevation range obtained from LANDSAT images was used to compare the temperature gradient with elevation between months (Fig. 4). The use of LANDSAT surface temperatures is an unique solution to calculating temperature in the study area. Existing meteorological stations that measure temper-ature are concentrated in agricultural areas, out of dryland areas. Temperatures were ±2◦C of average in low and
mid-elevations in all cases, with maximum temperatures occur-ring between 1000 and 2000 m a.s.l. A similar trend is ob-served in the meteorological data available along the Elqui valley (A. M. Cordova, personal communication). At high el-evations, surface temperatures decreased approximately 4◦C from 1500–2000 m a.s.l. to 2500–3000 m a.s.l. in most cases. The exceptions were the spring months in the rainy year of 2002, with a change close to −7◦C, suggesting lower tem-peratures at high elevation during the growth season of 2002 (rainy) compared to the growth season of 1999 (dry). There are no meteorological data available over 2000 m a.s.l. in the study area during this time to confirm the trend.
Several bio-morphological or functional traits that permit the natural vegetation in this semi-arid zone to resist low wa-ter availability (e.g., root system, hydraulic lift, phenological stages) have been studied (Olivares and Squeo, 1999; Squeo et al., 1999; Torres et al., 2002; Le´on and Squeo, 2004), but very few works link these functional traits to air temperature during the favored growth period (Squeo et al., 1996; Rada et al., 1999).
4 Conclusions
Comparing data on rainfall, SAVI and surface temperature, we conclude that the limiting factors to vegetation growth are different, based on elevation. Two extremes cases – a La Ni˜na event in 1999 and an El Ni˜no event in 2002 – show that
Figure 4: Adjusted absolute surface temperature (relative temperature) versus elevation for each studied month (between September and March). Each curve was adjusted to the mean temperature of each month (i.e., relative temperature= absolute surface temperature – mean temperature).
15
Fig. 4. Adjusted absolute surface temperature (relative temperature) versus elevation for each studied month (between September and March). Each curve was adjusted to the mean temperature of each month (i.e., relative temperature= absolute surface temperature – mean temperature).
the increase in water availability during 2002 is the main fac-tor that explains the increase in primary productivity at low elevation. However, the lower temperatures at high elevation (over 2500 m a.s.l.), associated with high water availability this same year, reduce and delay the net primary productivity in these areas, compared to productivity in a dry year (1999). Despite the functional traits characteristic of shrubland and grassland vegetation that allow these plants to deal with low water availability, they are sensitive to temperature ef-fects. Therefore, we should ask if other climatic factors con-trolled by ENSO events could have a significant effect on plant growth.
Acknowledgements. This work was supported by FONDECYT 1030428 and 1030225 funds and the “Compa˜n´ıa Minera del Pac´ıfico”. F. A. Squeo and J. R. Guti´errez thank the support by the BBVA (Spain) Foundation Prize in Research and Conservation Biology.
Edited by: P. Fabian and J. L. Santos Reviewed by: J. Bendix and M. Richter
References
Allan, R., Lindesay, J., and Parker, D. (Eds.): El Ni˜no Southern Oscillation and Climatic Variability, Australia: CSIRO, 1996. Cai, W., McPhaden, M. J., and Collier, M. A.: Multidecadal
fluc-tuations in the relationship between equatorial Pacific heat con-tent anomalies and ENSO amplitude, Geophys. Res. Lett., 31, L01201, doi:10.1029/2003GL018714, 2004.
CONAF: Catastro del Uso del Suelo y Vegetaci´on: IV Regi´on de Coquimbo, CONAF – Gobierno Regional de Coquimbo, Santi-ago, 32 pp, 2004.
Chander, G. and Markham, B. L.: Revised Landsat 5 TM radiomet-ric calibration procedures and post-calibration dynamic ranges, IEEE Transact. Geosci., 41, 2674–2677, 2003.
improved, Photogramm. Eng. Remote Sens,, 62, 1025–1036, 1996.
Chuvieco, E.: Fundamentos de Teledetecci´on Espacial, Ediciones Rialp SA, Madrid, 453 pp., 1990.
Dillon, M. O, Rundel, P. W., and Palma, B.: Flora and Vegetation of Pan de Az´ucar National Park in the Atacama Desert of Northern Chile, Gayana Bot´anica, 53, 295–315, 1996.
ESRI: Arcview Spatial Analsysis, Esri Press, Redland, 145 pp., 1996.
ENVI: Exploring ENVI Training Course Manual, Research Sys-tems, Inc., Boulder, 260 pp., 2002.
Holmgren, M., Stapp P., Dickman, C. R., Gracia, C., Graham, S., Guti´errez, J. R., Hice, C., Jaksic, F., Kelt, D. A., Letnic, M., Lima, M., L´opez, B. C., Meserve, P. L., Milstead, W. B., Polis, G. A., Previtali, M. A., Richter, M., Sabat´e, S., and Squeo, F. A.: A synthesis of ENSO effects on drylands in Australia, North America and South America, Adv. Geosci., 6, 69–72, 2006 Huete, A. R.: Extension of soil spectra to the satellite:
atmo-sphere, geometric, and sensors considerations, in: SPECTEL: Propiedades Espectrales y Teledetecci´on de los Suelos y Rocas del Visible al inflarrojo Medio: 163–194, SPECTEL, La Serena, Chile, 1985.
Huete, A. R.: A soil-adjusted vegetation index (SAVI), Remote Sensing of Environment, 25, 295–309, 1988.
Le´on, M. and Squeo, F. A.: Levantamiento hidr´aulico: la ra´ız del asunto, in: Fisiolog´ıa Ecol´ogica en Plantas: Mecanismos y Re-spuestas a Estr´es en los Ecosistemas, edited by: Cabrera, H. M., Ediciones Pontificia Universidad Cat´olica de Valpara´ıso, Val-para´ıso, Chile, 99–109, 2004.
Montecinos, A. and Aceituno, P.: Seasonality of the ENSO-Related Rainfall Variability in Central Chile and Associated Circulation Anomalies, J. Climate, 16, 281–296, 2003.
Olivares, S. and Squeo, F. A.: Patrones fenol´ogicos en especies ar-bustivas del desierto costero del norte-centro de Chile, Revista Chilena de Historia Natural, 72, 353–370, 1999.
Rada, F., Squeo, F. A., Az´ocar, A., and Cabrera, H. M.: Water and carbon relations in the genus Adesmia DC. (Papilionaceae) at dif-ferent altitudes in the high north-central Chilean Andes, Revista Chilena de Historia Natural, 72, 201–211, 1999.
Raed, M. A.: Fundamentos f´ısicos de los sensores remotos, in: Sen-sores Remotos Aplicados al Estudio de los Recursos Naturales, edited by: Navone, S. M., Ed. Facultad de Agonom´ıa, Universi-dad de Buenos aires, Buenos Aires, 9–39, 2003.
Springer, Berlin, 366 pp., 1999.
Rosenthal, Y. and Broccoli, A. J.: In search of Paleo-ENSO, Sci-ence, 304, 219–221, 2004.
Squeo, F. A., Rada, F., Garc´ıa, C. E., Ponce, M. E., Rojas, A. L., and Az´ocar, A.: Cold resistance mechanisms in high desert Andean plants, Oecologia, 105, 552–555, 1996.
Squeo, F. A., Olivares, N., Olivares, S., Pollastri, A., Aguirre, E., Aravena, R., Jorquera, C. B., and Ehleringer, J. R.: Grupos fun-cionales en arbustos des´erticos definidos en base a las fuentes de agua utilizadas, Gayana Bot´anica, 56, 1–15, 1999.
Squeo, F. A., Arancio, G., and Guti´errez, J. R. (Eds.): Libro Rojo de la Flora Nativa y de los Sitios Prioritarios para su conservaci´on: Regi´on de Coquimbo, Ediciones Universidad de La Serena, La Serena, 372 pp., 2001.
Squeo, F. A., Guti´errez, J. R., and Hern´andez, I. R. (Eds.): Histo-ria Natural del Parque Nacional Bosque Fray Jorge, Ediciones Universidad de La Serena, La Serena, 319 pp., 2004.
Squeo, F. A., Aravena, R., Aguirre, E., Pollastri, A., Jorquera, C. B., and Ehleringer, J. R.: Groundwater dynamics in a coastal aquifer in North-central Chile: Implications for groundwater recharge in an arid ecosystem, Journal of Arid Environments, in press, 2006. Torres, R., Squeo, F. A., Jorquera, C. B., Aguirre, E., and Ehleringer, J. R.: Evaluaci´on de la capacidad estacional de uti-lizar eventos de precipitaci´on en tres especies de arbustos nativos con distintos sistemas radiculares, Revista Chilena de Historia Natural, 75, 737–749, 2002.
Trenberth, K.E.: El Ni˜no Definition, Exchanges, Newsletter of the Climate Variability and Predictability Programme (CLIVAR), 1, 6-8, 1996.
Trenberth, K. E.: The Definition of El Ni˜no, Bull. Amer. Meteorol. Soc., 78, 2771–2777, 1997.
Vidiella, P. E., Armesto, J. J., and Guti´errez, J. R.: Vegetation changes and sequential flowering after rain in the southern At-acama desert, Journal of Arid Environments, 43, 449–458, 1999. Wolter, K.: The Southern Oscillation in surface circulation and climate over the tropical Atlantic, Eastern Pacific, and Indian Oceans as captured by cluster analysis, J. Climate Appl. Meteor., 26, 540–558, 1987.
Wolter, K. and Timlin, M. S.: Measuring the strength of ENSO – how does 1997/98 rank?, Weather, 53, 315–324, 1998.