HAL Id: hal-02409422
https://hal.archives-ouvertes.fr/hal-02409422
Submitted on 13 Dec 2019
HAL is a multi-disciplinary open access archive for the deposit and dissemination of sci-entific research documents, whether they are pub-lished or not. The documents may come from teaching and research institutions in France or abroad, or from public or private research centers.
L’archive ouverte pluridisciplinaire HAL, est destinée au dépôt et à la diffusion de documents scientifiques de niveau recherche, publiés ou non, émanant des établissements d’enseignement et de recherche français ou étrangers, des laboratoires publics ou privés.
Formation of the Ce-Nd mantle array: crustal extraction
vs. recycling by subduction
Claudine Israel, M. Boyet, R. Doucelance, P. Bonnand, P. Frossard, D.
Auclair, A. Bouvier
To cite this version:
Claudine Israel, M. Boyet, R. Doucelance, P. Bonnand, P. Frossard, et al.. Formation of the Ce-Nd mantle array: crustal extraction vs. recycling by subduction. Earth and Planetary Science Letters, Elsevier, 2020, 530, pp.115941. �10.1016/j.epsl.2019.115941�. �hal-02409422�
Formation of the Ce-Nd mantle array: crustal extraction vs. recycling by
1
subduction
2
3
4
C. Israela,*, M. Boyeta, R. Doucelancea, P. Bonnanda, P. Frossarda, D. Auclaira, A. Bouvierb,c
5
6
a Université Clermont Auvergne, CNRS, IRD, OPGC, Laboratoire Magmas et Volcans, F-63000
7
Clermont-Ferrand, France.
8
bDepartment of Earth Sciences, University of Western Ontario, Canada.
9
c Bayerisches Geoinstitut, Universität Bayreuth, Germany.
10
11
*Corresponding author.
12
E-mail address: [email protected] (Claudine Israel).
13
14
ABSTRACT
15
We present new measurements of 138Ce/142Ce and 143Nd/144Nd isotopic ratios in terrestrial and
extra-16
terrestrial samples. The mean value obtained from nine chondrites defines the 138Ce/142Ce ratio of the
17
chondritic uniform reservoir (CHUR) as 0.02256577 ± 66 (2sd). MORBs and OIBs define the mantle
18
array in the εNd vs. εCe diagram to be εNd = -7.3 (± 0.5) × εCe + 0.4 (± 0.3). From MORB
19
measurements, we derive the isotopic composition of the depleted MORB mantle (DMM) to be εCe =
-20
1.1 ± 0.6 (2sd). Both CHUR and a modelled early-depleted mantle reservoir plot on the mantle array.
21
Thus, the precise determination of the mantle array does not further constrain the La/Ce and Sm/Nd
22
ratios of the bulk silicate Earth (BSE; i.e., primitive mantle). The composition of 1.8 Ga upper
23
continental crust obtained from aeolian sediments is εCe = 1.8 ± 0.3 (2sd; εNd = -11.2), and that of its
24
2.2 Ga equivalent is εCe = 2.3 ± 0.3 (2sd; εNd = -17). Binary mixing models between depleted (DMM)
25
and enriched (upper crust or mafic crust composition) components do not reproduce the linear Ce-Nd
26
mantle array but plots close to the island arc basalt data. When the bulk Ce isotopic composition of the
27
continental crust is calculated from the range of accepted Nd isotope values and a mass-balance budget
28
of the BSE, the mixing curves are closer to the mantle array. However the calculated Ce isotopic
29
composition for the bulk crust is always less radiogenic than measurements. Adjusting the Ce-Nd
30
isotopic composition or the Ce/Nd ratio of the end-members to fully linearise the mixing curve leads to
31
unrealistic values never measured in terrestrial samples. We propose a recycling model to reconstruct
32
the mantle array with the participation of both oceanic crust and sediments in the mantle through time.
33
Cerium is a redox sensitive element, making the La-Ce and Sm-Nd systematics an ideal combination to
34
investigate sediment recycling through time. In this recycling model, the most extreme EM-like
35
signatures require the involvement of oceanic sediments that formed under reduced conditions before
36
the Great Oxygenation Event at 2.4 Ga, and which are devoid of Ce elemental anomalies.
37
38
Keywords: 138Ce/142Ce; rare earth elements; chondritic bulk silicate Earth; silicate reservoirs; mantle
39
array; ocean island basalts.
40
41
42
1. Introduction
43
44
Long-lived isotope systematics are remarkable tracers of the long-term evolution of the different
45
terrestrial reservoirs. Radiometric systems based on refractory lithophile elements are the most likely to
46
provide robust information on the bulk silicate Earth (BSE) because they were not lost during Earth’s
47
accretion or segregated into the core during its differentiation. Indeed, rare earth elements (REEs) have
48
high condensation temperatures and remain strictly lithophile at the conditions of Earth’s core formation
49
(Bouhifd et al., 2015). The REE concentrations of the primitive mantle (PM) are assumed to be
50
equivalent to those of the BSE, and their ratios should be chondritic if chondrites are the Earth’s main
51
building blocks. Boyet and Carlson (2005) identified a systematic offset between the 142Nd/144Nd ratios
52
of modern terrestrial rocks and chondrites resulting in an active debate on the refractory lithophile
53
element composition of the PM (see Caro et al., 2008; Jackson and Jellinek, 2013; O’Neill and Palme,
54
2008). 142Nd is a radiogenic isotope partly produced by the decay of 146Sm (T
1/2=103 Ma). Variations in
55
the 142Nd abundances exist among Solar System materials and they reflect isotopic heterogeneities
56
within the protoplanetary disk (Bouvier and Boyet, 2016; Burkhardt et al., 2016). Determining terrestrial
57
variations relative to chondrites thus requires precise knowledge of the nature of Earth’s building blocks.
58
Isotopic similarities between terrestrial samples and enstatite chondrites (ECs) suggest this group of
59
chondrites to be the main terrestrial component (Dauphas, 2017; Javoy, 1995). The mean EC 142Nd/144Nd
60
value is nevertheless lower than that of the BSE without distinguishable variations in their
non-61
radiogenic Nd isotopic compositions from Earth (Burkhardt et al., 2016; Boyet et al., 2018). Variations
62
in 142Nd/144Nd values between different EC subgroups show further that the EL3 subgroup matches the
63
terrestrial value (Boyet et al., 2018). These results remove the need of an early fractionation of the
64
Sm/Nd ratio of the Earth if the Earth was purely made of EL3 materials. The EL3 chondrites are
65
nevertheless problematic in regards to the elemental composition (e.g. Mg/Si) of the bulk Earth.
66
This study presents measurements of two long-lived isotopic systems in which both the parent and
67
daughter elements are REEs. 138La decays into 138Ce by beta emission (t
1/2,β = 295.5 Gyr: Tanimizu,
68
2000) and into 138Ba by electron capture, whereas 147Sm decays into 143Nd by alpha emission (t
1/2,α = 106
69
Gyr: Begemann et al., 2001). Variations of 138Ce/142Ce ratios are expected to be small due to the long
70
half-life and low abundance (0.09% of total La) of 138La. The latest generation of thermal ionisation
71
mass spectrometers (TIMS) can achieve long-term analytical errors below 30 ppm on 138Ce/142Ce
72
(Bonnand et al., 2019), allowing characterisation of Ce isotopic variations in terrestrial and
73
extraterrestrial materials. Here we present analyses of 11 chondrites (ordinary, enstatite, and
74
carbonaceous) that we use to estimate the Ce isotopic composition of the chondritic uniform reservoir
75
(CHUR). We also redefine the Ce-Nd mantle array based on previous and new measurements including
76
seven mid-ocean ridge basalts (MORBs) and 51 ocean island basalts (OIBs). Lastly, we report the first
77
Ce-Nd isotopic compositions of loess samples as a proxy for the upper continental crust (UCC).
78
79
Dickin (1987) first used the Ce-Nd isotopic correlation defined by OIBs to estimate the Ce isotopic
80
composition of the BSE. His regression intercepts the CHUR Nd isotopic composition at a BSE Ce
81
isotopic composition that is 60 ppm less radiogenic than the CHUR value defined by Shimizu et al.
82
(1984). However, new results from chondrites and mantle-derived samples lead to a different
83
observation. The mantle array passes directly through the CHUR composition in the Ce-Nd isotopic
84
diagram (Willig and Stracke, 2019). Our new results first confirm this trend. Moreover we show that a
85
modelled reservoir depleted in incompatible elements (and characterised by a depleted REE pattern; see
86
early-depleted reservoir in Boyet and Carlson, 2005) that would be formed early in the Solar System’s
87
history also plots on the mantle array.
88
89
The mantle array must reflect the formation of the major silicate reservoirs and their interactions during
90
Earth’s history. Important questions have been addressed by coupling Lu-Hf and Sm-Nd isotope
91
systematics; for example, arc lavas do not follow the Hf-Nd mantle array, which reflects the elevated
92
176Hf/177Hf signature measured in most oceanic sediments (Carpentier et al., 2009). Also, the presence
93
of pelagic sediments in the source of the Hawaiian hotspot was first identified from Hf-Nd isotopic
94
measurements (Blichert-Toft et al., 1999). Cerium is a redox sensitive element, making the La-Ce and
95
Sm-Nd systematics an ideal combination to investigate sediment recycling through time. Indeed, most
96
documented modern forearc sediments are depleted in Ce relative to neighbouring elements (Plank,
97
2014). Before the Great Oxygenation Event (GOE), however, all REEs should have behaved similarly
98
and no Ce fractionation is expected to have occurred during that time. Coupling Ce and Nd isotopic
99
measurements will thus provide additional constraints on the nature of sediments recycled into the deep
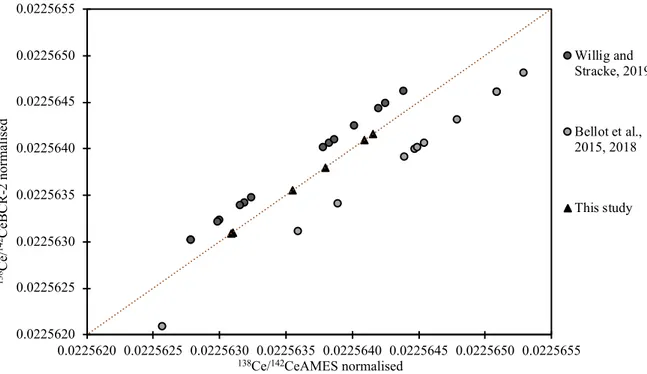
100
mantle and sampled via hotspot volcanism. Chauvel et al. (2008) explained the Hf-Nd mantle array by
101
the recycling of oceanic crust and sediments into the mantle. Here, we present similar models in Ce-Nd
102
isotope diagrams for the first time.
103
104
105
2. Sample selection
106
107
We measured the Ce and Nd isotopic compositions of four ordinary chondrites, six enstatite chondrites,
108
one carbonaceous chondrite, seven MORBs, 51 OIBs, one intraplate continental volcanism occurrence
109
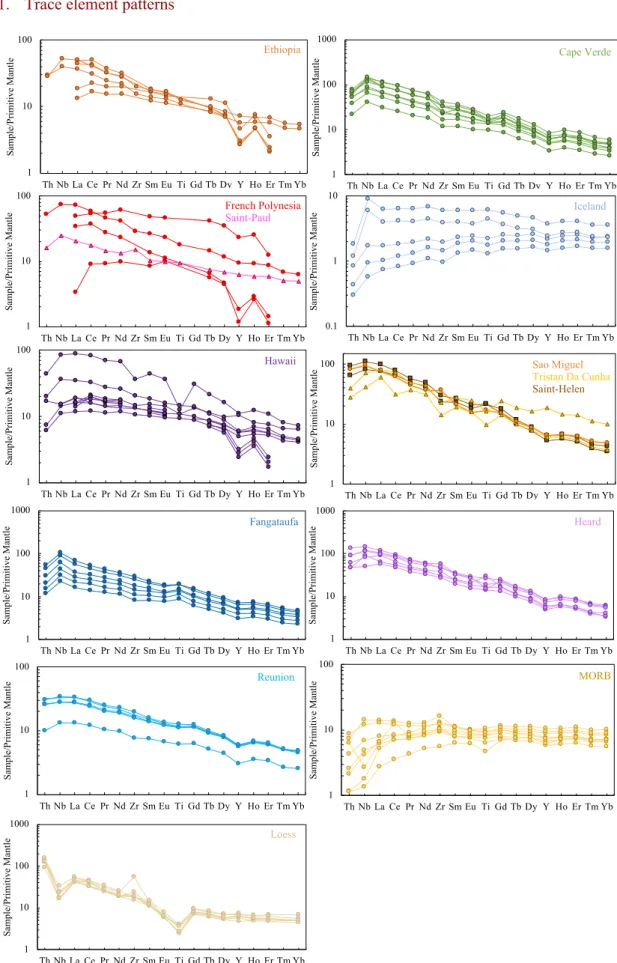
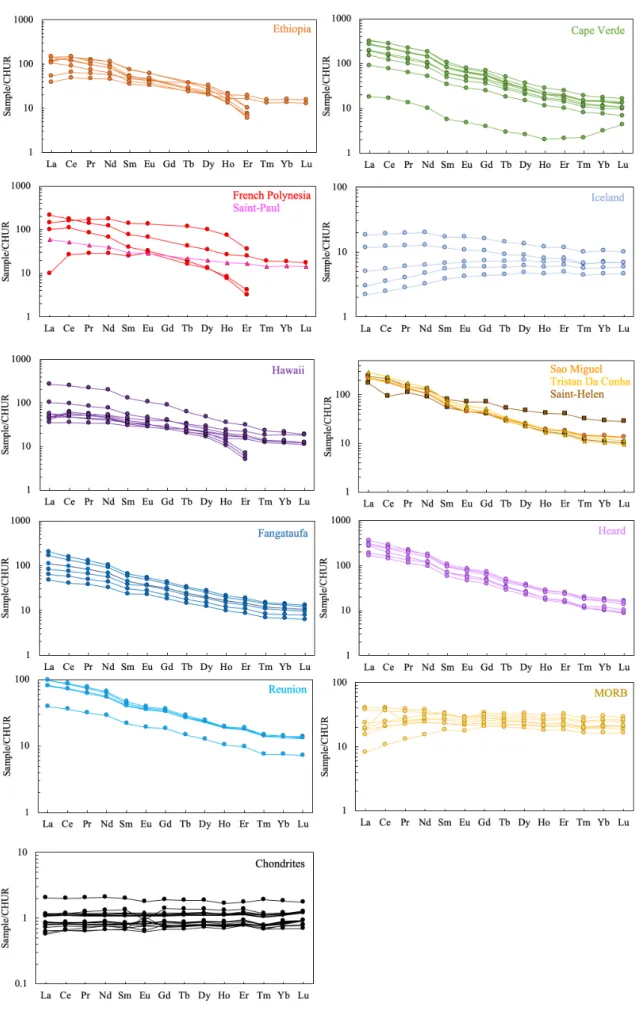
(Ethiopia), and six loess samples. To include all mantle end-members, we selected rocks with extreme
110
Nd-Sr-Pb-He compositions. OIB samples were selected from 13 locations covering the Atlantic
111
(Iceland, São Miguel (Azores archipelago), Cape Verde, Saint Helena, Tristan Da Cunha), Pacific
112
(Hawaii, MacDonald seamount, Rurutu and Tubuai Islands (Austral archipelago), Fangataufa (Tuamotu
113
archipelago), Tahaa Island (Society archipelago)), and Indian Oceans (Heard, Kerguelen, Reunion and
114
Saint-Paul Island (French Southern and Antarctic Lands)). MORB samples are unaltered glasses
115
collected on the Pacific ridge (Bellot et al., 2015) and the Southwest Indian Ridge. The Pacific MORBs
116
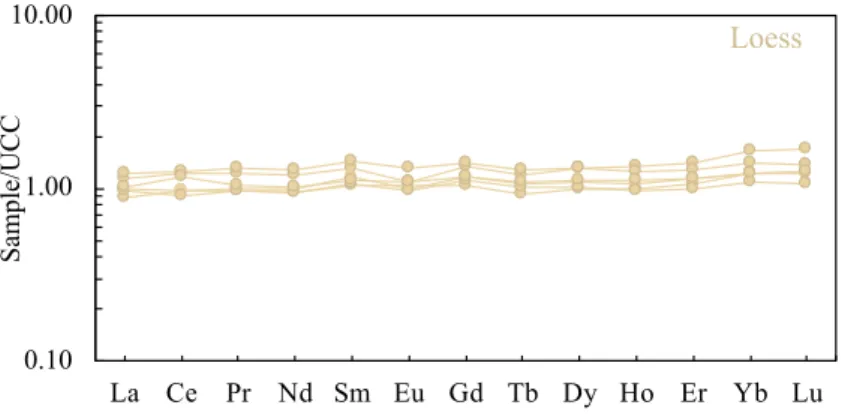
have similar REE patterns and do not show the Dupal anomaly (Sr and Pb isotopic anomalies in MORBs
117
and OIBs erupted around 30° S). We used loesses from western Europe (wind-transported periglacial
118
deposits), China and Tajikistan (sediments originating in northwestern Mongolia and the Karakum
119
(Turkmenistan) and Kyzylkum deserts (Kazakhstan and Uzbekistan), respectively), and the Sahara
120
Desert (dusts blown to Southern France; Chauvel et al., 2014 and references therein; Supplementary
121
data 1, Figs S1-4).122
123
124
3. Analytical procedures
125
3.1.
Dissolution and chromatography protocols
126
127
All samples were entirely processed at the Laboratoire Magmas et Volcans (LMV, Clermont-Ferrand,
128
France), except three chondrites (NWA 8007, NWA 10854, and Adrar Bous) that were dissolved at the
129
University of Western Ontario (UWO). Mantle-derived and loess samples were dissolved using the
130
following protocol. We used 50 to 300 mg of sample depending on the REE concentration and the
131
quantity of powder available. Powders were digested in a 3:1 mixture of HF (65%) and HNO3 (48%)
132
that was maintained at 75 °C on a hot plate for 48 h. Once dried, the samples were dissolved a second
133
time in 6 M HCl. The dissolution protocol was slightly different for chondrites. Oudiyat Sbaa, Yilmia,
134
Pillistfer, Agen, Sahara 97158, and Saint-Séverin were dissolved in a 10:1 mixture of HF (65%) and
135
HNO3 (48%) in PFA-Savillex beakers placed on a hot plate at 110 °C for seven days. Fluorides were
136
broken down in a second step using concentrated HClO4. Allende, Sahara 97072, Adrar Bous, NWA
8007, and NWA 10854 were dissolved in Parr bombs using the same acid mixtures (48 hours at 180 °C
138
in HF-HNO3, or seven days at 150 °C, followed by HClO4 treatment). Once dried, all chondrite samples
139
were dissolved in 6 M HCl for two to five days on a hot plate at 110 °C.
140
141
All sample solutions were then separated into two aliquots for trace element and isotopic dilution (5–
142
10%) and Ce-Nd isotopic analyses (90–95%). Ce and Nd were chemically separated following the
143
procedure reported in detail by Bonnand et al., 2019; modified from Tazoe et al., 2007 and Bellot et al.,
144
2015 and summarised here. REEs (including Ba) were first separated from the matrix using
AG50W-145
X8 resin. An additional step using AG1-X8 resin (200–400 mesh) was performed on the meteorites to
146
remove Fe. Then, Ce was separated from the trivalent REEs using an oxidation technique (NaBrO3) on
147
Ln-Spec resin, and purified in a final step using AG50W-X8 resin to remove any residual Ba. The
148
remaining REE fraction was processed using Ln-Spec resin (25–50 mesh) and Nd was collected in 0.25
149
M HCl. Total procedural blanks for Ce and Nd were 0.4 ± 1.7 ng (2sd, n = 12) and 0.02 ± 0.05 ng (2sd,
150
n = 7), respectively, and were always negligible relative to the quantities collected from the samples.
151
152
3.2.
Trace element concentrations and Ce and Nd isotopic measurements
153
154
We determined trace element abundances for all samples except NWA 8007, NWA 10854, and Adrar
155
Bous by inductively coupled plasma mass spectrometry (ICP-MS) using the Agilent 7500 quadrupole
156
instrument in normal mode (no collision cell) at LMV. These 3 meteorites were analysed using a Thermo
157
iCAP quadrupole ICP-MS in collision cell mode with He flux at UWO. Concentrations were calculated
158
using an external calibration (CMS reference material standard, Inorganic Ventures). We analysed
159
certified rock standard BHVO-2 (or BCR-2 at UWO) together with our samples to assess the accuracy
160
of our analytical protocol.
161
162
We performed Ce isotopic analyses in static mode with double Re filaments on a ThermoScientificTM
163
Triton Plus TIMS at LMV. Ce isotopes were measured as CeO+ oxides using the procedure described
164
in Bonnand et al. (2019). A typical run comprised 27 blocks with 20 cycles of 8 s integration time each,
165
and a baseline measurement (deflected ion beams) of 60 s. Matrix rotation of the amplifiers was not
166
active because the 1011, 1012, and 1013 Ω resistors were used simultaneously. All corrections (oxygen,
167
mass discrimination using 136Ce/142Ce = 0.01688, and tailing effect) were performed offline. All reported
168
uncertainties are 2 standard deviations. During the course of the study, the value of the tailing correction
169
was ΔεCe = 0.77 ± 0.18 (n = 151). Repeated measurements of our CeLMV synthetic reference material
170
gave 138Ce/142Ce = 0.02257063 ± 54 (24 ppm; n = 31). 138Ce/142Ce ratios measured for rock reference
171
standards BCR-2 and BHVO-2 were equal to 0.02256684 ± 48 (21 ppm; n = 9) and 0.02256453 ± 99
172
(44 ppm; n = 7), respectively (see Supplementary data 2 for details on the total reproducibility of
173
measurements). The mean 134Ba16O signal was 0.000003 ± 0.000010 V (n = 139), and the maximum
174
reached 1 × 10⁻⁵ V, which has no significant effect on the 138Ce/142Ce and 136Ce/142Ce ratios. Ce isotopic
175
compositions of loess samples were measured on the same TIMS but using the two-line acquisition
176
method of 360 cycles (Bellot et al., 2015).
177
178
We performed Nd isotopic analyses in static mode with double Re filaments using a ThermoScientificTM
179
Triton TIMS at LMV. A typical run comprised 18 blocks of 10 cycles, allowing a full rotation of the
180
amplifier system. Mass discrimination was corrected using 146Nd/144Nd = 0.7219. Repeated
181
measurements of the JNdi-1 standard and the two rock reference standards BCR-2 and BHVO-2 gave
182
143Nd/144Nd = 0.512099 ± 4 (7 ppm; n = 16), 0.512623 ± 8 (17 ppm; n = 3) and 0.512973 ± 3 (6 ppm; n
183
= 3), respectively. The Sm contribution measured at mass 147 was negligible in all analyses.
184
185
186
4. Results
187
188
Measured Ce and Nd isotopic compositions are reported in Table 1 and 2, and details for individual runs
189
(number of cycles, mean intensity, tailing value) are given in Supplementary data 2.
190
4.1.
Chondrites
192
193
Chondrites define a small range of 138Ce/142Ce ratios between 0.02256522 and 0.02256633, excluding
194
the two EL6 samples (Yilmia and Pillistfer) that show lower values (0.02256251 and 0.02256272,
195
respectively). Enstatite, ordinary, and carbonaceous chondrites have indistinguishable average values
196
within errors (Fig. 1A). The two EL6 samples plot on the 4.568 Ga isochron in the 138Ce/142Ce vs. La/Ce
197
diagram (Fig. 1B) suggesting that their La/Ce ratios were modified early in the history of the Solar
198
System, in agreement with previous conclusions (Barrat et al., 2014; Boyet et al., 2018). Consequently,
199
we define the Ce isotopic composition of CHUR as the mean value of the other nine (i.e., unmodified)
200
chondrite samples: 138Ce/142Ce
CHUR = 0.02256577 ± 66 (29 ppm).
201
202
To compare our CHUR value with the most recent estimates of Bellot et al. (2015) and Willig and
203
Stracke (2019), we have normalised these previous data using a common reference material
204
(138Ce/142Ce
CeLMV/138Ce/142CeCeAMES = 0.02257053/0.02257426, Bonnand et al., 2019). The normalised
205
CHUR value of Willig and Stracke (2019) is thus 138Ce/142Ce = 0.02256644 ± 53 (using 136Ce/142Ce =
206
0.01688), consistent with our estimate within errors. In contrast, the normalised CHUR value of Bellot
207
et al. (2015) is significantly distinct from our value (Fig 1A). Combining the normalised data of Willig
208
and Stracke (2019) with our measurements to calculate a mean chondritic 138Ce/142Ce ratio increases the
209
uncertainty from 29 to 39 ppm because their chondrite measurements were systematically 30 ppm more
210
radiogenic than ours. This deviation exists also for MORB and OIB data and it is highlighted when data
211
are reported in a 143Nd/144Nd vs. 138Ce/142Ce isotope diagram. Thus, to compare these different datasets,
212
we henceforth strictly use the epsilon notation (Fig. 1B). In the future, to achieve better interlaboratory
213
reliability, chondrites should be measured under similar analytical conditions (see Supplementary Fig.
214
S5).
215
216
4.2.
Ce-Nd isotopic compositions of terrestrial samples
217
218
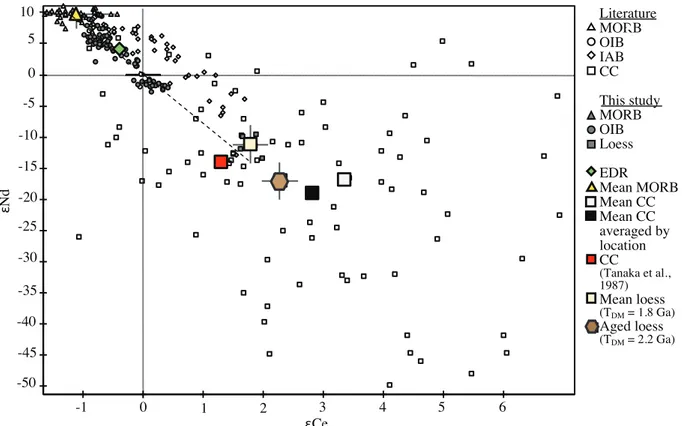
The Ce and Nd isotopic compositions of terrestrial samples measured in this study are reported in a eNd
219
vs. εCediagram (Fig. 2) and compared with recent MORB and OIB data from the literature. MORB
220
samples have the least radiogenic Ce ratios and the most radiogenic Nd ratios, with εCe and eNd values
221
ranging from –1.19 to –0.71 and from 8.85 to 10.42, respectively. Pacific MORBs have slightly lower
222
Ce isotopic ratios than Indian ones. OIB samples define larger compositional ranges with εCe and εNd
223
values ranging from –1.44 to 0.43 and from –2.49 to 10.42, respectively. Enriched mantle (EM1 and
224
EM2)-like OIBs (Heard, Gough, Kerguelen, Tristan Da Cunha, São Miguel, and Tahaa) have the highest
225
Ce isotopic ratios. Samples from Iceland and two samples from Hawaii plot in the MORB field. Other
226
OIBs, including those with HIMU affinity (Saint-Helena), have compositions intermediate between
227
Iceland samples and those with EM affinities, forming a continuum between these two end-members.
228
The seven samples from Ethiopia have subchondritic eCe values and plot along the OIB trend. The
229
entire range of MORB eCe values is relatively large (1 unit) compared to OIBs (1.5 units) considering
230
the dispersion of eNd values (3 units for MORBs and 12 units for OIBs).
231
232
Loess samples have εCe and eNd values ranging from 1.6 to 2.0 and from –13.52 to –9.73, respectively,
233
with average values of εCe = 1.8 ± 0.3 and εNd = –11.2 ± 3.0. Our samples represent a sub-sampling of
234
those analysed by Chauvel et al. (2014), who determined a mean εNd value of –10.3 ± 2.3, consistent
235
with our results.
236
237
5. Discussion
238
5.1.
Definition of the Ce-Nd mantle array
239
240
Dickin (1987) was the first to present coupled Ce and Nd isotopic measurements of OIB samples and
241
define the Ce-Nd mantle array. Recently, Willig and Stracke (2019) published new high-precision
242
measurements of MORBs and OIBs and refined the εCe-εNd correlation. We extended their results by
243
analysing 66 new mantle-derived samples. The regression line calculated from all samples presented in
244
Figure 2 (n = 134) gives the following equation for the mantle array: εNd = -7.3 (± 0.5) × εCe + 0.4 (±
245
0.3), using Isoplotâ and considering errors of 0.25 for eCe and 0.10 for eNd. In agreement with Willig
246
and Stracke (2019), the mantle array intercepts the chondritic composition. However, we will show in
247
the following section that a chondritic intercept for the mantle array does not prove that these
mantle-248
derived samples come from a source with a chondritic light REE (LREE) pattern.
249
250
5.2.
Chondritic vs. non-chondritic REE composition of the primitive mantle
251
252
A non-chondritic REE composition of the primitive mantle was initially proposed to explain the
253
radiogenic eNd values measured in Eoarchean samples (e.g., Chase and Patchett, 1988). High-precision
254
isotopic measurements of the short-lived 146Sm-142Nd systematics in both terrestrial samples and
255
chondrites have strongly revived the debate on the nature of the REE composition of the PM (Boyet and
256
Carlson, 2005). Most 142Nd/144Nd variations measured in the different chondrite groups are now
257
attributed to initial isotopic heterogeneities of nucleosynthetic origin within the solar nebula during
258
planetary accretion (Bouvier and Boyet, 2016; Burkhardt et al., 2016; Carlson et al., 2007). However,
259
in terms of non-radiogenic Nd isotope compositions, enstatite chondrites are the closest to the Earth and,
260
on average, are depleted in 142Nd by 10 ppm relative to terrestrial samples (Boyet et al., 2018; Dauphas,
261
2017) with the exception of the EL3 sub-group. Carbonaceous chondrites may have been involved
262
during the last stage of Earth’s accretion, and, because they are depleted in 142Nd by 32 ppm relative to
263
terrestrial samples, they may have further contributed to the difference between terrestrial and EC values
264
(Boyet et al., 2018). None of the current meteorite groups available for analysis and mixing models
265
satisfy the isotopic and elemental composition of the Earth, and call for unknown end-members or
266
fractionation processes. Thus, it is still possible that some of the observed difference between terrestrial
267
and chondritic 142Nd abundances was produced by the decay of 146Sm in a superchondritic Sm/Nd
268
reservoir.
269
270
To attempt to constrain the REE composition of the PM, we consider a 10 ppm increase in radiogenic
271
142Nd that corresponds to the difference between modern terrestrial samples and either EC values having
a terrestrial mean 142Nd/144Nd 10 ppm higher than that of the continental crust, or an Earth made with
273
90% of EL3 chondrites + 10% carbonaceous chondrites (Boyet et al., 2018). This excess 142Nd would
274
have been produced in a high-Sm/Nd reservoir. Assuming this reservoir formed 4.568 Ga, this
275
corresponds to a 3.6% increase of the BSE Sm/Nd ratio relative to the chondritic value. Modelled Sm/Nd
276
ratios in early-differentiated reservoirs have been discussed in a large number of publications (e.g. Boyet
277
and Carlson, 2005; Caro et al., 2008)and can goes up to 5% higher if this early-differentiated reservoir
278
formed 4.5 Ga. Here we use the terms “early depleted reservoir” (EDR) and “early enriched reservoir”
279
(EER) as defined by Boyet and Carlson (2005): the EDR has a chondrite-normalised REE pattern that
280
is depleted in LREEs relative to heavy REEs and thus a superchondritic Sm/Nd ratio, whereas the
281
complementary EER has a subchondritic Sm/Nd ratio. The EER may exist in the lower mantle (Boyet
282
and Carlson, 2005) or may correspond to embryonic crust lost by collisional erosion during Earth’s
283
accretion (O’Neill and Palme, 2008).
284
285
We calculate the REE composition of the EDR by the method developed by Jackson and Jellinek (2013),
286
which is based on three different isotopic systematics (146Sm-142Nd, 147Sm-143Nd, and 176Lu-176Hf) and
287
invariant elemental ratios (e.g., Sm/Hf). CHUR REE elemental ratios needed for this calculation were
288
obtained from a large and recent database of ordinary, enstatite, and carbonaceous chondrites (Barrat et
289
al., 2012, 2014; Boyet et al., 2018; Braukmüller et al., 2018; Dauphas and Pourmand, 2015; Pourmand
290
et al., 2012). We selected the least thermally metamorphosed fall samples (types 1–4, n = 42), and
291
outliers (Orgueil and Kelly) were removed. The mean La/Ce ratio thus calculated for CHUR is 0.387 ±
292
0.022 (n = 39), similar to the value we obtained from our smaller sample set (La/CeCHUR = 0.390 ±
293
0.022). The CHUR Sm/Nd ratio determined from the same database of chondrite samples is 0.324 ±
294
0.014, consistent with the value proposed by Bouvier et al. (2008). Lastly, we used the Lu/Hf ratio of
295
CHUR (0.236) calculated from the average 176Lu/177Hf value determined by Bouvier et al. (2008).
296
297
The calculated REE pattern for an EDR is presented in Figure 3. For a 3.6% increase of the Sm/Nd ratio
298
of the BSE, the modelled EDR has eCe = –0.4 and eNd = 4.1. This reservoir plots very close to the
299
mantle array in the eNd vs. εCediagram, and shows Ce-Nd isotopic compositions similar to those
300
measured in several OIBs (Fig. 4). A large-scale silicate differentiation event early in the Solar System’s
301
evolution does not produce any offset in the Ce-Nd isotopic composition of the EDR relative to the
302
mantle array. Thus, defining the Ce-Nd mantle array does not resolve the long-standing debate over the
303
chondritic vs. EDR-like REE composition of the PM.
304
305
5.3. Crustal extraction mass-balance calculations
306
307
Mantle melting and subsequent extraction of the crust has contributed to the depletion of the mantle in
308
incompatible elements. Crustal growth models are widely discussed and several authors have proposed
309
rapid continental growth early in Earth’s history despite the scarce geological record of the Earth’s first
310
billion years (Belousova et al., 2010; Dhuime et al., 2012). Geochemical signatures in mantle-derived
311
samples linked to this process are particularly difficult to decipher because surface material is
312
continuously reintegrated into the mantle via subduction. In this section, to investigate the production
313
of the various mantle reservoirs, we attempt to recreate the Ce-Nd mantle array via mass-balance mixing
314
calculations between the depleted MORB mantle (DMM) and continental crust (CC). We first simplify
315
our approach by assuming that the CC was extracted from the PM in a single differentiation step (i.e.,
316
DMM + CC = BSE). Since we have not resolved the chondritic vs. EDR-like composition of the PM,
317
we explore both bulk compositions and compare their modelled Ce-Nd mixing curves to the mantle
318
array. Distinct scenarios proposed that oceanic crust formation was the dominant process of mantle
319
depletion with continents formed later by reworking in subduction zones (e.g., Jones et al., 2019).
320
Furthermore, isotopic studies of rocks from the Nuvvuaggituq Supracrustal Belt and the neighbouring
321
Hudson Bay terrane show that the Archean felsic crust formed by reworking of Hadean mafic crust
322
(O’Neil et al., 2019; O’Neil and Carlson, 2017). From these observations, we choose to calculate the
323
Ce-Nd isotopic composition of such an enriched reservoir and compare it to the global dataset to evaluate
324
the effect of primitive mafic crustal extraction on the mantle.
325
326
5.3.1. End-members
327
Depleted MORB Mantle
The DMM end-member isotopic composition is commonly calculated from MORB samples. Our
329
measurements and literature data are plotted in the eNd vs. εCediagram (Fig. 2). The average of 48
330
MORB measurements gives εCeDMM = –1.1 ± 0.6 and εNdDMM = 9.7 ± 2.3. This mean Nd isotopic
331
composition is consistent with previously proposed values of 9.2 and 9.8 based on a more complete
332
dataset (Salters and Stracke, 2004, and Workman and Hart, 2005, respectively). Restricting the MORB
333
samples to those that do not show the Dupal anomaly (i.e., North Atlantic and Pacific MORBs) gives
334
an identical result (εCe = –1.2 ± 0.6, n = 33).
335
336
Continental Crust
337
The CC is a low-mass reservoir containing 20–70% of the PM’s incompatible element budget. The
338
difficulty in constraining the CC composition stems from its nature. With a mean age of 1.8–2.4 Ga
339
(Chauvel et al., 2014; Taylor and McLennan, 1995) and an average thickness of about 40 km, it is much
340
older and thicker than the present-day oceanic crust. The major- and trace-element compositions of the
341
upper, middle, and lower crust are based on numerous rock samples from which global compositions
342
were obtained (Rudnick and Gao, 2003, and references therein), though the isotopic composition of the
343
bulk CC is largely under-constrained; very few data are available for Ce, and εNd values generally vary
344
between –21 and –10. Based on loess measurements, Chauvel et al. (2014) proposed a model age of 1.8
345
Ga for the UCC and a εNd value of –10. On the other hand, Goldstein and Jacobsen (1988) considered
346
suspended materials in rivers (εNd = –11, TDM = 1.6 Ga) but corrected their mean value for the
347
preferential erosion of young terranes (εNd = –17 recalculated at 2.1 Ga). Similarly, Hawkesworth et al.
348
(2017) discussed the erosional bias based on the proportions of young and old source rocks and proposed
349
a bulk CC εNd value of –12. Other studies consider that the upper and bulk crusts have distinct isotope
350
signature; Allègre and Lewin (1989) calculated a εNd value of –21 from DMM-bulk CC mass-balance
351
equations, whereas Jacobsen and Wasserburg (1980) obtained a slightly higher value with a similar
352
approach (εNd = –14).
353
354
To date, CC rocks analysed for Ce and Nd isotopes are mainly ~2 Ga granites and gneisses (see
355
Supplementary Fig. S6 for details). Combining all published Ce-Nd measurements gives average values
356
of eCe = 2.8 and eNd = –19 (Fig.4). This is slightly different from the sole published estimate for the
357
CC (εCe = 1.3 and εNd = –14; Tanaka et al., 1987), which was calculated by regression from five crustal
358
rock measurements (eCe = –0.112 × eNd) anchored to the mean eNd value of aeolian sediments and
359
particulates in rivers (eNd = –11.4; Goldstein et al., 1984). Our loess average is εCe = 1.8 and εNd = –
360
11.2, relatively close to Tanaka et al.'s (1987) value.
361
362
Mafic crust
363
Results obtained on the 146Sm-142Nd short-lived systematics suggest that the oldest mafic crust preserved
364
at the Earth’s surface is the
~
4.3 Ga Nuvvuagittuq Supracrustal Belt in northern Quebec (O’Neil et al.,365
2008). Even if this age is debated, the neighbouring Hudson Bay terrane shows that the Archean felsic
366
crust formed by reworking of an Hadean mafic crust (O’Neil et al., 2019; O’Neil and Carlson, 2017).
367
We chose sample PC-162 (La/Ce = 0.49 and Sm/Nd = 0.27) as representative of the Archean mafic crust
368
to model its Ce and Nd isotopic compositions. This and other samples from the enriched low-Ti group
369
(O’Neil et al., 2011) are enriched in LREEs by 10 to 80 times the chondritic reference, whereas rocks
370
from the depleted low-Ti and high-Ti units show lower LREE enrichments (<20 times). Furthermore,
371
PC-162 is one of the most REE-depleted samples among those of the enriched low-Ti group that do not
372
show any evidence of metamorphic disturbance (O’Neil et al., 2012), and thus its REE contents
373
correspond to a reasonable crustal extraction rate: that is, more enriched compositions reflect increased
374
depletion of the mantle during extraction of the crust. The Ce-Nd isotopic compositions of the modelled
375
mafic end-member are reported in Figure 4; they are identical (eCe = 3.8 and eNd = –17.3) for a crust
376
formed at 4.3 Ga, irrespective of the PM considered (CHUR or EDR). The EER calculated by Carlson
377
and Boyet (2008) has similar La/Ce and Sm/Nd ratios of 0.47 and 0.28, respectively, producing
present-378
day isotopic compositions of eCe = 3 and eNd = –13.5 if this reservoir formed 4.3 Ga. Both these models
379
plot to the right of the mantle array (Fig. 4).
380
381
5.3.2. Model parameters and mixing hyperbolas
382
Our mass-balance models consider DMM-CC complementarity for chondritic and early-depleted PM
384
compositions. We aim to determine the εCe value of the CC using four-successive calculation steps
385
(Supplementary material). 1) We calculate the mass fraction of Nd in the CC relative to the total amount
386
in the crust and DMM (the sialic index; e.g., Allègre and Lewin, 1989) based on the DMM, CHUR/EDR
387
(Table 3), and CC εNd values. As the range of published CC isotopic values is large, we do not set a
388
precise εNd value in the mass-balance model, but consider all possibilities between εNd = –10 and –21.
389
2) We calculate the mass fraction of CC using the Nd contents of the BSE (as determined in section 5.2
390
with REE patterns anchored to a Lu content of 68 ppb; McDonough and Sun, 1995) and CC (Rudnick
391
and Gao, 2003). The Ce/Nd ratio is set to 1.28 for a chondritic BSE and to 1.22 for the EDR model
392
(Table 3). Importantly, the Lu value chosen to anchor the REE pattern of the BSE has no consequence
393
on the final εCe value. 3) The Ce sialic index is calculated using the Ce contents of the BSE (see step 2)
394
and CC (Rudnick and Gao, 2003). 4) The εCe value of the CC is calculated from the Ce sialic index and
395
the εCe values of the DMM and CHUR/EDR (Table 3): εCeCC varies from 0.2 to 1 in the chondritic case
396
and from 0.4 to 1.2 in the EDR case. All CCs are represented as orange or green lines at the lower end
397
of the mixing curves in Figure 4 (chondritic or EDR model, respectively) and all calculated DMM-CC
398
mixing hyperbolas are plotted in the form of a coloured field. Their curvature is a function of the Ce/Nd
399
ratios of both end-members.
400
401
In the upper left of the εNd vs. εCe diagram, the DMM-CC mixing hyperbolas overlap and pass through
402
both the CHUR and EDR compositions. However, they do not fully overlap the data points defining the
403
mantle array. The Ce-Nd isotopic compositions calculated for the CC are always less radiogenic in
404
cerium than the mean values estimated from measurements, which might question the relevance of the
405
published data used to estimate the isotopic composition of the bulk CC. Most of the samples are upper
406
crust (e.g., loess) samples. If the observed difference reflects heterogeneities within the crustal reservoir,
407
the lower and middle crust should be characterised by negative eCe values to adjust the mass balance
408
budget within the continental crust (Willig and Stracke, 2019). However, Vervoort et al. (2000)
409
suggested that lower crustal xenoliths have eHf-eNd values close to the mantle array.
410
The mass fraction of depleted mantle relative to the whole mantle can be calculated in the case of the
412
mass balance calculations for the entire range of εNdCC considered. It varies from 14 to 33% and from
413
28 to 64% (±20%) for the CHUR and EDR bulk compositions, respectively (Fig. 5). As mentioned in
414
section 5.3.1, a more depleted initial composition implies that a larger volume of the mantle was depleted
415
by crustal extraction (Boyet and Carlson, 2006). For comparison, Allègre and Lewin (1989) calculated
416
the mass fraction of depleted mantle to be comprised between 32 and 40% using a chondritic BSE.
417
418
The mixing curve joining the DMM and a 4.3 Ga early mafic crust is also reported in Figure 4. The
419
Ce/Nd ratio of this mafic crust is 1.9, only slightly different from the mean value of 2.15 determined for
420
the CC by Rudnick and Gao (2003). Thus, the DMM-mafic crust mixing hyperbola has a curvature close
421
to that of the DMM-CC mixing curve. Again, such a mixing scenario seems unlikely to reproduce the
422
mantle array.
423
424
5.3.3. What parameters can bring the DMM-CC mixing model closer to the mantle array?
425
426
To superimpose the DMM-CC mixing curve on the mantle array, Willig and Stracke (2019) proposed
427
using a more depleted isotopic composition for the DMM end-member (see their Figure 5). However,
428
for a likely CC Nd isotopic composition, such a DMM-CC hyperbola requires DMM Ce-Nd isotopic
429
ratios very different from those measured in MORB samples. For example, to fully reproduce the mantle
430
array, the εCe and εNd values of the DMM should be approximately –10 and +40, respectively, if we
431
set the εNd value of the bulk CC to –17 (in the case of a chondritic BSE).Such compositions have never
432
been measured in MORBs or peridotites.
433
434
Several authors have proposed loess samples to be a good approximation of the upper crust because
435
these clastic rocks sample large surface areas and have relatively uniform Nd and Hf isotopic
436
compositions (e.g., Chauvel et al., 2014). Because the lower crust appears to have Hf-Nd isotopic ratios
437
similar to those of the upper crust (Vervoort et al., 2000), we also calculated the εCe-εNd mixing
438
hyperbola between the DMM end-member and a loess-like component. Its curvature is a function of the
439
Ce/Nd ratios of both end-members. The mean Ce/Nd value calculated from our loess samples (2.38 ±
440
0.30) is similar within errors to the value of 2.33 determined for the upper crust by Rudnick and Gao
441
(2003) and to that of the global subducting sediment reservoir that represents the bulk composition of
442
trench sediments (Plank, 2014). However, this result is more than twice the Ce/Nd ratios of 1.08 and
443
0.95 determined for the DMM by Salters and Stracke (2004) and Workman and Hart (2005),
444
respectively. Consequently, considering the Ce-Nd isotopic composition of loess as representative of
445
the CC moves the DMM-CC mixing curve further from the mantle array (Fig. 4).
446
447
The model age of loesses is 1.8 Ga (Chauvel et al., 2014), which is not widely agreed to be the mean
448
age of the crust. An older equivalent (2.2 Ga) of these samples would have a less radiogenic Ce-Nd
449
isotopic composition that still plots on the mantle array. Superimposing the DMM-loess mixing curve
450
on the mantle array (i.e., to linearise the DMM-loess hyperbola) requires increasing the DMM Ce/Nd
451
ratio towards a value identical to that of loesses. Unlike the CC reservoir, which has been calculated
452
from a large number of measurements, the DMM remains a model based on a series of assumptions,
453
such that its REE pattern can be questioned. Such a reservoir is represented in MORB Ce and Nd isotopic
454
compositions as a strong long-term depleted REE element pattern, and a consistent Ce/NdDMM ratio
455
requires the DMM to have a positive Ce elemental anomaly. Cerium anomaly generally reflects a
456
specific behaviour of Ce4+ relative to REE3+. However, such a Ce anomaly has never been measured in
457
MORBs.
458
459
The DMM-loess mixing curve coincides with the repartition of Island Arc Basalts (IABs) from the
460
Lesser Antilles and the Mariana Islands (Bellot et al., 2015, 2018). The isotopic compositions of OIBs
461
and IABs differ from those of MORBs due to the introduction of crustal material into their sources.
462
Although the isotopic compositions of arc lavas can be modified by post-melting reactions such as
463
assimilation-fractional crystallisation processes (AFC), this is not the case for the Marianas and Lesser
464
Antilles (e.g., Labanieh et al., 2010), and their Ce-Nd isotopic compositions are well explained by the
465
incorporation of sediments into the mantle wedge (Bellot et al., 2015, 2018). We expect a larger
466
incorporation of sediments in arc lavas relative to hotspot lavas since REEs are enriched in slab
467
dehydration fluids, whereas sediments are recycled with oceanic crust into the OIB source and their
468
signatures are consequently diluted. Indeed, OIBs and IABs are clearly distinct in the εCe-εNd diagram
469
(Fig. 4).
470
471
472
5.4. Effect of recycled surface material on the mantle array
473
474
The EM1, EM2, and HIMU mantle end-members have been defined from the most extreme isotopic
475
compositions measured in OIBs (Zindler and Hart, 1986) and are classically interpreted as representing
476
the recycling of surface materials into the deep mantle. Chauvel et al. (2008) modelled the Hf and Nd
477
isotopic compositions of basaltic crust and sediments recycled at different times during Earth’s history
478
and showed that the Hf-Nd mantle array required the incorporation of surface material older than 2 Ga
479
into the OIB source. Here we apply the evolution model to the Ce-Nd systematics (see Supplementary
480
Fig. S7): 1) the isotopic composition of recycled sediments and recycled oceanic crust (ROC) calculated
481
back in time is assumed to be on the evolution line built between their present-day isotopic composition
482
and the CHUR value at 4.568 Ga; 2) the actual isotopic compositions of these two reservoirs are then
483
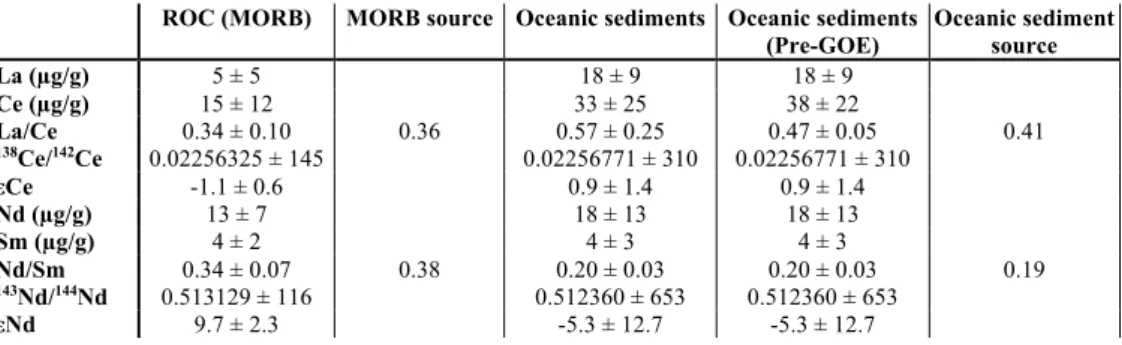
calculated considering the parent/daughter ratios in their source reservoirs. To this end, we consider the
484
mean 143Nd/144Nd, 138Ce/142Ce, 147Sm/144Nd, and 138La/142Ce ratios measured in oceanic sediments in
485
front of the Mariana trench (Sites 801 and 802, ODP Leg 129; Bellot et al., 2018) and near the Lesser
486
Antilles arc (DSDP site 144; Bellot et al., 2015) together with those of the MORB samples plotted in
487
Figure 2. Modern oceanic sediments are characterised by negative elemental cerium anomalies,
488
reflecting an oxidised environment. Before the GOE, dated around 2.4 Ga (see Holland, 2002), all REEs
489
in sediments were necessarily trivalent under the anoxic conditions. Thus, we removed the elemental
490
cerium anomaly from all oceanic sediments older than 2.4 Ga.
491
492
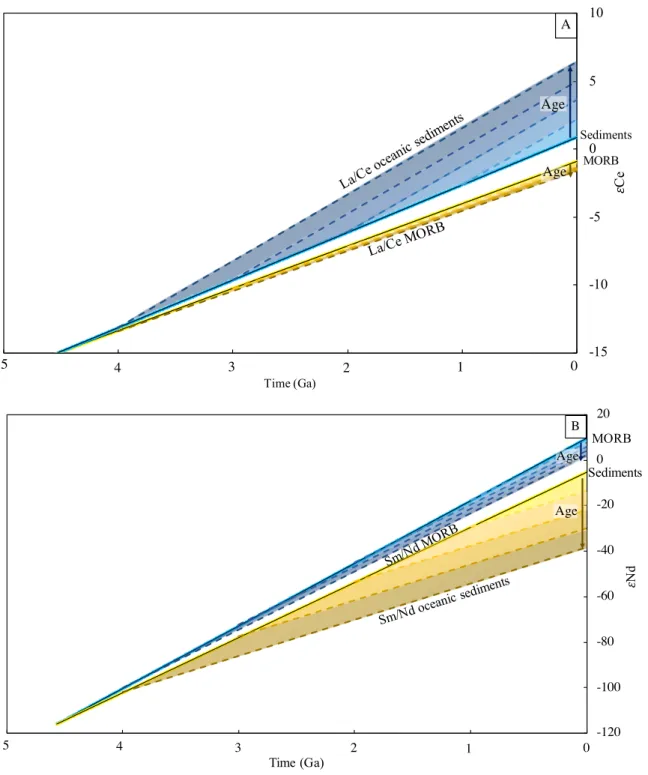
Our calculations produce important results. First, the ROC follows a positive slope in the εCe-εNd
493
diagram, whereas the mantle array defines a negative slope (Fig. 6,see Supplementary Fig. S7 for further
494
details). Thus, the incorporation of ROC into the mantle tends to shift the isotopic composition of OIBs
495
toward slightly less radiogenic Ce isotopic ratios than MORBs. Second, as previously shown by Chauvel
496
et al. (2008), the mantle array can be reproduced by mixing either a DMM-like or a FOZO-like
497
component (FOZO is assumed to have εCe = –0.6 and εNd = 6.24; see Boyet et al., 2019) and recycled
498
surface material (ROC and sediments have the same recycling ages). On the sole basis of Ce and Nd
499
isotopes, it is still unclear whether the different plume sources contain surface material recycled at
500
various time or pre-GOE material in various proportions (the two propositions being not mutually
501
exclusive). Also, the intersections of the recycled crust-sediment mixing curves and the mantle array
502
indicate the proportion of sediments in the recycled material (msediments / (msediments + moceanic crust)) to be
503
between 6 and 12%; this proportion decreases for younger recycled components. This last result must
504
be considered in parallel with the decreasing rate of crustal destruction until the present value of 3.2–
505
5.5 km3 yr–1 (Dhuime et al., 2018, and references therein).
506
507
Sediments formed before and after the GOE evolved to distinct Ce isotopic compositions. For a similar
508
proportion of sediments in the recycled component (i.e., 10% sediment and 90% oceanic crust), the εCe
509
value of a 2.5 Ga recycled component is inferior by 0.3 ε-units when we remove the Ce anomaly. More
510
importantly, in our model, only the recycling of pre-GOE sediments can explain the most enriched
511
isotopic compositions measured in OIBs. Corresponding samples are classified either as EM1 (samples
512
from Tristan Da Cunha, Gough, Heard, and Kerguelen Islands) or EM2 (Tahaa Island in the Society
513
archipelago). The Ce-Nd isotopic composition of Gough Island lavas was explained by the incorporation
514
of subcontinental lithospheric material at shallow depths into the mantle (Boyet et al., 2019). The lack
515
of correlation between the cerium anomalies and the Ce isotope compositions measured in Gough Island
516
lavas proves that ancient sediments carrier of negative element cerium anomaly were not incorporated
517
in the Gough mantle source. Moreover, mass-independent S isotopic fractionations measured in
olivine-518
hosted sulphides from other EM1 (e.g., Pitcairn) lavas similarly suggest the recycling of surface
519
materials that existed in a reduced atmosphere before the GOE (Cabral et al., 2013; Delavault et al.,
520
2016).
521
522
523
6. Conclusions
524
525
We measured the Ce isotopic compositions of 51 OIBs, 1 intraplate continental volcanism occurrence,
526
7 MORBs, 6 loess samples, and 11 chondrites, enhancing the terrestrial and extra-terrestrial Ce isotopic
527
database. We define the 138Ce/142Ce CHUR reference to be 0.02256577 ± 66. OIB and MORB samples
528
define the mantle array as εNd = -7.3 (± 0.5) × εCe + 0.4 (± 0.3). The mantle array passes through the
529
CHUR value and is not significantly different from a modelled early-depleted reservoir. We conclude
530
that combining Ce and Nd isotopic measurements in mantle-derived samples does not further constrain
531
the composition of the PM.
532
533
Mixing models between the DMM and CC end members, both estimated from sample measurements
534
(upper, or early mafic crusts), cannot reproduce the Ce-Nd mantle array but better fit IAB data. The
535
mantle array is better reproduced by considering bulk CCs consistent with a mass-balance budget of the
536
BSE (Ce isotopic compositions calculated for a range of accepted Nd). But the mixing hyperbolas do
537
not perfectly overlap the OIB samples with subchondritic Ce isotopic composition; and the calculated
538
εCe for the bulk crust are significantly different from all crustal rocks measured so far. In all these
539
models, linearising the mixing curves requires unrealistic Ce-Nd isotopic compositions and/or Ce/Nd
540
ratios never measured in rock samples. Alternatively, the recycling of sediments and oceanic crust into
541
hotspot sources, and their mixing with DMM- or FOZO-like material may explain the Ce-Nd mantle
542
array. Our results further show that Ce-Nd isotopic compositions measured in the most enriched
EM-543
like lavas can be reproduced by the incorporation in their source of recycled oceanic sediments that do
544
not have any elemental Ce anomaly. Because Ce is a redox-sensitive trace element that can be used to
545
trace the oxygenation of atmosphere (GOE at 2.4 Ga), our results suggest that some OIBs sample very
546
deep mantle reservoirs that may preserve pre-GOE recycled surface materials, in agreement with
547
observed S isotopic fractions in EM1 lavas. Constraining the long-term history of recycled surface
548
material in the mantle is essential to understand the isotope signature of mantle-derived samples. The
549
La-Ce isotope systematics offers a unique opportunity to detect changes on the chemical composition
550
of oceanic sediments through time.
551
552
Acknowledgments
553
554
We thank Raphael Pik, Manuel Moreira, Dan McKenzie, Pierre Schiano, Bertrand Moine, Ivan
555
Vlastelic, Jane Barling, and Catherine Chauvel for providing OIB and loess samples. We also
556
acknowledge Anthony Irving (University of Washington – Oudiyat Sbaa), the Western Australian
557
Museum (Yilmia – off WAM 13197), the National History Museum (University of Tartu – Pillistfer –
558
TUG 552-2), the Smithsonian Institution National Museum of Natural History (Allende – 45NM3529),
559
and the Muséum d’Histoire Naturelle de Paris (Agen – 1479 ; Saint-Severin – 2397 PE2) for providing
560
chondrites. We thank the Geological Survey of Japan for providing the isotopic standard JNdi-1. The
561
reference material CeLMV is available upon request. Detailed reviews by Richard W. Carlson and an
562
anonymous reviewer are much appreciated as are the editorial handling by Rajdeep Dasgupta. We also
563
thank K.R. Ludwig for the use of his program Isoplotâ. This project has received funding from the
564
European Research Council (ERC) under the European Union's Horizon 2020 research and innovation
565
program (Grant Agreement No. 682778 - ISOREE). AB thanks support from the Canada Foundation
566
for Innovation and NSERC Discovery Grant and CRC programs. This is Laboratory of Excellence
567
ClerVolc contribution no. XX.
568
569
570
Appendix A. Supplementary material
571
572
Supplementary material related to this article can be found online at XX.
573
Supplementary data 1: Major and trace element contents measured by quadrupole ICP-MS.
574
Supplementary data 2: Ce and Nd isotopic ratios of standard and rock samples and supplementary
575
information.
576
Supplementary material: 1) Sample descriptions from trace element diagrams and Ce anomalies; 2)
577
138Ce/142Ce ratios from literature and example of normalisation with MORB; 3) 138Ce/142Ce ratios of
578
crustal samples from literature; 4)mass-balance calculations; and 5) recycling models.
579
580
581
References
582
583
Allègre, C.J., Lewin, É., 1989. Chemical structure and history of the Earth: evidence from global
non-584
linear inversion of isotopic data in a three-box model. Earth Planet. Sci. Lett. 96, 61–88.
585
https://doi.org/10.1016/0012-821X(89)90124-6
586
Allègre, C.J., Manhès, G., Lewin, É., 2001. Chemical composition of the Earth and the volatility
587
control on planetary genetics. Earth Planet. Sci. Lett. 185, 49–69.
https://doi.org/10.1016/S0012-588
821X(00)00359-9
589
Barrat, J.A., Zanda, B., Jambon, A., Bollinger, C., 2014. The lithophile trace elements in enstatite
590
chondrites. Geochim. Cosmochim. Acta 128, 71–94. https://doi.org/10.1016/j.gca.2013.11.042
591
Barrat, J.-A., Zanda, B., Moynier, F., Bollinger, C., Liorzou, C., Bayon, G., 2012. Geochemistry of CI
592
chondrites: Major and trace elements, and Cu and Zn isotopes. Geochim. Cosmochim. Acta 83,
593
79–92. https://doi.org/10.1016/j.gca.2011.12.011
594
Begemann, F., Ludwig, K.R., Lugmair, G.W., Min, K., Nyquist, L.E., Patchett, P.J., Renne, P.R.,
595
Shih, C.-Y., Villa, I.M., Walker, R.J., 2001. Call for an improved set of decay constants for
596
geochronological use. Geochim. Cosmochim. Acta 65, 111–121.
https://doi.org/10.1016/S0016-597
7037(00)00512-3
598
Bellot, N., Boyet, M., Doucelance, R., Bonnand, P., Savov, I.P., Plank, T., Elliott, T., 2018. Origin of
599
negative cerium anomalies in subduction-related volcanic samples: Constraints from Ce and Nd
600
isotopes. Chem. Geol. 500, 46–63. https://doi.org/10.1016/j.chemgeo.2018.09.006
601
Bellot, N., Boyet, M., Doucelance, R., Pin, C., Chauvel, C., Auclair, D., 2015. Ce isotope systematics
602
of island arc lavas from the Lesser Antilles. Geochim. Cosmochim. Acta 168, 261–279.
603
https://doi.org/10.1016/j.gca.2015.07.002
604
Belousova, E.A., Kostitsyn, Y.A., Griffin, W.L., Begg, G.C., O’Reilly, S.Y., Pearson, N.J., 2010. The
605
growth of the continental crust: Constraints from zircon Hf-isotope data. Lithos 119, 457–466.
606
https://doi.org/10.1016/j.lithos.2010.07.024
607
Blichert-Toft, J., Frey, F.A., Albarède, F., 1999. Hf Isotope Evidence for Pelagic Sediments in the
608
Source of Hawaiian Basalts. Science 285, 879. https://doi.org/10.1126/science.285.5429.879
609
Bonnand, P., Israel, C., Boyet, M., Doucelance, R., Auclair, D., 2019. Radiogenic and stable Ce
610
isotope measurements by thermal ionisation mass spectrometry. J. Anal. At. Spectrom.
611
https://doi.org/10.1039/C8JA00362A
612
Bouhifd, M.A., Boyet, M., Cartier, C., Hammouda, T., Bolfan-Casanova, N., Devidal, J.L., Andrault,
613
D., 2015. Superchondritic Sm/Nd ratio of the Earth: Impact of Earth’s core formation. Earth
614
Planet. Sci. Lett. 413, 158–166. https://doi.org/10.1016/j.epsl.2014.12.054
615
Bouvier, A., Boyet, M., 2016. Primitive Solar System materials and Earth share a common initial
616
142Nd abundance. Nature 537, 399–402. https://doi.org/10.1038/nature19351
617
Bouvier, A., Vervoort, J.D., Patchett, P.J., 2008. The Lu–Hf and Sm–Nd isotopic composition of
618
CHUR: Constraints from unequilibrated chondrites and implications for the bulk composition of
619
terrestrial planets. Earth Planet. Sci. Lett. 273, 48–57. https://doi.org/10.1016/j.epsl.2008.06.010
620
Boyet, M., Bouvier, A., Frossard, P., Hammouda, T., Garçon, M., Gannoun, A., 2018. Enstatite
621
chondrites EL3 as building blocks for the Earth: The debate over the 146 Sm– 142 Nd
622
systematics. Earth Planet. Sci. Lett. 488, 68–78. https://doi.org/10.1016/j.epsl.2018.02.004
623
Boyet, M., Carlson, R.W., 2006. A new geochemical model for the Earth’s mantle inferred from
624
146Sm–142Nd systematics. Earth Planet. Sci. Lett. 250, 254–268.
625
https://doi.org/10.1016/j.epsl.2006.07.046
626
Boyet, M., Carlson, R.W., 2005. 142Nd evidence for early (> 4.53 Ga) global differentiation of the
627
silicate Earth. Science 309, 576–581. https://doi.org/10.1126/science.1113634
628
Boyet, M., Doucelance, R., Israel, C., Bonnand, P., Auclair, D., Suchorski, K., Bosq, C., 2019. New
629
constraints on the origin of the EM-1 component revealed by the measurement of the La-Ce
630
isotope systematics in Gough Island lavas. Geochem. Geophys. Geosystems 20.
631
https://doi.org/10.1029/2019GC008228
632
Braukmüller, N., Wombacher, F., Hezel, D.C., Escoube, R., Münker, C., 2018. The chemical
633
composition of carbonaceous chondrites: Implications for volatile element depletion,
634
complementarity and alteration. Geochim. Cosmochim. Acta 239, 17–48.
635
https://doi.org/10.1016/j.gca.2018.07.023
636
Burkhardt, C., Borg, L.E., Brennecka, G.A., Shollenberger, Q.R., Dauphas, N., Kleine, T., 2016. A
637
nucleosynthetic origin for the Earth’s anomalous 142Nd composition. Nature 537, 394–398.
638
https://doi.org/10.1038/nature18956
639
Cabral, R.A., Jackson, M.G., Rose-Koga, E.F., Koga, K.T., Whitehouse, M.J., Antonelli, M.A.,
640
Farquhar, J., Day, J.M.D., Hauri, E.H., 2013. Anomalous sulphur isotopes in plume lavas reveal
641
deep mantle storage of Archaean crust. Nature 496, 490. https://doi.org/10.1038/nature12020
642
Carlson, R.W., Boyet, M., 2008. Composition of the Earth’s interior: the importance of early events.
643
Philos. Trans. R. Soc. Math. Phys. Eng. Sci. 366, 4077–4103.
644
https://doi.org/10.1098/rsta.2008.0166
645
Carlson, R.W., Boyet, M., Horan, M., 2007. Chondrite Barium, Neodymium, and Samarium Isotopic
646
Heterogeneity and Early Earth Differentiation. Science 316, 1175–1178.
647
https://doi.org/10.1126/science.1140189
648
Caro, G., Bourdon, B., Halliday, A.N., Quitté, G., 2008. Super-chondritic Sm/Nd ratios in Mars, the
649
Earth and the Moon. Nature 452, 336–339. https://doi.org/10.1038/nature06760
650
Carpentier, M., Chauvel, C., Maury, R.C., Mattielli, N., 2009. The “zircon effect” as recorded by the
651
chemical and Hf isotopic compositions of Lesser Antilles forearc sediments. Earth Planet. Sci.
652
Lett. 287, 86–99. https://doi.org/10.1016/j.epsl.2009.07.043
653
Chase, C., Patchett, P., 1988. Stored mafic/ultramafic crust and early Archean mantle depletion. Earth
654
Planet. Sci. Lett. 91, 66–72. https://doi.org/10.1016/0012-821X(88)90151-3
655
Chauvel, C., Garçon, M., Bureau, S., Besnault, A., Jahn, B., Ding, Z., 2014. Constraints from loess on
656
the Hf–Nd isotopic composition of the upper continental crust. Earth Planet. Sci. Lett. 388, 48–
657
58. https://doi.org/10.1016/j.epsl.2013.11.045
658
Chauvel, C., Lewin, E., Carpentier, M., Arndt, N.T., Marini, J.-C., 2008. Role of recycled oceanic
659
basalt and sediment in generating the Hf–Nd mantle array. Nat. Geosci. 1, 64–67.
660
https://doi.org/10.1038/ngeo.2007.51
661
Dauphas, N., 2017. The isotopic nature of the Earth’s accreting material through time. Nature 541,
662
521–524. https://doi.org/10.1038/nature20830
663
Dauphas, N., Pourmand, A., 2015. Thulium anomalies and rare earth element patterns in meteorites
664
and Earth: Nebular fractionation and the nugget effect. Geochim. Cosmochim. Acta 163, 234–
665
261. https://doi.org/10.1016/j.gca.2015.03.037
666
Delavault, H., Chauvel, C., Thomassot, E., Devey, C.W., Dazas, B., 2016. Sulfur and lead isotopic
667
evidence of relic Archean sediments in the Pitcairn mantle plume. Proc. Natl. Acad. Sci. 113,
668
12952. https://doi.org/10.1073/pnas.1523805113
669
Dhuime, B., Hawkesworth, C.J., Cawood, P.A., Storey, C.D., 2012. A Change in the Geodynamics of
670
Continental Growth 3 Billion Years Ago. Science 335, 1334.
671
https://doi.org/10.1126/science.1216066
672
Dhuime, B., Hawkesworth, C.J., Delavault, H., Cawood, P.A., 2018. Rates of generation and
673
destruction of the continental crust: implications for continental growth. Philos. Trans. R. Soc.
674
Math. Phys. Eng. Sci. 376, 20170403. https://doi.org/10.1098/rsta.2017.0403
675
Dickin, A.P., 1987. Cerium isotope geochemistry of ocean island basalts. Nature 326, 283–284.
676
https://doi.org/10.1038/326283a0
677
Goldstein, S.J., Jacobsen, S.B., 1988. Nd and Sr isotopic systematics of river water suspended
678
material: implications for crustal evolution. Earth Planet. Sci. Lett. 87, 249–265.
679
https://doi.org/10.1016/0012-821X(88)90013-1
680
Goldstein, S.L., O’Nions, R.K., Hamilton, P.J., 1984. A Sm-Nd isotopic study of atmospheric dusts
681
and particulates from major river systems. Earth Planet. Sci. Lett. 70, 221–236.
682
https://doi.org/10.1016/0012-821X(84)90007-4
683
Hawkesworth, C.J., Cawood, P.A., Dhuime, B., Kemp, T.I.S., 2017. Earth’s Continental Lithosphere
684
Through Time. Annu. Rev. Earth Planet. Sci. 45, 169–198.
https://doi.org/10.1146/annurev-earth-685
063016-020525
686
Holland, H.D., 2002. Volcanic gases, black smokers, and the great oxidation event. Geochim.
687
Cosmochim. Acta 66, 3811–3826. https://doi.org/10.1016/S0016-7037(02)00950-X