Publisher’s version / Version de l'éditeur:
Vous avez des questions? Nous pouvons vous aider. Pour communiquer directement avec un auteur, consultez la première page de la revue dans laquelle son article a été publié afin de trouver ses coordonnées. Si vous n’arrivez pas à les repérer, communiquez avec nous à PublicationsArchive-ArchivesPublications@nrc-cnrc.gc.ca.
Questions? Contact the NRC Publications Archive team at
PublicationsArchive-ArchivesPublications@nrc-cnrc.gc.ca. If you wish to email the authors directly, please see the first page of the publication for their contact information.
https://publications-cnrc.canada.ca/fra/droits
L’accès à ce site Web et l’utilisation de son contenu sont assujettis aux conditions présentées dans le site LISEZ CES CONDITIONS ATTENTIVEMENT AVANT D’UTILISER CE SITE WEB.
Technical Note (National Research Council of Canada. Division of Building
Research), 1965-09
READ THESE TERMS AND CONDITIONS CAREFULLY BEFORE USING THIS WEBSITE.
https://nrc-publications.canada.ca/eng/copyright
NRC Publications Archive Record / Notice des Archives des publications du CNRC : https://nrc-publications.canada.ca/eng/view/object/?id=38bc669b-39e5-410d-a39c-1bf8f9d91ec0 https://publications-cnrc.canada.ca/fra/voir/objet/?id=38bc669b-39e5-410d-a39c-1bf8f9d91ec0
NRC Publications Archive
Archives des publications du CNRC
This publication could be one of several versions: author’s original, accepted manuscript or the publisher’s version. / La version de cette publication peut être l’une des suivantes : la version prépublication de l’auteur, la version acceptée du manuscrit ou la version de l’éditeur.
For the publisher’s version, please access the DOI link below./ Pour consulter la version de l’éditeur, utilisez le lien DOI ci-dessous.
https://doi.org/10.4224/40001196
Access and use of this website and the material on it are subject to the Terms and Conditions set forth at
Distance constant determination and calibration of two U2A wind
speed detectors
DIVISION OF BUILDING RESEARCH
No.
443 APPROVED BY RFLNOTlE
CHECKED BY WRS'Jr
EClHl
Ii][
セ||
PREPARED/
Septe:mber 1965PREPARED FOR ャゥセゥエ・、 distribution
SUBJECT DIST ANCE CONSTANT DETERMINATION AND CALIBRATION
OF TWO U2A WIND SPEED DETECTORS
Wind Speed Measure:ments Near the Ground
Wind speed :measure:ments used in building design are :made in the turbulent boundary layer extending fro:m the ground surface to heights of 1000 to 2000 ft. In this layer wind speed is rarely steady (Fig. 1), and averages should be taken over several :minutes for wind speed records.
The intensity of gustine s s of high winds during :mature
stor:ms is :mainly dependent on the ground roughness for a considerable distance upwind and on the height above ground. The :maxi:mu:m wind loads that should be applied in design depend on the "size" of the gust, relative to the size of the structure, as well as the :maxi:mu:m gust speed. It is of great i:mportance in building design, therefore, to know to whci.t size or duration of gust the reported :maxirn.u:m wind speed refers. This requires that the response characteristics of the ane:mo:meter are known.
At present, little infor:mation is available on the response characteristics of the ane:mo:meters used to provide the :meteorological data on which design assu:mptions are based. The :maxi:mu:m gust
2
-based on readings of the Dines pressure tube anem.om.eter. These are wind speeds in gusts lasting som.ewhat less than 10 sec, but it is difficult to be m.ore precise than that. Two U2A wind speed detectors (anem.om.eters) to be used in work by the Division of
Building Research were therefore tested in a wind tunnel to determ.ine their response to gusts.
Acquisition of Two U2A Wind Speed Detectors
A U2A wind speed detector and indicator were loaned by the Meteorological Branch of the Departm.ent of Transport to the Division of Building Research in 1963 for the purpose of com.paring wind gust readings from. this instrum.ent and a Dines pressure tube anem.om.eter. A second U2A wind speed detector was acquired in 1964 when the Building Structures Section purchased a com.plete set of the U2A wind recording equipm.ent from. the Meteorological Branch for use in a research project to m.easure wind pressures on high buildings in Montreal.
Distance Constant
As the U2A anem.om.eter (wind speed detector) purchased by the Structures Section was to be used to investigate the distribution of gust energy according to gust size, or wavelength (gust period x
wind speed), it was necessary to determ.ine the dynam.ic response characteristics of the instrum.ent (Fig. 1). A com.m.only used para-m.eter of dynam.ic response is the "distance constant" of the anem.opara-m.eter; this indicate s the num.ber of feet of wind that m.ust pas s the instrum.ent for it to give a reasonably accurate reading of gust speed. If the
distance constant is known, the ratio of the actual reading divided by the true speed can be related to the gust wavelength or "size, nand the percentage response of the instrum.ent to gusts of various
durations can be plotted. A m.ore com.plete discus sion of dynam.ic response is given in a paper presented at the First Canadian
Conference on Microm.eteorology at Toronto in April 1965 (Reference 1).
Calculation of Distance Constant
The distance constant is defined as the product of the tim.e, in seconds, required for the instrum.ent to accelerate from. zero to 64 per cent of full wind speed, m.ultiplied by that full wind speed in
feet per second. The constant is therefore a "distance,It in feet.
The distance constant is essentially independent of the wind speed. Calibration
The U2A wind speed detector generates a dc voltage proportional to the angular velocity in rpm of the three cups; this is normally indicated by a moving coil type voltmeter used
as an indicator and graduated in mph. The detector used in the
wind research project in Montreal, however, was connected directly to an optical galvanometer writing an analogue signal on a multi-channel strip chart.
The conversion factor relating detector output in volts to wind speed in mph had to be determined in order to interpret the analogue signal, and this operation is called "calibration" in thi s note.
Testing Facility and Procedure
The observations on which the conversion factor and distance constant calculations are based were made in the 15-ft diameter vertical wind tunnel at the Montreal Road laboratories (Building M-2) of the National Aeronautical Establishment in Ottawa on 26 October 1964.
The U2A detectors (the one on loan had a black housing; the one purchased for installation in Montreal had a stainless
steel housing) were mounted in turn on a light tubular boom,
which was swung out to the centre of the tunnel at various wind
speeds. Readings of detector output were made with a
vacuum-tube voltmeter, and tunnel speed was obtained from readings of the fan speed in rpm using the tunnel calibration chart.
Observationsfor the distance constant calculation were made by holding the cups stationary in the flow by means of a bar, commencing to record output on a recording oscillograph, and
then releasing the cups. The time taken to reach 64 per cent of
full tunnel speed was then read off the graph of detector output versus time.
The two sets of observations for the distance constant and for the conversion factor (calibration) are given in Tables I
4
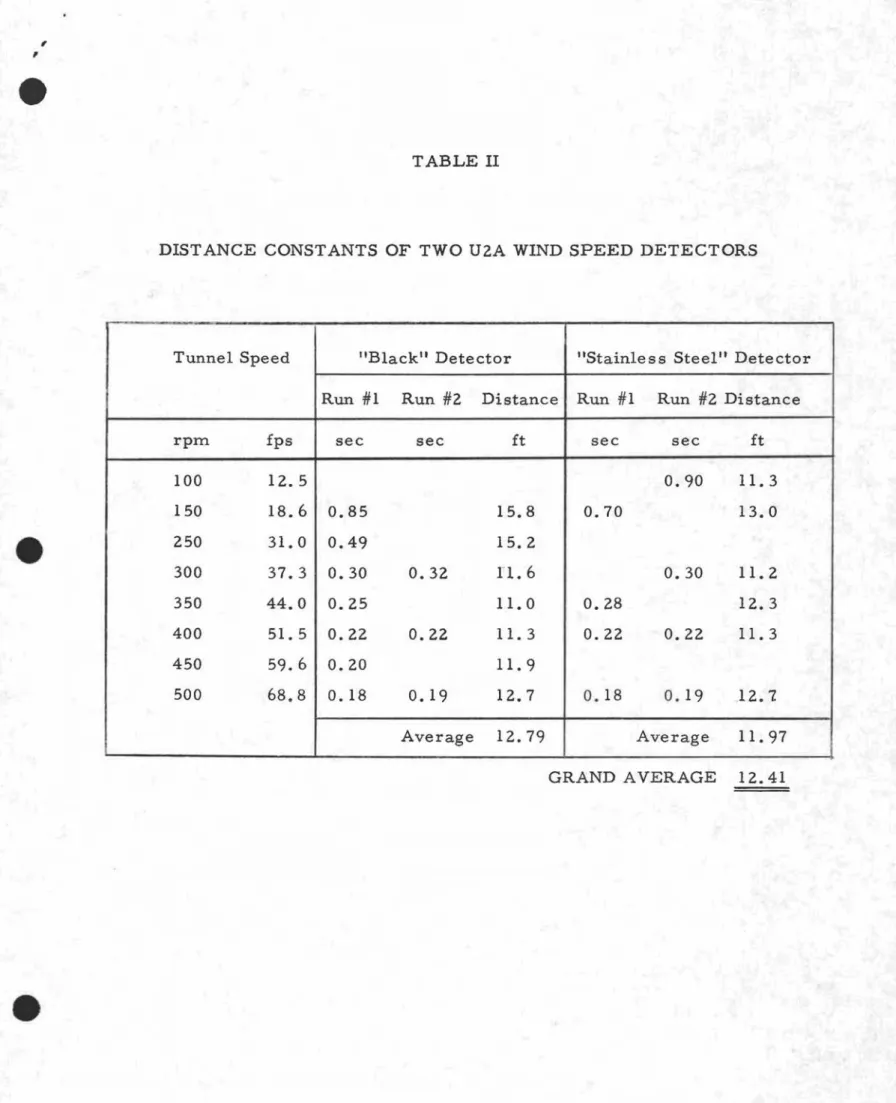
-and II, respectively. Note that the distance constant was determined at several wind speeds with reasonably. consistent re suIts.
Results
The average values for distance constants of the U2A detector on loan (black housing) and the U2A detector purchased (stainless steel housing) are 13 ft and 12 ft, respectively.
The conversion factors obtained by least squares regression of speed on voltage were 24.25 mph/volt and 24.66 mph/volt for the loaned and the purchased instruments
respectively. By regression of voltage on speed the factors
(inverted) were 24.33 mph/volt and 24.81 mph/volt, respectively. The two instruments, however, gave readings at a given tunnel speed setting that were so similar that it is considered more reasonable to combine the observations and calculate one figure for both instruments. The regre s sion of speed on voltage, then, gives 24.55 mph/volt, and the regression of voltage on speed (inverted factor) gives 24.69 mph/volt.
For practical purposes the conversion factor for the two instrUInents was taken to be 25 mph/volt. Similarly, the
obse.rvations for distance constant were combined and a common value of 12 ft was used for both instruments.
Conclusions
The ratio of indicated speed amplitude over actual speed amplitude is related to gust wavelength by the following formula:
or
x/x
o L A ==
1VI
+(
Rセl
)2
V\X
o/X)2 - 1
2nx
=
x
o=
where L A = distance constant (ft)=
wavelength of speed fluctuation (assumed (gust period in sec x speed in ft per sec) indicated amplitude of speed of gust actual amplitude of speed of gust(taken from. p. 8 of Refe renee 1).
If the ratio X/X o
=
80 per cent is taken as the acceptable lower lim.it of recording fidelity, then the m.inim.um. gust wave-length that can be recorded by the instrum.ents is 100 ft. At a wind speed of 60 m.ph=
88 fps this represents a gust frequency of 0.88 cps.Although the work described in this Technical Note has established the response of the UZA anem.om.eter, the author is not aware of any determ.ination of the response of the Dines Pressure Tube anem.om.eter. Recent indications are that m.axim.um. gust readings of the UZA anem.om.eter are consistently higher than corresponding readings of the Dines Pressure Tube anem.om.eter, on which the gust speeds of Supplem.ent No. 1 to the National Building Code are based.
This statem.ent is based, first, on brief com.parison of readings of the two types of instrum.ents during a windstorm. in Ottawa, and secondly, on the fact that readings of the UZA
anem.om.eter at various m.eteorological stations have been higher than would be expected from. an analysis of past records.
The present study has shown that the shortest gust m.easured accurately by the UZA instrum.ent (at 60 m.ph) lasts about 1 to 1 l/Z sec, whereas it m.ay be concluded that the readings of the Dines instrum.ent correspond to gusts lasting longer than this, perhaps 4 to 6 sec, by the above criterion for acceptable lim.its of faithful rcesponse.
It would therefore appear that a sim.ilar study of the response (or distance constant) of the Dines Pressure Tube anem.om.eter would be desirable to allow proper correlation (and, if necessary, the required adjustm.ents) in the transition from. one instrum.ent to the other by the Meteorological Branch.
Reference
Gill, G. C. On the dynam.ic response of m.eteorological sensors and recorders. Paper presented at First Canadian Conference on Microm.eteorology, Toronto, April 1965.
TABLE I
CALIBRATION OF TWO U2A WIND SPEED DETECTORS
Output Voltage
"Black" Detector ItStainle s s Steel" Detector
.
Tunnel Speed Run #1 Run #2 Run #1 Run #2
rpm mph Volt Volt Volt Volt
100 8.5 0.26 150 12.7 0.43 0.42 200 17.0 0.60 0.64 0.60 0.64 250 21. 2 0.80 0.80 300 25.4 1. 00 1. 00 1. 00 1. 00 350 30.0 1. 20 1. 20 400 35.1 1.40 1. 40 1. 40 1. 40 450 40.6 1. 60 1. 60 500 46.9 1. 85 1. 80 1. 80 1. 80
,
TABLE II
DIST ANCE CONSTANTS OF TWO U2A WIND SPEED DETECTORS
Tunnel Speed "Black" Detector "Stain1e s s Steel" Dete ctor
Run #1 Run #2 Distance Run #1 Run #2 Distance
rpm ips sec sec it sec sec it
100 12. 5 0.90 11. 3 150 18.6 0.85 15.8 0.70 13.0 250 31. 0 0.49 15.2 300 37.3 0.30 0.32 1l.6 0.30 11. 2 350 44.0 0.25 11.0 0.28 12.3 400 51. 5 0.22 0.22 11. 3 0.22 0.22 11. 3 450 59.6 0.20 11. 9 500 68.8
o.
18 0.19 12.7 0.18 0.19 12.'Z Average 12.79 Average 11.97 GRAND AVERAGE 12.41I