Computational Methods for
Functional Interpretation of Diverse Omics Data
by
Sumaiya Nazeen
B.Sc. Engg., Bangladesh University of Engineering and Technology (2011) S.M., Massachusetts Institute of Technology (2014)
Submitted to the
Department of Electrical Engineering and Computer Science
in partial fulfillment of the requirements for the degree of
Doctor of Philosophy
at the
MASSACHUSETTS INSTITUTE OF TECHNOLOGY
September 2019
c
○ Massachusetts Institute of Technology 2019. All rights reserved.
Author . . . .
Department of Electrical Engineering and Computer Science
August 30, 2019
Certified by . . . .
Bonnie Berger
Simons Professor of Mathematics
Professor of Electrical Engineering and Computer Science
Thesis Supervisor
Accepted by . . . .
Leslie A. Kolodziejski
Professor of Electrical Engineering and Computer Science
Chair, Department Committee on Graduate Students
Computational Methods for
Functional Interpretation of Diverse Omics Data
by
Sumaiya Nazeen
Submitted to the
Department of Electrical Engineering and Computer Science on August 30, 2019, in partial fulfillment of the
requirements for the degree of Doctor of Philosophy
Abstract
Recent technological advances have resulted in an explosive growth of various types of “omics” data, including genomic, transcriptomic, proteomic, and metagenomic data. Functional interpretation of these data is key to elucidating the potential role of different molecular levels (e.g., genome, transcriptome, proteome, metagenome) in human health and disease. However, the massive size and heterogeneity of raw data pose substantial computational and statistical challenges in integrating and inter-preting these data. To overcome these challenges, we need sophisticated approaches and scalable analytical frameworks. This thesis outlines two research efforts along these lines. First, we develop a novel three-tiered integrative omics framework for integrating and functionally analyzing heterogeneous omics datasets across a group of co-occurring diseases. We demonstrate the effectiveness of this framework in in-vestigating the shared pathophysiology of autism spectrum disorder (ASD) and its multi-organ-system co-morbid diseases (e.g., inflammatory bowel disease, asthma, muscular dystrophy, cerebral palsy) and uncover a novel innate immunity connection between them. Second, we develop a new end-to-end computational tool, Carnelian, for robust, alignment-free functional profiling of whole metagenome sequencing reads, that is uniquely suited to finding hidden functional trends across diverse data sets in comparative analysis. Carnelian can find shared metabolic pathways, concordant functional dysbioses, and distinguish microbial metabolic function missed by state-of-the-art functional annotation tools. We demonstrate Carnelian’s effectiveness on large-scale metagenomic studies of type-2 diabetes, Crohn’s disease, Parkinson’s dis-ease, and industrialized versus non-industrialized cohorts.
Thesis Supervisor: Bonnie Berger Title: Simons Professor of Mathematics
To the wonderful memories of
my beloved maternal and paternal grandmothers, Jamal Ara Begum and Hayaten Nesha
They always supported me and celebrated every success of mine. I miss them every day!
Acknowledgments
First and foremost, I would like to immensely thank my thesis supervisor, Bonnie Berger, who has been a constant source of inspiration and encouragement. I am grateful to her for providing me the freedom to explore many topics in computa-tional biology and to pursue my interests while offering technical guidance and advice throughout my years at MIT. Besides being an extremely resourceful mentor, Bonnie is also a compassionate person who always cared for my well-being. When I was diagnosed with a rare health condition during my second year of Ph.D. and had to go through major neurosurgery, she offered her full support. She patiently supported me throughout my surgery and the year-long recovery process, which I am really grateful for. I hope to extend the same level of kindness and compassion towards my students in the future.
I am grateful to Eric Alm and Manolis Kellis for being on my thesis committee. They believed in me, provided guidance, and pointed me to the areas where I could improve to succeed in academia. I want to acknowledge my collaborators, Nathan Palmer, Isaac Kohane, and Yun William Yu; this thesis would not have been possible without their invaluable contributions. Special thanks to Eric Alm, Mathieu Groussin, and Mathilde Poyet for sharing the unpublished gut microbiome data from Bostonian and Baka individuals from the Global Microbiome Conservancy project (http:// microbiomeconservancy.org/) with us.
I am immensely thankful for my peers in the Berger lab, who have not only helped me grow as a researcher but also helped me persevere through the ups and downs of grad school. In particular, thanks to Po-Ru, George, and Mark for inspiring me to join Berger lab; to Deniz and Jian for helping me get started on research; to Sean, Deniz, Hoon, William, Ariya, Rohit, Noah, Yaron, Sepehr, Ibrahim, Sarah, Tristan, Perry, Youn, Ashwin, Andrew, Ellen, Brian, Max, Lillian, Ben, Rachel, and Alex for all the conversations I had with them about things both research and not research related; and to Patrice for greeting me everyday with warmth, lending a shoulder
the lab from falling apart!).
My graduate experience has been greatly enhanced because of a warm set of people around me. I have enjoyed being involved with the GW6, GWAMIT, and TOC communities, and getting to know so many amazing minds. Thanks to Mie, Yiou, Yi, Becca, Lily, Cindy, and Debbie, with whom I have shared many enjoyable moments throughout grad school. I owe my gratitude to Christina; I have always appreciated your friendship and encouragement; the wisdom you shared with me about life and faith has always inspired me and helped me build confidence whenever I felt low. Thank you, Marty, for all the fun conversations and encouragements; I learned so much about life from you. I have also been blessed with the best roommates and neighbors: Rosalie, Kristi, Bella, Dora, Katherine, Jack, and Dhavala, who helped me have the much needed work-life balance.
I had a great time being part of the Bangladeshi Students Association of MIT and organizing social and cultural events. It was great to have an excellent set of friends in the Boston area, including Ehsan bhai, Nafisa apu, Nasim bhai, Zakia apu, Zubair, Saima, Sabrina, Hasnain bhai, Deeni, Nazia, Urmi, Sujoy bhai, Tapoti apu, Saquib, Mahi, Bristy, Sabrine, Tahsin, Sanzeed, Caleb, Lana, Phei Er, John, Tiara, Jian-qiao, Nadim, Takian, Nishit, Deena, Murshid bhai, Zayan, Wasifa, Sourav, Adeeb, Protyasha, Taniya apu, Rumpa apu, Shafqat bhai, Maisha, Usama, and Ayesha. The time spent with all of you will always remain very memorable to me! I am also thank-ful for my friends from Bangladesh and all over the world made through Fulbright Fellowship. They always made time to chat with me despite being in different time zones. Special thanks to Fatema and Rimpi for patiently listening to all my rants throughout the years and keeping me sane during stressful periods of grad school.
I owe my gratitude to all the members of the EECS Graduate Office, Financial Services, CSAIL Headquarters, and International Students Office for helping me with the logistics of grad school. Special thanks to Janet, Leslie, Alicia, Kathy, and Sylvia for being there for me whenever I needed advice. I am incredibly grateful to my care teams at MIT Medical and MGH, who provided top-notch care for my health concerns. Throughout my Ph.D., I was generously supported by the International
Fulbright Science & Technology Fellowship, MIT’s Ludwig Center Molecular Oncol-ogy Fellowship, and grants from the National Institute of Health, the Center for Microbiome Informatics and Therapeutics, and F. Thomson Leighton fund.
Thanks also to all the great advisors and mentors I have had over the years outside of MIT. This includes Dr. M Sohel Rahman, Dr. Mohammad Kaykobad, and Dr. Mohammad Eunus Ali at BUET, and Dr. Ishtiaque Ahmed at the University of Toronto, who have always been a source of great advice and encouragement.
I am grateful to my mom (Nilufar Jahan), dad (S M Salim Jahangir), and broth-ers (Shahriar Salim and Taqi Tahmeed Sakib) for their unwavering support of my research pursuits. Their love and trust in my abilities have been a significant source of inspiration throughout this journey. I would also like to acknowledge my extended family who have always prayed for me, believed in me, and encouraged me to push forward.
Finally, I express my utmost gratitude to my greatest supporter: to the Almighty Allah, who had bestowed this opportunity upon me and helped me persevere through every part of this journey. I am immensely grateful for His innumerable blessings all these years, which have helped me grow not only academically but also spiritually.
“He (Allah) is your Protector; and
excellent is the Protector and excellent is the Helper.” ∼ Al Quran 22:78 ∼
Contents
1 Introduction 25
1.1 Types of omics data . . . 26
1.2 Challenges in functional interpretation of omics data . . . 28
1.3 Prior work on these challenges . . . 29
1.3.1 Study of groups of diseases in the literature . . . 29
1.3.2 Functional profiling of metagenomic reads and comparative func-tional metagenomics . . . 31
1.4 Outline . . . 32
2 Multi-level integrative omics analysis for ASD and its comorbidities 35 2.1 Introduction . . . 36
2.2 Results . . . 39
2.2.1 Overview of the three-tiered integrative omics pipeline . . . . 39
2.2.2 Involvement of innate immunity pathways in ASD and its co-morbidities . . . 49
2.2.3 Disease–innate immunity pathway overlap at gene level . . . . 56
2.2.4 Discriminatory power of innate immunity pathway genes . . . 63
2.3 Methods . . . 64
2.3.1 Gene-centric transcriptomic analysis per disease . . . 64
2.3.2 Pathway-centric enrichment analysis per disease . . . 65
2.3.3 Across-disease shared significance analysis of pathways . . . . 67
2.4 Discussion . . . 73
2.5 Conclusions and future directions . . . 76
2.6 Availability of data and source code . . . 77
3 Robust comparative functional metagenomics across diverse study populations 79 3.1 Background . . . 79
3.2 Results . . . 84
3.2.1 Overview of Carnelian . . . 84
3.2.2 Revealing concordant functional dysbiosis across geographically separated disease cohorts . . . 87
3.2.3 Enabling accurate patient vs control classification using func-tional metagenomic markers . . . 115
3.2.4 Uncovering functional relatedness of diverse industrialized and non-industrialized microbiomes . . . 122
3.2.5 Finding novel functional dysbiosis in the gut microbiome of Parkinson’s patients . . . 132
3.2.6 Robustness to sequencing technology biases . . . 142
3.2.7 Applicability to environmental metagenomes . . . 142
3.2.8 Benchmarking Results . . . 150
3.3 Methods . . . 165
3.3.1 Main components of the Carnelian pipeline . . . 165
3.3.2 Database curation . . . 169
3.3.3 Constructing feature vectors using Opal-Gallager hashes . . . 170
3.3.4 Setup for benchmarking experiments . . . 172
3.3.5 Functional profiling of real data sets . . . 172
3.3.6 Quantifying microbial functional variation in real data sets . . 175
3.4 Discussion . . . 176
3.5 Conclusions . . . 179
4 Conclusion 181
A Supplementary information for multi-level integrative omics analysis
for ASD and its comorbidities 183
B Supplementary information for robust comparative functional
metage-nomics across diverse study populations 193
List of Figures
2-1 Three-tiered integrative omics pipeline. . . 40
2-2 Discriminatory power of the differentially expressed genes selected
un-der different false discovery rate (FDR) corrections across case-control
cohorts of ASD and its comorbidities. . . 44
2-3 Quantile-quantile plots showing the distribution of combined 𝑝-values
of pathways across ASD and its comorbidities. . . 45
2-4 Quantile-quantile plots showing the distribution of 𝑝-values of
path-ways in each of ASD and its comorbidities. . . 47
2-5 Quantile-quantile plots showing the distribution of combined 𝑝-values
from each disease with the simulated background 𝑝-value distribution of pathways. . . 48
2-6 Innate immunity pathways color-tagged by comorbidity findings. . . . 61
2-7 Classification of cases vs. controls in different disease cohorts using
overlapped genes in the Toll-like receptor and chemokine signaling
pathways from KEGG. . . 63
2-8 Classification of cases vs. controls in different disease cohorts using
overlapped genes in the innate immunity pathways from KEGG. . . . 64
2-9 Independence of the 𝑝-value distributions of genes across selected GEO
series for ASD and its comorbidities. . . 66
3-1 Comparative functional metagenomics with Carnelian. . . 85
3-3 Classification of patients vs. controls using Enzyme Commission (EC) markers selected from the entire data set. . . 117
3-4 Classification of patients vs. controls in Crohn’s disease cohorts from
the US and Sweden using the combined set of EC markers. . . 119
3-5 Classification of patients vs. controls in Chinese and European type-2
diabetes (T2D) cohorts using the combined set of EC markers. . . 120
3-6 Functional diversity in the non-industrialized and industrialized
micro-biomes. . . 124
3-7 Principal component analysis (PCA) plots depicting Carnelian-derived
EC and pathway profiles of the microbiomes of non-industrialized and
industrialized communities. . . 124
3-8 Enzyme-level differences between the microbiomes of non-industrialized
and industrialized communities (selected individuals). . . 126
3-9 Enzyme-level separation of non-industrialized and industrialized
mi-crobiomes (all individuals). . . 127 3-10 Co-abundance association of core metabolic pathways across
industri-alized and non-industriindustri-alized microbiomes. . . 130
3-11 Functional diversity observed at different layers of the Vermont mine pit pond. . . 146 3-12 Non-metric multidimensional scaling (NMDS) plot depicting
Carnelian-derived functional profiles of the beach sand metagenomes from the DWH-spill data set. . . 147 3-13 Functional shifts predicted by Carnelian, mi-faser, HUMAnN2, and
Kraken2 from the Lindgreen et al. data set. . . 153
3-14 Comparison of Carnelian’s performance against mi-faser, HUMAnN2
and Kraken2 on our in-house synthetic data set. . . 156
3-15 Comparison of Carnelian’s performance against mi-faser, HUMAnN2
and Kraken2 on Carnelian’s curated EC database. . . 158
3-16 Example of low-density even coverage hashing representation of an amino acid 𝑘-mer. . . 171
List of Tables
2.1 Comorbidities of Autism Spectrum Disorders . . . 42
2.2 Differentially expressed genes selected under different FDR corrections
for ASD and its comorbidities. . . 43
2.3 KEGG pathways significantly shared between ASD and its comorbid
diseases. . . 46
2.4 BioCarta pathways significantly shared among ASD and its
comorbidi-ties. . . 52
2.5 Top five Reactome pathways significantly shared among ASD and its
comorbidities. . . 53
2.6 PID pathways significantly shared among ASD and its comorbidities. 54
2.7 Top 10 MSigDB canonical pathways significantly shared among ASD
and its comorbidities. . . 55
2.8 KEGG pathways significantly shared among ASD and its
non-immune-related comorbidities. . . 56
2.9 Differentially expressed genes in ASD and its comorbidities overlapping
with innate immunity pathways. . . 59
2.10 Independence of pathway 𝑝-values in ASD and its comorbidities. . . . 68
3.1 Shared functional dysbiosis between geographically separated cohorts
of type-2 diabetes (T2D) and Crohn’s disease (CD). . . 88
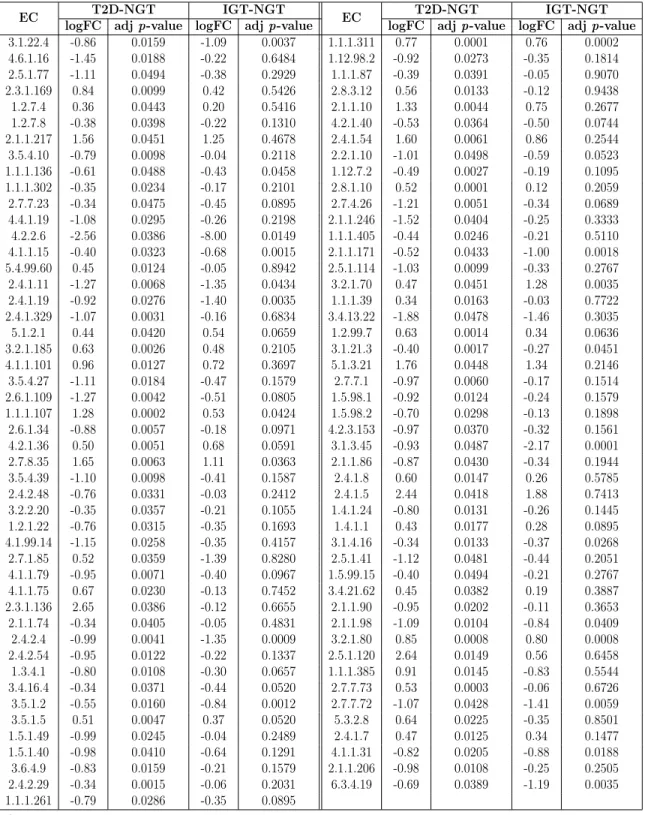
3.3 Significant differentially abundant ECs identified by Carnelian in the
T2D-Karlsson data set. . . 92
3.4 Pathways identified as significantly variable between T2D patients and
healthy controls in the T2D-Qin data set using Carnelian-generated functional profiles. . . 93
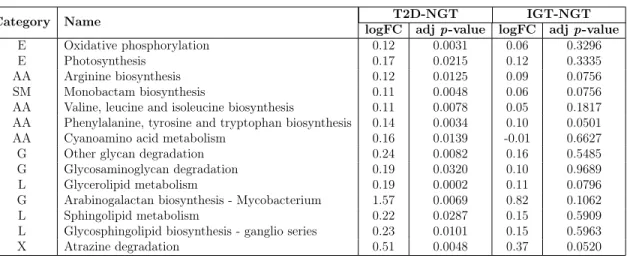
3.5 Pathways identified as significantly variable between T2D patients and
normal glucose tolerance (NGT) individuals in the T2D-Karlsson data
set using Carnelian-generated functional profiles. . . 94
3.6 Significant differentially abundant ECs identified by mi-faser in the
T2D-Qin data set. . . 95
3.7 Significant differentially abundant ECs identified by HUMAnN2 in the
T2D-Qin data set. . . 96
3.8 Significant differentially abundant ECs identified by Kraken2 in the
T2D-Qin data set. . . 97
3.9 Significant differentially abundant ECs identified by mi-faser in the
T2D-Karlsson data set. . . 98
3.10 Significant differentially abundant ECs identified by HUMAnN2 in the
T2D-Karlsson data set. . . 99
3.11 Significant differentially abundant ECs identified by Kraken2 in the T2D-Karlsson data set. . . 100 3.12 Pathways identified as significantly variable between T2D patients and
healthy controls in the T2D-Qin data set using mi-faser-generated func-tional profiles. . . 101 3.13 Pathways identified as significantly variable between T2D patients and
normal glucose tolerance (NGT) individuals in the T2D-Karlsson data set using mi-faser-generated functional profiles. . . 102 3.14 Pathways identified as significantly variable between T2D patients and
healthy controls in the T2D-Qin data set using functional profiles
3.15 Pathways identified as significantly variable between T2D patients and normal glucose tolerance (NGT) individuals in the T2D-Karlsson data
set using functional profiles generated by HUMAnN2. . . 103
3.16 Pathways identified as significantly variable between T2D patients and healthy controls in the T2D-Qin data set using functional profiles gen-erated by Kraken2. . . 103 3.17 Pathways identified as significantly variable between T2D patients and
normal glucose tolerance (NGT) individuals in the T2D-Karlsson data
set using functional profiles generated by Kraken2. . . 104
3.18 Significant differentially abundant ECs identified by Carnelian in the
CD-HMP data set. . . 105
3.19 Significant differentially abundant ECs identified by Carnelian in the CD-Swedish data set. . . 106 3.20 Pathways identified as significantly variable between CD patients and
healthy controls in the CD-HMP data set using Carnelian-generated functional profiles. . . 107 3.21 Pathways identified as significantly variable between CD patients and
healthy controls in the CD-Swedish data set using Carnelian-generated functional profiles. . . 108 3.22 Significant differentially abundant ECs identified by mi-faser in the
CD-HMP data set. . . 109
3.23 Significant differentially abundant ECs identified by mi-faser in the CD-Swedish data set. . . 109 3.24 Pathways identified as significantly variable between CD patients and
healthy controls in the CD-HMP data set using mi-faser-generated functional profiles. . . 110 3.25 Pathways identified as significantly variable between CD patients and
3.26 Significant differentially abundant ECs identified by HUMAnN2 in the
CD-HMP data set. . . 111
3.27 Significant differentially abundant ECs identified by HUMAnN2 in the CD-Swedish data set. . . 111
3.28 Pathways identified as significantly variable between CD patients and healthy controls in the CD-HMP data set using HUMAnN2-generated functional profiles. . . 112
3.29 Pathways identified as significantly variable between CD patients and healthy controls in the CD-Swedish data set using HUMAnN2-generated functional profiles. . . 112
3.30 Significant differentially abundant ECs identified by Kraken2 in the
CD-HMP data set. . . 113
3.31 Significant differentially abundant ECs identified by Kraken2 in the CD-Swedish data set. . . 113
3.32 Pathways identified as significantly variable between CD patients and healthy controls in the CD-HMP data set using Kraken2-generated functional profiles. . . 114
3.33 Pathways identified as significantly variable between CD patients and healthy controls in the CD-Swedish data set using Kraken2-generated functional profiles. . . 114
3.34 Combined EC markers identified by Carnelian that can classify T2D patients vs. controls in both Chinese and European population with
∼80% area under the curve on average. . . 121
3.35 Combined EC markers identified by Carnelian that can classify CD patients vs. controls in both the US and Swedish population with
∼94% area under the curve on average. . . 121
3.36 Performance of Carnelian, mi-faser, HUMAnN2, and Kraken2 on
3.37 Weights of top EC terms in the first nine principal components which cumulatively explain ∼80% variance in the principal component anal-ysis of the EC profiles of the industrialized and non-industrialized mi-crobiomes. . . 125 3.38 Top 100 significant ECs identified by Carnelian in the industrialized
vs. non-industrialized communities as differentially abundant. . . 128
3.39 Pathways identified as significantly variable between the microbiomes of the industrialized vs. non-industrialized communities using Carnelian-generated functional profiles. . . 131 3.40 Significant differentially abundant ECs between Parkinson’s disease
(PD) patients and controls identified by Carnelian in the PD-Bedarf data set. . . 133 3.41 Significant differentially abundant ECs identified by mi-faser in the
PD-Bedarf data set. . . 134 3.42 Significant differentially abundant ECs identified by HUMAnN2
(trans-lated) in the PD-Bedarf data set. . . 135
3.43 Significant differentially abundant ECs identified by Kraken2 in the PD-Bedarf data set. . . 136 3.44 Pathways identified as significantly variable between PD patients and
healthy controls in the PD-Bedarf data set using Carnelian-generated functional profiles. . . 137 3.45 Pathways identified as significantly variable between PD patients and
healthy controls in the PD-Bedarf data set using mi-faser-generated functional profiles. . . 138 3.46 Pathways identified as significantly variable between PD patients and
healthy controls in the PD-Bedarf data set functional profiles generated
by HUMAnN2 (translated). . . 139
3.47 Pathways identified as significantly variable between PD patients and healthy controls in the PD-Bedarf data set functional profiles generated
3.48 Pathways identified as significantly variable between PD patients and healthy controls in the PD-Bedarf data set functional profiles generated by out-of-the-box HUMAnN2 using ChocoPhlAn, Uniref, and MetaCyc databases. . . 141 3.49 Kendall rank correlation between the functional profiles of VAG-pond
samples generated by Carnelian. . . 143
3.50 Highly variable ECs between the epilimnion, metalimnion, and
hy-polimnion layers found by Carnelian in the VAG-pond data set. . . . 144
3.51 Highly variable pathways between the epilimnion, metalimnion, and
hypolimnion layers found by Carnelian in the VAG-pond data set. . . 145
3.52 Hydrocarbon-degrading ECs involved in BTEX metabolism pathways found enriched in the oil phase compared to the pre-oil phase in the
DWH-spill data set by Carnelian. . . 147
3.53 Highly variable hydrocarbon metabolism pathways found by Carnelian in the DWH-spill data set. . . 149 3.54 Composition of the synthetic gut metagenome used for the task of
functional capacity inference. . . 151 3.55 Performance of Carnelian and other tools in functional capacity
infer-ence from the synthetic gut metagenome data. . . 152
3.56 Composition of the data set used for the task of functional change inference. . . 154 3.57 Performance of Carnelian and other tools in functional change inference
from the two-set complex metagenomes. . . 155
3.58 Comparison of Carnelian’s performance against mi-faser, HUMAnN2, and Kraken2 on fragments of different lengths with 3% mutations using
Carnelian’s curated EC database. . . 159
3.59 Runtime and memory requirement of Carnelian compared to mi-faser, HUMAnN2, and Kraken2 when the size of input data remains fixed but read length is varied. . . 163
3.60 Runtime and memory requirement of Carnelian compared to mi-faser, HUMAnN2, and Kraken2 when read length remains fixed but the size of input data varies. . . 164 3.61 Performance of Carnelian with reduced-size amino acid alphabets on
our cross-validation test set containing ∼3M 100 bp fragments. . . 164
A.1 Selected GEO series for ASD and its comorbidities. . . 184
B.1 Performance comparison of off-the-shelf HUMAnN2 with HUMAnN2
Chapter 1
Introduction
Recent advances in next-generation sequencing (NGS) technologies have
revolution-ized research in life sciences. The cost-effective and high throughput nature of
these technologies has enabled us to study biological systems in unprecedented de-tail, generating massive amounts of genomic, transcriptomic, proteomic, epigenomic, metabolomic, and metagenomic data. Each type of omics data on its own typically provides some (associative) evidence of how a particular “ome” (e.g., genome, tran-scriptome, proteome, metabolome, or metagenome) contributes to a particular pheno-type (e.g., disease); but by integrating across omics data, we can identify true causal relationships. However, integrating and interpreting omics data from a functional per-spective faces challenges due to its high dimensionality and heterogeneity, the increas-ing diversity of experimental techniques, the noise in high-throughput measurements, and the nature of the underlying biology [1, 2]. These challenges require intelligent and scalable analytic frameworks. This thesis focuses on designing computational frameworks that (i) integrate heterogeneous omics data at different functional levels to reveal insights about groups of complex diseases which arise together [3], and (ii) enable a comparative functional analysis of large-scale metagenomic data from diverse
1.1
Types of omics data
The word “omics” when applied to a molecular term implies a comprehensive assess-ment of a set of molecules (http://omics.org/). The goal of omics studies is to understand the relationship between the genome and the functioning of cells. To this end, scientists investigate different molecules that play vital roles in the central dogma of life, namely DNA, RNA, and protein. DNA is transcribed into messenger RNA (mRNA) which is translated by the ribosome into polypeptide chains (i.e., sequences of amino acids) which singly or in complexes are known as proteins. Proteins fold into low-energy structures which function as cellular machines. Certain types of RNAs also function as cellular machines. Since proteins are dynamic and interacting molecules, taking proteomic measurements is often challenging. Furthermore, proteins undergo many post-translational modifications, and cannot be readily amplified; therefore, characterizing them is difficult at best [6]. Fortunately, by measuring transcripts of mRNA—the intermediate step between genes and proteins—we can bridge the gap between the genetic code and the functional molecules that run cellular machinery.
In multicellular organisms, nearly every cell has the same genome, thus the same genes. However, there is a wide range of physical, biochemical, and developmen-tal differences observed among various cells and tissues. The expression patterns of genes and the production of specific proteins determine these differences. Many chem-ical compounds and proteins can attach to DNA and direct such actions as turning genes on or off or controlling the expression of transcripts, and thereby the produc-tion of proteins in particular cells. These compounds are collectively known as the epigenome. Moreover, small molecules that are substrates or products of metabolism constitute the metabolome—measurements of which can elucidate the underlying bio-chemical activity and state of cells or tissues. Environmental factors also play a role in influencing the biochemical processes in cells often through various microorganisms (e.g., virus, bacteria, fungi) that inhabit the host’s body (i.e., the microbiome), poten-tially giving rise to different phenotypes in the host. Recent advances in experimental techniques have allowed us to build assays to deeply investigate every level of this
process, resulting in a massive influx of different types of omics data (Box 1.1; [7]).
Box 1.1. Omics Data Types
Genomics is the study of an organism’s linear DNA sequence i.e., the genome and its vari-ants, and how these variants associate with diseases, response to treatment, or future patient prognosis. Associated technologies include genotype arrays [8, 9], next-generation sequencing (NGS) for whole genome sequencing [10], and whole exome sequencing (WES) [11].
Proteomics is the study of the proteins in a cell or tissue, their quantity, diversity, and inter-actions. Mass spectrometry (MS) based approaches [12, 13] are commonly used to investigate the proteome.
Transcriptomics focuses on the study of RNA levels genome-wide, both qualitatively (which transcripts are present, identification of splice sites, RNA editing sites, etc.) and quantita-tively (how much of each transcript is expressed). Associated technologies include probe-based arrays [14] and RNA-Seq [15].
Epigenomics is the study of the epigenome which consists of chemical compounds and proteins that can attach to DNA and direct such actions as turning genes on or off or controlling the expression of transcripts and thereby the production of proteins in particular cells. Such data often comes from the genome-wide characterization of reversible modifications of DNA or DNA-associated proteins, such as DNA methylation or histone acetylation [16].
Metabolomics is the large-scale study of metabolites (small molecules that are substrates or products of metabolism, such as amino acids, fatty acids, carbohydrates, etc.) and their interactions within a biological system that elucidates the underlying biochemical activity and state of cells or tissues. MS-based approaches are often used to quantify both relative and targeted small molecule abundances [17].
Metagenomics is the study of the metagenome, i.e., the collection of genetic material from all the microorganisms in a given environment, including bacteria, viruses, and fungi, collec-tively known as the microbiome. Associated technologies include NGS for 16S ribosomal RNA abundance and whole genome metagenomics quantification [18, 19].
1.2
Challenges in functional interpretation of omics
data
Tremendous amounts of omics data have been generated over the past few decades and made available through public repositories such as Sequence Read Archive (SRA) and Gene Expression Omnibus (GEO) at the National Center for Biotechnology In-formation (NCBI), European Nucleotide Archive (ENA) and ArrayExpress at the European Bioinformatics Institute (EBI), DNA Data Bank of Japan (DDBJ), Joint Genome Institute (JGI), etc. The goal of functional interpretation of such data is to determine how the individual components (i.e., “omes”) work together to produce a particular phenotype (e.g., disease). Naturally, a systems-level understanding of any phenotype requires looking at multiple omics levels in a large number of samples simultaneously in an integrated fashion [1, 20, 21]. However, at present, there is a significant lag in our ability to generate versus integrate and interpret omics data.
Since a single omics study often contains a small number of samples and has limited statistical power, combining information across multiple studies is an intu-itive way to increase sensitivity. However, integrating and interpreting omics data across multiple studies face various biological and technical challenges, leading to the possibility of missing potentially valuable insights. These challenges include: (i) in-consistent nomenclature across different databases (e.g. gene, transcript, or protein identifiers), (ii) data generated by different platforms using different protocols (e.g. different array or next-generation sequencing (NGS) platforms, differences in sample preparation, processing pipelines, or study design), (iii) tissue heterogeneity (i.e., data generated from samples from different tissues), (iv) batch effect (i.e., technical dif-ferences in sample handling between batches of experiments), (v) size of data versus computational power and storage capacity, etc. All these contribute to the existing shortage of effective and robust frameworks to integrate and analyze omics data across different cell types, tissues, developmental phases, studies, and populations.
Furthermore, when it comes to metagenomic data, these challenges present them-selves on a much larger scale. Shotgun sequencing, which has revolutionized
metage-nomics, presents many additional unique challenges [22]. First, the sheer size of shotgun metagenomic read data sets—which is typically much larger than data from individual genomes, targeted amplicon sequencing of marker genes from microbial communities (e.g., 16S ribosomal RNA), or other meta’omic experiments (e.g., meta-proteomics, meta-metabolomics, etc.)—poses significant computational challenges [22, 23]. Secondly, shotgun reads often come from a mixture of genomes where the genome from which each read comes is unknown and so is the position of the read within the genome. Moreover, the vast majority of the microbial diversity is not represented in any reference database or otherwise characterized in most environments [24–26]. Even for species with sequenced genomes, reference databases do not capture the full col-lection of genes and functions present across different strains [27–29]. Aside from the reads that cannot be assigned to a taxon or gene or function, it is challenging to gen-erate comparable estimates of abundance from the remaining reads due to a variety of biological and technical biases related to study design, experimental protocols, and bioinformatics pipelines that affect the relationship between true abundance in the community and the number of reads observed for a taxonomic or functional category. These challenges not only complicate answering the question: which taxa and func-tions are present in a microbial sample, but also interfere with a useful comparison of metagenomic profiles across samples, either within a study or across studies.
1.3
Prior work on these challenges
1.3.1
Study of groups of diseases in the literature
Although different diseases may appear unrelated at an organismal level, it is highly unlikely that they arise completely independently from one another. They often share molecular components so that perturbations causing disease in one organ system can affect another [30, 31]. In neuropsychiatry, where many disorders do not have clear boundaries in terms of their pathophysiology or diagnosis [32, 33], researchers have
ants ranging from chromosomal abnormalities and copy number variations (CNV) to single nucleotide variations (SNV) have implications for autism spectrum disorder (ASD) and other neuropsychiatric conditions [34–41]. For example, single nucleotide polymorphisms (SNPs), which overlap genes in common molecular pathways, such as calcium channel signaling, are shared between ASD, attention deficit-hyperactivity disorder (ADHD), bipolar disorder (BD), major depressive disorder (MDD), and schizophrenia [42]. Other investigators have integrated genomic data for multiple immune-related diseases, revealing that there are shared molecular commonalities between them [43]. These efforts have mainly focused on developing multinomial models and statistical approaches for integrating genomic and genotype data from multiple genome-wide association studies so that researchers can detect rare variants with increased statistical power. However, efforts looking at groups of diseases have so far remained confined to a single type of omics data, diseases of the same organ system or diseases with a common theme (e.g., immune-related diseases, psychiatric diseases) to avoid dealing with the underlying heterogeneity. Recent studies based on electronic health records and database/literature mining have identified various groups of co-occurring diseases [44–48]. For example, researchers have identified sev-eral diseases spanning multiple organ systems that co-occur in ASD patients at a high prevalence rate [44, 45]. These diseases include seizures [49, 50], gastrointestinal disorders [51, 52], ear infections and auditory disorders, sleep disorders [53], muscular dystrophy [54–56], cardiac disorders, psychiatric illnesses [57, 58], etc. Thus, for un-derstanding the molecular basis of a disease like ASD with a complex etiology, there is a need to expand the omics exploration outside of one level and one organ system, in particular, the brain to conditions related to other organ systems that co-occur with it.
1.3.2
Functional profiling of metagenomic reads and
compar-ative functional metagenomics
Functional profiling of metagenomic reads refers to the task of assigning reads to known biological functions (e.g., catalytic action, functional domain categories, genes) and estimating abundances of those functional terms. Traditional whole metagenome functional annotation approaches assemble reads into large contigs, translate them into open reading frames (ORF), and annotate them using protein sequence homol-ogy, often using existing alignment tools such as BLAST [59], profile Hidden Markov Models (HMMs), or position-specific weight matrices (PWMs). Such methods include RAST [60], Megan4 [61], MEDUSA [62], Tentacle [63], MOCat2 [64], IMG4 [65], and gene catalogue-based methods [66, 67]. Since assembly is a slow, resource-heavy, and lossy process, annotating translated reads directly via sequence homology or read-mapping is used by another class of tools, including MG-RAST [68], HUMAnN [69], ShotMap [70], Fun4Me [71], mi-faser [72], and HUMAnN2 [73]. However, alignment-based read mapping remains time-consuming when comparing hundreds of samples from different cohorts [74, 75]. HUMAnN2 and mi-faser significantly speed up the alignment step by using a fast protein aligner, DIAMOND [76], and thus can accu-rately and quickly capture functions from sequences corresponding to known proteins. However, because they often use strict alignment criteria, they are challenged in cap-turing shared features of functionally similar proteins that are not-so-sequence-similar, multi-domain proteins, and remote homologs [77].
Naturally, predicting function without having characterized a protein experimen-tally is difficult and runs the risk of false positives. For well-studied populations and environments, there might not be a need to do so. However, when analyzing data from less studied populations and environments—so often the case in metagenomic analysis, a large fraction of reads sequenced do not directly correspond to genes of known species [25, 26]. Thus methods that depend on alignment do not perform as well. Techniques from the field of remote homology detection can be used to explicitly
operate at the level of entire protein sequences, rather than Whole Metagenome Shot-gun (WMS) sequencing reads. Hence, functional profiling of metagenomic sequences remains an open problem in metagenomics research [22, 23, 70, 78].
The real power of metagenomic analysis lies in performing comparisons between samples, within a study, or across multiple studies spanning different populations and environments. Detecting differential changes in the functional capacities of mi-crobial communities often requires larger sample sizes than are feasible within a single study. Hence, meta-analyses and comparisons of new and existing cohorts are increas-ingly becoming popular [67, 79–84]. These efforts have primarily sought to uncover shared taxonomic dysbiosis (i.e., microbial imbalance) between study populations for a given disease. However, these attempts have generally not found shared taxonomic dysbiosis, probably because the healthy microbiomes used as the background differ significantly in taxonomic composition, to begin with. Because different species may fill the same ecological niche, the traditional focus on taxonomy can lose sight of the functional relatedness of the microbiomes of two individuals—i.e., commonalities and differences in the functional capabilities of microbial populations [25]. In the large meta-analyses cited above [67, 79–84], there was some attempt to perform functional profiling (in addition to taxonomic profiling), but due to limitations in the study de-sign and methods available, they were unable to find concordant pathways, which one would expect from the same disease. Thus, better functional profiling is important to uncovering trends in functional relatedness when comparing study cohorts; this remains an unsolved challenge due to inconsistencies and incompleteness of annota-tions of microbial genes across reference databases and the lack of comparability of existing relative abundance statistics across samples and studies [23, 78].
1.4
Outline
The remainder of this thesis is organized as two self-contained chapters, parts of which have been previously published and parts, currently under review at a reputed peer-reviewed journal, as well as some concluding remarks.
Chapter 2: Multi-level integrative omics analysis for ASD and
its comorbidities
Over the years, ASD has baffled researchers not only with its heterogeneity but also its co-occurrence with many seemingly unrelated diseases of different organ systems (known as comorbidities of ASD). In this chapter, we introduce a three-tiered, sta-tistically robust, meta-analysis approach [3] to capture the shared signals at gene and pathway levels that form the basis of ASD’s co-occurrence with other diseases. Integrating heterogeneous transcriptomic data from 53 studies of 12 different diseases at the gene, pathway, and disease levels, our pipeline reveals a novel innate immunity connection between ASD and its comorbidities. Our statistical approach bridges the gap between frequentist and Bayesian statistics. An analysis of this scale for studying ASD and its comorbidities is unheard of as per our knowledge.
Chapter 3: Robust comparative functional metagenomics across
diverse study populations
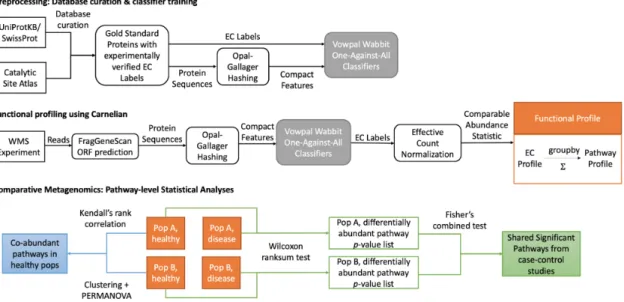
In this chapter, we introduce Carnelian, a novel compositional tool for profiling the metabolic functional potential of a metagenome from whole metagenome sequencing reads, and an end-to-end pipeline that is uniquely suited to finding common functional trends while comparing metagenomic data sets from different study populations [4,5]. Functionally similar proteins often share compositional (gapped 𝑘-mer) features in their amino acid sequence, even across species. Carnelian builds on this observa-tion and leverages low-density locality-sensitive hashing [85, 86] with a gapped 𝑘-mer classifier [87], which is better able to detect the ECs (Enzyme Commission terms that classify proteins by their enzymatic action) present in non-annotated species, while simultaneously avoiding forced spurious labels through training on a negative set. When used with our in-house comprehensive reference protein database focused on comparing metabolic functionality, as opposed to using typical protein databases that contain non-prokaryotic and non-metabolic annotations, and a new read
nor-metabolic functional capacities that are readily comparable across samples. Finally, we present a principled statistical approach for finding shared metabolic pathways using Carnelian-generated functional profiles that enables the discovery of hidden functional trends across diverse study populations. On a variety of simulated and real datasets (both published and unpublished), we demonstrate Carnelian’s supe-rior performance in finding shared metabolic pathways, concordant functional dys-bioses, and distinguishing Enzyme Commission (EC) terms missed by state-of-the-art metagenomic functional profiling tools.
Chapter 4: Conclusion
Chapter 2
Multi-level integrative omics analysis
for ASD and its comorbidities
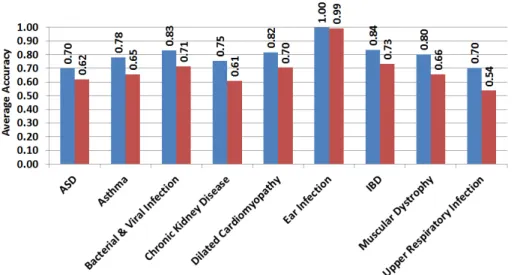
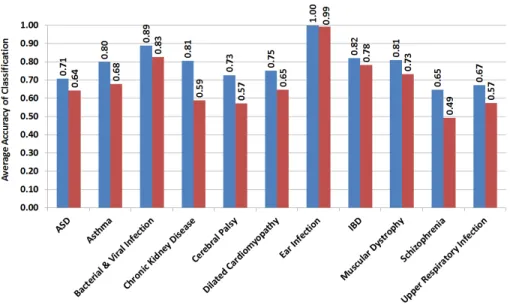
Autism spectrum disorder (ASD) is a common neurodevelopmental disorder that tends to co-occur with other diseases, including asthma, inflammatory bowel dis-ease, infections, cerebral palsy, dilated cardiomyopathy, muscular dystrophy, and schizophrenia. However, the molecular basis of this co-occurrence, and whether it is due to a shared component that influences both pathophysiology and environmen-tal triggering of illness, has not been elucidated. To address this, we introduce a three-tiered omics analysis pipeline [3] that functions at the gene, pathway, and dis-ease levels across ASD and its comorbidities. Our pipeline reveals a novel shared innate immune component between ASD and all but three of its comorbidities that were examined. In particular, we find that the Toll-like receptor signaling and the chemokine signaling pathways, which are key pathways in the innate immune re-sponse, have the highest shared statistical significance. Moreover, the disease genes that overlap these two innate immunity pathways can be used to classify the cases of ASD and its comorbidities versus controls with at least 70% accuracy. This finding suggests that a neuropsychiatric condition and the majority of its non-brain-related comorbidities share a dysregulated signal that serves as not only a shared genetic basis for the diseases but also as a link to environmental triggers. It also raises the
be successfully used for ASD patients with immune-related phenotypes.
2.1
Introduction
While at an organismal level, two or more diseases may appear unrelated, at the molecular level, it is unlikely that they arise entirely independently of one another. Studies of the human interactome—the molecular network of physical interactions (e.g., protein-protein, gene, metabolic, regulatory) between biological entities in cells— demonstrate that gene function and regulation are integrated at the level of an organ-ism. Extensive patterns of shared co-occurrences also evidence molecular commonal-ities between seemingly disparate conditions [30].
Indeed, different disorders may share molecular components so that perturbations
causing disease in one organ system can affect another [31]. However, since the
phenotypes appear so different from each other, medical sub-disciplines address the conditions with sometimes wildly differing treatment protocols. If investigators can uncover the molecular links between seemingly different conditions, the connections may help explain why certain groups of diseases arise together and assist clinicians in their decision-making about the best treatments. Knowledge of shared molecular pathology might also provide therapeutic insights for the repositioning of existing drugs [88].
Such thinking has emerged most recently in the field of neuropsychiatry where, many such illnesses do not have clear boundaries in terms of their pathophysiol-ogy or diagnosis [32, 33]. Indeed, there is now growing evidence that rare variants ranging from chromosomal abnormalities and copy number variation (CNV) to single nucleotide variation (SNV) have implications in ASD and other neuropsychiatric con-ditions [34–41]. For example, single nucleotide polymorphisms (SNP) which overlap genes in common molecular pathways, such as calcium channel signaling, are shared in autism spectrum disorder (ASD), attention deficit-hyperactivity disorder (ADHD), bipolar disorder (BD), major depressive disorder (MDD), and schizophrenia [42]. CNVs, especially the rare ones, can explain a portion of the risk for multiple
psy-chiatric disorders [38, 41]. For example, the 16𝑝11.2 CNV encompassing around 600 kb (chr 16:29.5 - 30.2 Mb) has been implicated in multiple psychiatric disorders with the deletions being associated with ASD, developmental delay and intellectual dis-ability (ID) and duplications being associated with ASD, schizophrenia, BD, and ID [38, 41, 89–93]. However, researchers have observed pathogenic variations in only about 30% of the ASD affected individuals [40, 94–97] and these variations often fail to explain the idiopathic (non-syndromic) ASD cases as well as why ASD affected individuals suffer from many other non-neuropsychiatric conditions.
To complement the evidence of genome-wide pleiotropy across neuropsychiatric diseases, rather than looking at one neurodevelopmental disease (ASD) and compar-ing it to other seemcompar-ingly, brain-related diseases, we expand our exploration outside of the brain to conditions related to other organ systems that co-occur with ASD. Recent studies based on electronic health records [44, 45], have identified various co-morbidities in ASD, including seizures [49, 50], gastrointestinal disorders [51, 52], ear infections and auditory disorders, developmental disorders, sleep disorders [53], mus-cular dystrophy [54–56], cardiac disorders and psychiatric illness [57, 58]. We intro-duce an integrative meta-analysis pipeline to identify the shared pathophysiological component between ASD and eleven other diseases, namely, asthma, bacterial and viral infection, chronic kidney disease, cerebral palsy, dilated cardiomyopathy, ear in-fection, epilepsy, inflammatory bowel disease, muscular dystrophy, schizophrenia, and upper respiratory infection, that have at least 5% prevalence in ASD patients [44,45]. We ask the question, “Do these disease states - that are not included in the defini-tion of ASD but co-occur at a significantly high frequency – illuminate dysregulated pathways that are important in ASD?” We reasoned that such pathways might offer previously hidden clues to shared molecular pathology.
Other investigators have integrated genomic data from genome-wide association studies (GWAS) and non-synonymous SNP studies for multiple immune-related dis-eases, revealing that combining genetic results better identified shared molecular com-monalities [43]. We believe that adopting an integrative approach not only at the gene
still further.
In our three-tiered, meta-analysis approach, we: (i) look for statistically significant differentially expressed genes in every disease condition; (ii) identify their enrichment in canonical pathways; and (iii) determine the statistical significance of the shared pathways across multiple conditions. We are unaware of any analyses that go from population-based comorbidity clusters of ASD to a multi-level molecular analysis at anywhere near this breadth.
Our results unearth several innate immunity-related pathways - specifically, the Toll-like receptor and chemokine signaling pathways - as significant players in ASD and all but three of its examined comorbidities. Candidate genes in these two path-ways significantly overlap in conditions of ASD, asthma, bacterial and viral infection, chronic kidney disease, dilated cardiomyopathy, ear infection, inflammatory bowel disease (IBD), muscular dystrophy, and upper respiratory infection. Candidate genes did not appear to be significantly shared in cerebral palsy, epilepsy, and schizophre-nia. Notably, although bacterial and viral infection, respiratory infection, ear in-fection, IBD, and asthma have well-known connections with the immune system, we demonstrate that innate immunity pathways are shared by ASD and its comorbidities irrespective of whether they are immunity-related diseases or not.
Since both Toll-like receptor signaling and chemokine signaling pathways play crucial roles in innate immunity, the results suggest that this first-line defense system (that protects the host from infection by pathogens/environmental triggers) might be involved in ASD and specific comorbidities. If the profiles of genetic susceptibility pathways in relation to environmental triggers can be ascertained, they might help define new treatments such as vaccination [98] or other tolerization therapies [99]. Those might help individuals and families that are at high-risk for ASD to prevent and treat immune-related phenotypes of the illness.
2.2
Results
2.2.1
Overview of the three-tiered integrative omics pipeline
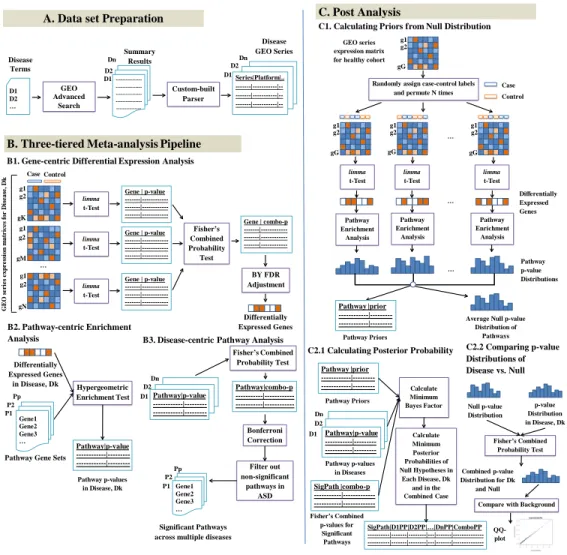
To integrate and interpret heterogeneous transcriptomic data across ASD and eleven of its comorbidities (Table 2.1) at gene and pathway levels, we introduce a novel three-tiered meta-analysis pipeline (Figure 2-1). Our meta-analysis starts at the gene level, in which we first identified the genes that are differentially expressed among cases and controls for a given disease. We then extend this analysis to the pathway level, where we investigate the pathways that are significantly enriched in candidate genes for a given disease. Finally, we identify the pathways that are significant across multiple diseases by newly combining pathway-level results across diseases and performing Bayesian posterior probability analysis of null hypotheses for pathways in each disease as well as in the combined case (Methods).Using our pipeline, we examined ASD and eleven of its most common comorbidi-ties (Table 2.1). Differential analysis of transcriptomic data using Empirical Bayes method [118] from 53 microarray studies (Appendix A: Table A.1) related to the twelve disease conditions revealed different numbers of genes that show significant differential changes in expression per disease depending on different false discovery rate (FDR) corrections (Table 2.2; https://tinyurl.com/GenePValues). We se-lected the most informative FDR correction test by looking at the accuracy of the classification of cases vs. controls for each disease using the significant genes selected under different FDR corrections. We found the Benjamini-Yekutieli (BY) adjustment as the most informative and accurate—classification accuracy being at least 63% per disease using the genes selected under BY adjustment as features for support vector machine (SVM) classifier (Figure 2-2).
Hypergeometric enrichment analysis on individual pathway gene sets from Kyoto encyclopedia of genes and genomes (KEGG), BioCarta, Reactome, and pathway inter-action database (PID) collections, as well as on the combined gene set of all canonical pathways helped us reveal the significantly dysregulated pathways in each of the
dis-A. Data set Preparation Summary Results Dn Dn D2 D1 D1 D2 … GEO Advanced Search Disease Terms --- Custom-built Parser D2 D1 Disease GEO Series Series|Platform|.. ---|---|---|---|-- P1 Pp Dn D2 D1 gN g2 g1 gM g2 g1 gK g2 g1 …
B. Three-tiered Meta-analysis Pipeline
B1. Gene-centric Differential Expression Analysis
Case Control limma t-Test limma t-Test limma t-Test Gene | p-value ---|---Fisher’s Combined Probability Test Gene | combo-p ---|---BY FDR Adjustment Differentially Expressed Genes G E O s e r ie s e x p r e ss io n m a tr ic e s f o r D is e a se , D k B2. Pathway-centric Enrichment Analysis Differentially Expressed Genes in Disease, Dk Pathway|p-value ---|---| Hypergeometric Enrichment Test
Pathway Gene Sets
B3. Disease-centric Pathway Analysis
Pathway|p-value ---|---Fisher’s Combined Probability Test Pathway|combo-p ---|---| Filter out non-significant pathways in ASD Significant Pathways across multiple diseases
P1 P2 Pp Gene1 Gene2 Gene3 … Gene1 Gene2 Gene3 … P2 Gene | p-value ---|---Gene | p-value Bonferroni Correction Dn D2 C. Post Analysis
C1. Calculating Priors from Null Distribution
g2 g1 g2 g1 gG g2 g1 gG g2 g1 gG GEO series expression matrix for healthy cohort
Randomly assign case-control labels and permute N times
gG … limma t-Test limma t-Test limma t-Test Case Control Differentially Expressed Genes Pathway Enrichment Analysis Pathway Enrichment Analysis Pathway Enrichment Analysis … … Pathway p-value Distributions
Average Null p-value Distribution of Pathways Pathway |prior ---|---|
C2.1 Calculating Posterior Probability C2.2 Comparing p-value
Distributions of Disease vs. Null Pathway |prior ---|---| D1 Pathway|p-value ---|---SigPath |combo-p ---|---Fisher’s Combined p-values for Significant Pathways Pathway Priors Pathway p-values in Diseases Calculate Minimum Bayes Factor Calculate Minimum Posterior Probabilities of Null Hypotheses in Each Disease, Dk and in the Combined Case SigPath|D1PP|D2PP|…|DnPP|ComboPP Null p-value Distribution p-value Distribution in Disease, Dk Fisher’s Combined Probability Test
Compare with Background Combined p-value Distribution for Dk and Null QQ-plot Pathway Priors Pathway p-values in Disease, Dk
Figure 2-1: Three-tiered integrative omics pipeline. (A) Data preparation: select
GEO Series relevant to ASD and comorbid diseases. (B) Three tiers: 1. For each disease, select significant genes from differential expression analysis of GEO series with a Fisher’s combined test with 𝑝 < 0.05 after Benjamini-Yekutieli (BY) FDR adjustment. 2. For each disease, select significant pathways from hypergeometric enrichment analysis with 𝑝 < 0.05. 3. Identify significant shared pathways across diseases using Fisher’s combined test with 𝑝 < 0.05 after Bonferroni FDR correction. Exclude the non-significant pathways in ASD. (C) Post analysis: 1. Using the gene expression data from a healthy cohort, generate a null distribution of pathway 𝑝-values and calculate prior probabilities of pathways being signif-icant by chance. 2.1. Using the prior probabilities, pathway 𝑝- values in each disease, and the Fisher’s combined 𝑝-values of significant pathways across diseases, calculate minimum Bayes factors and minimum posterior probabilities of null hypotheses for each significant pathway in each disease as well as in the combined case. 2.2. Combine the pathway 𝑝-value distribution of each disease with the average null distribution of 𝑝-values using Fisher’s combined probability test and compare the combined 𝑝-value distribution with background chi-squared distribution using QQ-plot for significance. Identify the significant pathways, using the combined 𝑝-values, minimum posterior probabilities, and QQ-plots.
pathway across all the diseases using Fisher’s combined probability test [119] and cor-recting for multiple comparisons using Bonferroni correction, we measured the shared significance of pathways across ASD and its comorbidities. Any pathway that had a Bonferroni corrected 𝑝-value < 0.05, was termed as ‘significant’ and pathways that were not significant in ASD, were filtered out.
To confirm that the presence of multiple significant pathways among ASD and its comorbidities was due to shared biology, we estimated minimum Bayes factors (BF) and minimum posterior probabilities of the null hypothesis for each of the sig-nificant KEGG pathways in ASD and its comorbidities. The priors for the path-ways were estimated from the null distributions of 𝑝-values generated by differen-tial expression analysis and pathway analysis performed on permutations of gene
expression data of a healthy cohort (GEO Accession: GSE16028). For the
sig-nificant pathways shared between the diseases, the posterior probabilities of the 𝑝-values being significant by chance were always less than 5% (Table 2.3; https: //tinyurl.com/BayesianPosteriorAnalysis). The quantile-quantile (QQ) plot of combined 𝑝-values of pathways across ASD and its comorbidities show marked en-richment of significant 𝑝-values indicative of shared disease biology captured by the pathways tested (Figure 2-3(a)). The QQ-plots of hypergeometric 𝑝-values of path-ways in ASD and its comorbid diseases against theoretical quantiles also show sig-nificant enrichment (Figure 2-4). For contrast, we combined pathway 𝑝-values from each disease separately with the null 𝑝value distribution. When the pathway 𝑝-value distribution in a disease is combined with null 𝑝-value distribution, the QQ-plots do not show much deviation from the background distribution (Figure 2-5), indicating both that there is a lack of shared biology (as expected) and that our analysis does not cause a systematic inflation.
Table 2.1: Comorbidities of Autism Spectrum Disorders
Disease Group Clinical Manifestations References
Multi-system Disorders Asthma Becker, 2007 [100];
(Congenital Anomalies, Doshi-Velez, Ge,
Auditory Disorders, and Kohane, 2014 [45];
Infections, Gastro- Bacterial & Viral Infections Atladóttir et al., 2010 [101];
intestinal Disorders, Atladóttir et al., 2012 [102];
Cardiac Disorders etc.) Garbett et al., 2012 [103];
Hagberg, Gressens, and Mallard, 2012 [104];
Chronic Kidney Disease Curatolo et al., 2004 [105];
Loirat et al., 2010 [106]
Cerebral Palsy Surén et al., 2012 [107];
Doshi-Velez, Ge, and Kohane, 2014 [45];
Dilated Cardiomyopathy Witchel, Hancox,
and Nutt, 2003 [108]; Bilder et al., 2013 [109];
Ear Infection/Otitis Media Konstantareas and
Homatidis, 1987 [110]; Rosenhall et al., 1999 [111]; Porges et al., 2013 [112];
Inflammatory Bowel Disease Horvath et al., 1999 [51];
(Crohn’s Disease, Ulcerative Horvath and Perman, 2002 [52];
Colitis) Walker et al., 2013 [113]
Muscular Dystrophy Wu et al., 2005 [54];
Hendriksen and Vles, 2008 [55]; Hinton et al., 2009 [56];
Kohane et al., 2012 [44];
Upper Respiratory Infection Shavelle, Strauss,
and Pickett, 2001 [114]; Porges et al., 2013 [112]; Bilder et al., 2013 [109];
Seizures Epilepsy Mouridsen et al., 1999 [49];
Tuchman and Rapin, 2002 [50]; Surén et al., 2012 [107];
Bilder et al., 2013 [109];
Psychiatric Disorders Schizophrenia Morgan, Roy,
and Chance, 2003 [57]; Tabarés-Seisdedos
and Rubenstein, 2009 [115]; Ingason et al., 2011 [116]; Smoller et al., 2013 [42]; Murdoch and State, 2013 [117];
Table 2.2: Number of differentially expressed genes selected under different FDR corrections for ASD and its comorbidities with a significance cutoff of 𝑝-value < 0.05.
Disease Bonferroni BY BH None
ASD 157 1258 5104 9176
Asthma 238 852 2501 5555
Bacterial & Viral Infection 1613 3630 6016 8183
Chronic Kidney Disease 66 416 3771 12577
Cerebral Palsy 93 220 646 2352
Dilated Cardiomyopathy 146 349 908 3455
Ear Infection/Otitis Media 1629 3867 6708 6708
Epilepsy 5 4 12 2242
Inflammatory bowel Disease 831 2547 4771 6897
Muscular Dystrophy 207 517 1303 3885
Schizophrenia 54 149 508 2881
Upper Respiratory Infection 32 59 172 2664
* Here, BY = Benjamini-Yekutieli, BH = Benjamini-Hochberg, and None = No FDR
Figure 2-2: Accuracy of different classification methods for case-control group classification in ASD and its comorbid diseases using genes selected under different false discovery rate (FDR) corrections as features. (A) Naïve Bayes Classification, (B) Fisher’s Linear Discriminant Analysis, (C) k-Nearest Neighbor Classification, and (D) Support Vector Machine.
Figure 2-3: Quantile-quantile plots showing Fisher’s combined p-value dis-tributions of KEGG pathways across (a) ASD and all its comorbidities, and (b) ASD and its non-immune related comorbidities. Here, ASD = Autism Spectrum Disorder, CKD = Chronic Kidney Disease, CP = Cerebral Palsy, DC = Dilated Cardiomyopathy, MD = Muscular Dystrophy, and S = Schizophrenia.
T able 2.3: KEGG path w a ys significan tly shared b et w een ASD and its comorbid diseases. P ath w a y ASD Asthma INF CKD CP DC EI EP IBD MD S URI Fisher’s 𝑝 Bonferroni corrected 𝑝 Ba y es factor Minim um p osterior of n ull T oll-li k e Receptor Signaling 0.0048 5.52E-06 0.0762 0.0114 0.6550 0.0034 4.28E-16 1 5.93E-05 0.0210 1 1.14E-10 1.1745E-32 1.703E-30 8.78E-31 9.76E-32 Chemokine Signaling 0.0145 0.0003 0.000051 0.2197 0.8628 0.0194 3.21E-10 1 1.37E-06 0.5703 1 8.89E-09 7.0449E-26 1.022E-21 4.01E-22 1.07E-22 NOD-lik e Receptor Signaling 0.0342 9.02E-05 0.0136 0.0019 0.4760 0.0019 1.99E-08 1 0.0036 0.7335 1 9.04E-05 1.7813E-17 2.583E-15 7.75E-16 3.23E-17 Rib osome 6.49E-13 0.9647 4.84E-10 0.1720 0.6006 1 0.9841 1 0.9460 0.0026 1 1 3.68E-17 5.336E-15 1.68E-15 3.69E-16 Spliceosome 6.70E-05 0.9541 6.39E-06 0.2965 0.3831 0.2746 0.9201 1 1.36E-05 0.5081 0.1721 1 9.9149E-09 1.438E-06 2.38E-07 5.23E-08 Leuk o cyte T rans-endothelial Migration 0.0023 0.8201 0.0110 0.0797 0.0002 0.8164 0.0974 1 0.1238 7.63E-06 0.5000 1 9.962E-09 1.445E-06 2.40E-07 6.76E-08 Regulation of A ctin Cyto- skeleton 0.0234 0.9080 0.2734 0.1131 0.0745 0.0355 0.2280 1 0.2032 5.90E-05 0.1330 1 2.7324E-05 0.003962 0.0004 0.0007 Tigh t Junction 0.0359 0.5613 0.4111 0.1064 0.0005 0.8542 0.3039 1 0.1900 0.0006 1 1 6.9114E-05 0.010022 0.0010 0.0004 Note: En tries in dicating significan t 𝑝 -v alues are colored in red. The en tries with v alue ‘1’ indicate the case wh er e there w as no o v erlap b et w een the path w a y and the disease gene se t. Here, ASD = Autism Sp ectrum Disorder, INF = Bacterial & Viral Infection, CKD = Ch ro n ic Kidney Disease, CP = Cerebral P alsy , DC = Dilated Cardiom y opath y, EI = Ear Infection, EP = Epilepsy , IBD = Inflammatory Bo w el Disease, MD = Muscular Dystroph y, S = Sc hizophrenia, URI = Upp er Respiratory Infection.
2-4: Quan tile-quan tile plots comparing the distribution of p -v alue s of path w a ys in eac h of ASD a nd its comorbidities theoretical quan tiles. The plots a re in log-scale. (A) ASD, (B) Asthma, (C) Bacterial and viral infe ction, (D) Chronic kidney (E) Cerebral P alsy , (F) D ilated Cardiom y opath y , (G) Ear inf ection, (H) IBD, (I) Mu scular Dystroph y , (J) Sc hizophrenia, and Upp er R espiratory Infecti on.
Figure 2-5: Quan tile-quan tile plots sho wing the distribution of com bined 𝑝 -v a lu es from eac h disease with the sim ulated bac kground 𝑝 -v a lue distribu t ion of path w a ys. The plots are in log-scale. The com bined 𝑝 -v alues are compared with the theoretical quan tiles dra wn fr om appropriate chi-square distributio ns, and th e n ull distribution is compar ed with theoretical quan tiles from the standard normal distribution. The exp ected region is colored in gra y . (A) Com bined 𝑝 -v alues of path w a ys across all diseases (sho wn for comparison), (B) The sim ulated bac kground 𝑝 -v alue dist ribution of path w a ys whic h w e call the “n ull” 𝑝 -v alue di stribution, (C) ASD and n ull, (D) Asthma and n ull, (E)Bacterial and viral infec tion and n ull, (F) Chronic kidney disease a nd n ull, (G) Cerebr al palsy and n ull, (H) Dilated cardiom y opath y and n ull, (I) Ear infe ction and n ull, (J) IBD and n ull, (K) Muscular dystroph y and n ull, (L) Sc hiz ophrenia and n ull, and (M) Upp er respiratory infection and n ull.
2.2.2
Involvement of innate immunity pathways in ASD and
its comorbidities
Our results demonstrated that pathways that are dysregulated across ASD and its comorbidities with the highest statistical significance (i.e., the lowest Bonferroni-corrected combined 𝑝-value), are all related to innate immune system (Tables 2.3–2.7; full tables at https://tinyurl.com/PathPValues.). For the KEGG, BioCarta, and PID gene sets, the Toll-like receptor signaling pathway was found to be the most significant (Tables 2.3, 2.4 and 2.6). For the KEGG database, the top two signifi-cant pathways were Toll-like receptor signaling, and chemokine signaling (Table 2.3). The top three significant pathways, revealed from the analysis of Reactome data set, include chemokine receptor signaling, innate immunity, and Toll-like receptor signaling (Table 2.5). When we expanded our aperture of analysis to the gene sets from all canonical pathways, the Toll-like receptor signaling, and chemokine signaling pathways were still found to be the most significantly dysregulated in the disease con-ditions (Table 2.7). Thus, we primarily focused our attention on these two pathways in ASD and its comorbidities and then, for completeness, extended to other innate immunity KEGG pathways that were found significantly dysregulated (Table 2.3).
Both Toll-like receptor signaling and chemokine signaling pathways are vital path-ways in the innate immune response mechanism. Toll-like receptors are the most com-mon pattern recognition receptors that recognize distinct pathogen-associated molec-ular patterns and participate in the first line of defense against invading pathogens. They also play a significant role in inflammation, immune cell regulation, survival, and proliferation. Toll-like receptors activate various signal transduction pathways which in turn activates expression and synthesis of chemokines which together with cytokines, cell adhesion molecules, and immunoreceptors, orchestrate the early host response to infection and at the same time represent an essential link to the adaptive immune response [120]. Our study revealed that, the KEGG Toll-like receptor sig-naling pathway, by itself, was significantly dysregulated (with a combined 𝑝-value of
![Table 2.1: Comorbidities of Autism Spectrum Disorders Disease Group Clinical Manifestations References Multi-system Disorders Asthma Becker, 2007 [100];](https://thumb-eu.123doks.com/thumbv2/123doknet/14437532.516311/42.918.150.779.166.1054/comorbidities-spectrum-disorders-disease-clinical-manifestations-references-disorders.webp)