HAL Id: hal-00725837
https://hal.archives-ouvertes.fr/hal-00725837
Submitted on 30 Aug 2012
HAL is a multi-disciplinary open access
archive for the deposit and dissemination of
sci-entific research documents, whether they are
pub-lished or not. The documents may come from
teaching and research institutions in France or
abroad, or from public or private research centers.
L’archive ouverte pluridisciplinaire HAL, est
destinée au dépôt et à la diffusion de documents
scientifiques de niveau recherche, publiés ou non,
émanant des établissements d’enseignement et de
recherche français ou étrangers, des laboratoires
publics ou privés.
Uncertainty Analysis of the Conducted Interferences in
a DC-DC Converter
Moises Ferber de Vieira Lessa, Christian Vollaire, Laurent Krähenbühl, Joao
Vasconcelos
To cite this version:
Moises Ferber de Vieira Lessa, Christian Vollaire, Laurent Krähenbühl, Joao Vasconcelos. Uncertainty
Analysis of the Conducted Interferences in a DC-DC Converter. MOMAG, Aug 2012, João Pessoa,
Brazil. pp.CD. �hal-00725837�
Uncertainty Analysis of the Conducted
Interferences in a DC-DC Converter
M. Ferber, C. Vollaire, L. Krähenbühl
Ecole Centrale de Lyon
Laboratoire Ampère
Ecully, France
[email protected]
M.Ferber, J.A. Vasconcelos
Laboratorio de Computação Evolucionaria
Universidade Federal de Minas Gerais
Belo Horizonte, Brazil
Abstract - A new methodology to analyze systems in the time and frequency domain, containing large number of uncertain parameters, is presented. As an example, the conducted interferences of a DC-DC Converter with uncertainties in its component values is analyzed. The model has a large number of parameters, which are described by Probability Density Functions (PDF). The output considered is a standard measurement of conducted interferences and its PDF is rapidly determined, when compared to the Monte Carlo (MC) approach.
Keywords - Electromagnetic Compatibility, Monte Carlo, Parametric Uncertainty, Power Electronics, Probability Density Functions.
I. INTRODUCTION
The increased replacement of mechanical systems by electronic devices and the fast development of semiconductor technology in the last decades are the main reasons that brought power electronics into the vehicle industry, for instance airplanes and hybrid cars [1].
Even though electronic systems have many advantages over the mechanical ones, there are a few precautions to be considered. In this paper, we address the conducted interference of a DC-DC converter, which is one aspect of the EMC behavior.
Thus, our study starts by constructing a circuit model of the converter, with well-known component values, and analyzing this ideal representation. However, a more realistic approach is to take into account the uncertainty in the parameters, such as the values of the components, dimensions of the PCB tracks, position of the cables, ageing, etc.
The most common way to do so is to use the Monte Carlo (MC) technique [2], but a large number of simulations are required. This approach is thus unfeasible for models requiring minutes/hours to simulate. There are several other methodologies in the literature that require less simulations than MC in order to quantify the statistical moments (average, standard deviation, skewness, kurtosis, etc.) of a system and some of them have already been applied in EMC.
For instance, the Unscented Transform (UT) [3] was utilized in [4] and [5] to quantify the average and standard deviation of the dominant frequency of a cavity and the shielding effectiveness of cabinets respectively.
However, this methodology is not suitable for models with large number of uncertain parameters, once the required number of simulations increase rapidly with the dimension. There are other collocation-based methodologies that the number of required simulations increases only linearly with the number of dimensions.
For instance, a Stroud-based collocation method was applied to statistically characterize coupled voltages at the feed pins of cable-interconnected and shielded computer cards as well as the terminals of cables situated inside the bay of an airplane cockpit [6].
The previous methods allow computing the average and standard deviation of a system with parametric uncertainty, with relatively good accuracy, but the output probability density function remains unknown.
For many cases, the output PDF tends to a normal distribution, which is a result from the Central Limit theorem [7], and thus it is possible to estimate confidence intervals. However, for all other cases, the value of the standard deviation is not enough to construct lower and upper bounds for the output variable.
Thus, we propose here a methodology suitable for large problems in the frequency domain that shows very good agreement with MC. Moreover, it is suitable for any input PDF and provides great insight of the system behavior.
II. METHODOLOGY
The methodology consists basically of 4 steps and it may be applied to a general power converter represented by (1).
where Y is the FFT of the voltage across the 50Ω Line Impedance Stabilization Network (LISN) resistor; G is the circuit model and Xi is the i
th
parameter of the converter, and f is the frequency.
A - Output Reduction
The first step consists of selecting a set of frequencies in (1) that is still sufficient to correctly represent an upper bound for the conducted interferences. This set forms a vector of output variables Ỹ depicted in (2).
̃ (
) ( ),
(2)where Ỹ is a set of selected Y values and is the set of parameters. The relationship between each component of the output Y and the parameters no longer depends of the frequency, as shown in (3).
( ) ( ) (3) where ( )
B - Sensitivity Analysis
The second step attempts to identify important parameters of the system that is described by many variables, which correspond to a large in (3). Power converters often contain a subset of dominant parameters. This subset can reproduce the behavior of the system with a given accuracy and with less computational effort. Moreover, it is important to find out what kind of trend exists between the parameters and output variables, in the interval of uncertainty. Thus, the second step of the methodology is a sensitivity analysis to evaluate which parameters are actually essential and what simplified model should be used.
C - Model Reduction
Once the previous step is completed, the converter model with many parameters is reduced to (4).
̃( ̃), (4)
where ̃ is the kth simplified model and ̃ is the kth subset of parameters. Note that the dimension of ̃ and thus of ̃ may change with . For instance, the conducted interferences at 20kHz may depend of a certain subset of parameters while at 2MHz of a different subset.
D - Transformation of Random Variables
The last step is to deter ine the output PDF’s by the Method of Cumulative Distribution Function [8].
III. RESULTS
The power converter to be used here, as an example to test the present methodology, is a DC-DC Converter modeled in MATLAB Simulink® SimPowerSystemsTM. Figure 1 presents a simplified diagram of the converter.
Figure 1 – Simple Diagram of the DC-DC Converter There are 45 parameters in this model to describe its components and their parasitic effects. The diode and the MOSFET, for instance, are described by 5 and 6 parameters [9], respectively. This model is thus a realistic example of a nonlinear, time-variant power converter.
Figure 3 – FFT of the voltage
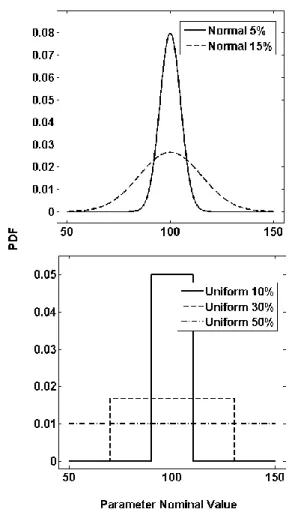
Moreover, a few different scenarios for the parametric uncertainty were explored: the parameters are assumed to have uniform distributions of 10%, 30% and 50% around their nominal values and truncated normal distributions with standard deviations of 5% and 15% of the average value, as shown in Figure 2. Nevertheless, one can model these parameters by any probability density function. The output variable is the FFT of the voltage in dB across the 50Ω resistor of the LISN. This is a standard easure ent of conducted interferences.
The output reduction step is illustrated in Figure 3, where the system interference considering the parameters with their average values (curve in blue) and the chosen reduced output set (circles in green) are shown. Note that in Figure 3, the points marked in green are a sufficient subset of the output to estimate an upper bound of conducted interferences.
The sensitivity analysis step is described as follows: there are 45 uncertain parameters in the model and 8 frequencies to analyze. That means one would need to consider 360 plots. This is obviously unreasonable and actually unnecessary. It is possible to reduce the number of parameters to analyze by taking advantage of the symmetry of the model and of natural trends.
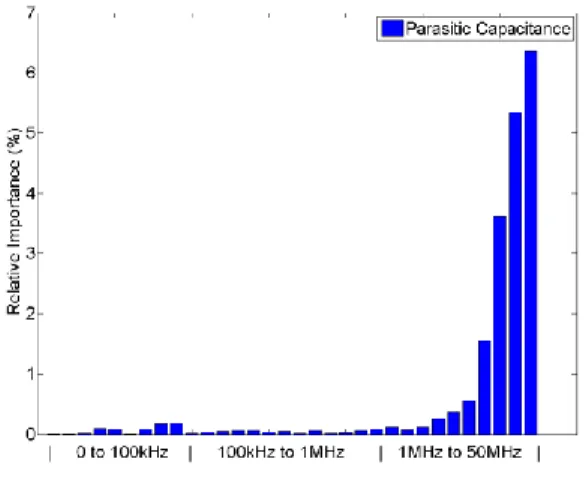
For instance, the parasitic capacitances will only appear in the model at high frequencies whereas the input voltage is important in the whole frequency range, as Figures 4 and 5 respectively presents their relative impact on the output.
The computation of the output PDF at 20kHz, for instance, leads to the results presented in Figure 7. The performance comparison to MC is presented in Table I.
Once having calculated the eight PDFs at the points marked in green in Figure 3, we can easily obtain a confidence interval for the conducted EMI respecting a desired confidence level for a given scenario of parametric uncertainty. Figure 8 presents the results for 1% confidence level.
Figure. 4 – Relative Effect of Parasitic Capacitance
Figure. 5 – Relative Effect of Input Voltage
Figure. 7 – 1% Confidence level for conducted EMI
TABLE I.COMPARISON WITH MC
Methodology Simulations Time (h)
Monte Carlo 25000 ~ 42 Proposed Approach 91 or 181 0.2 or 0.4
IV. CONCLUSION
A methodology suitable to take into account parametric uncertainty in power converters has been presented. It consists of four steps, which provides the output PDFs with good accuracy compared to Monte Carlo method while requiring far less calls to the solver.
The knowledge of the PDFs at different values of frequencies allows the computation of confidence intervals and finally an upper bound for conducted interferences in the presence of uncertainty.
V. REFERENCES
[1] Redl, R.; "Electromagnetic environmental impact of power electronics equipment ," Proceedings of the IEEE , vol.89, no.6, pp.926-938, Jun 2001.
[ ] Papoulis, A.: “Probability, rando variables, and stochastic processes,” Mc raw-Hill, New York, 1991, 3rd Edition. [3] S. J. Julier and J. K. Uhl ann, “Unscented filtering and nonlinear
esti ation”, Proc. IEEE, vol. 9 , n. 3, pp. 40 -402, March 2004. [4] L. R. A. . de Menezes et al, “Efficient co putation of stochastic
EM proble s using unscented transfor s,” IET Sci. Meas. Technol., vol 2(2), pp. 88-95, 2008.
[5] L. R. A. . de Menezes et al, “Statistics of the shielding effectiveness of cabinets,” in Proc. ESA Wor shop on Aerospace EMC, Florence, Session 8, paper 1, 6 pages, 2009.
[6] Bagci, H.; Yucel, A.C.; Hesthaven, J.S.; Michielssen, E.; , "A Fast Stroud-Based Collocation Method for Statistically Characterizing EMI/EMC Phenomena on Complex Platforms," Electromagnetic Compatibility, IEEE Transactions on , vol.51, no.2, pp.301-311, May 2009, doi: 10.1109/TEMC.2009.2015056
[7] Heyde, C. 2006. Central Limit Theorem. Encyclopedia of Actuarial Science.
[8] Lecture Notes of Probability, NTHU MATH 2820 – Statistics, Taiwan