HAL Id: hal-03103417
https://hal.archives-ouvertes.fr/hal-03103417
Submitted on 18 Feb 2021HAL is a multi-disciplinary open access archive for the deposit and dissemination of sci-entific research documents, whether they are pub-lished or not. The documents may come from teaching and research institutions in France or abroad, or from public or private research centers.
L’archive ouverte pluridisciplinaire HAL, est destinée au dépôt et à la diffusion de documents scientifiques de niveau recherche, publiés ou non, émanant des établissements d’enseignement et de recherche français ou étrangers, des laboratoires publics ou privés.
Consequences of membrane aging on real or misleading
evaluation of membrane cleaning by flux measurements
M. Rabiller-Baudry, Patrick Loulergue, J. Girard, M. El Mansour El Jastimi,
A. Bouzin, M. Le Gallic, Alain Moréac, P. Rabiller
To cite this version:
M. Rabiller-Baudry, Patrick Loulergue, J. Girard, M. El Mansour El Jastimi, A. Bouzin, et al.. Consequences of membrane aging on real or misleading evaluation of membrane cleaning by flux measurements. Separation and Purification Technology, Elsevier, 2021, 259, pp.118044. �10.1016/j.seppur.2020.118044�. �hal-03103417�
Revised version Separation and Purification Technology, Submitted, September 18 , 2020
CONSEQUENCES OF MEMBRANE AGEING ON REAL OR MISLEADING EVALUATION OF MEMBRANE CLEANING BY FLUX MEASUREMENTS.
Murielle Rabiller-Baudry1*, Patrick Loulergue1, Jean Girard1, Massoud El Mansour El
Jastimi1,2, Aurélie Bouzin1, Marie Le Gallic1,3, Alain Moreac3, Philippe Rabiller3
1. Univ Rennes, CNRS, ISCR (Institut des Sciences Chimiques de Rennes) - UMR 6226, F-35000 Rennes, France.
2. Department of Chemical and Environmental Engineering, University of Oviedo, Spain 3. Univ Rennes, CNRS, IPR (Institut de Physique de Rennes) - UMR 6251, F-35000 Rennes, France.
*corresponding author: murielle.rabiller-baudry@univ-rennes1.fr
ABSTRACT
Skim milk ultrafiltration is worldwide used in dairy. Its management at industrial scale is based on the permeate flux mastering, the first bottleneck, and consequently on the nature of the overall fouling which is not yet fully understood with respect to the membrane lifespan. The second bottleneck is the mastering and control of the cleaning efficiency aiming at the full removal of the initial irreversible fouling mainly made of proteins. In this study, we have deliberately chemically aged several spiral wound membrane elements by filtering NaOCl solution (400 ppm in total free chlorine at pH 8.0 and 50°C) up to a cumulative chlorine dose of 2,800 ppm.d. The critical/threshold and limiting fluxes have been proven to increase with the membrane ageing together with a decrease in their related transmembrane pressure. This suggest that, at industrial scale, UF might be managed with respect to the chlorine dose received by the membrane during its service life. SEM and Raman spectroscopy have been used to localise the initial irreversible fouling whereas ATR-FTIR was the tool to quantify proteins on membrane. Membrane cleaning was achieved by a non-oxidative alkaline detergent removing the hereafter called “removable fouling” whereas a “residual fouling” remained on/in the membrane. However, the following NaOCl treatment (achieved for disinfection purpose at industrial scale) also acts both as cleaner (polishing the alkaline step by removing part of the residual fouling) and as degradation agent toward the membrane. Unambiguously NaOCl induced a significant decrease in the membrane intrinsic hydraulic resistance associated with an increase of the irreversible fouling, either initial or residual, build during the following skim milk UF. This paper shows how degradation and fouling can transiently compensate each other and lead to the impression of an initial water flux recovery. This phenomenon can lead to misinterpretation of the membrane cleanliness in the specific case of aged membranes. Indeed,
for a received chlorine dose close to 400 ppm.d at pH= 8.0, an irreversible residual fouling can remain, strongly anchored in/on the membrane with a water flux recovery after cleaning only 15% less than that of the pristine membrane. This residual fouling favours the rapid build-up of more and more irreversible fouling during the next skim milk filtration steps. However, with respect to the accuracy on flux measurement, the amplitude of the problem will be underestimated, preventing from getting rid of the first and crucial accumulated layers and consequently leading to an irreversible accelerated degrading process. Relationships have been found between the received chlorine dose and the aged membrane resistance and the residual irreversible fouling that could be used for management at industrial scale.
KEYWORDS:
skim milk ultrafiltration ; critical flux ; threshold flux; limiting flux ; fouling; cleaning ; ageing ; sodium hypochlorite ;1. INTRODUCTION
Ultrafiltration (UF) of skim milk is widely used in dairy industry for the standardization of proteins before the cheese making process. The process mastering at industrial scale is mostly based on flux measurements during skim milk filtration. However, the membrane material evolves during its use at industrial scale and membrane degradation is an identified bottleneck as it induces a membranes’ turn-over each 2 years. This turn-over decreases strongly the sustainability and economy of the overall process because of (1) the productivity decrease due to the flux decline overtime and (2) the leakage of protein in the permeate (about 15% transmission compared to less than 5% with a new membrane) decreasing the quality of the valuable retentate fraction [1-3]. The decision of membrane element replacement is mainly based on economic considerations related with an equilibrium between the membrane cost, the protein loss and the productivity affected by the flux decrease.
The membrane replacement is generally made in emergency because of a lack of efficient tools to monitor on-line the change in membrane performances (except the skim milk flux monitoring). The current industrial practices consist in filtration at constant permeate flux by increasing the transmembrane pressure (TMP). Thus, users observed the reduction of the filtration duration before cleaning due to a too rapid increase in the TMP with the membrane lifespan. The consequence is the acceleration of the number of cleaning/disinfection steps with the membrane service life.
Except the flux in skim milk, the only other parameter monitored at industrial scale, is the water flux after the cleaning/disinfection step achieved twice a day in dairy. The water flux recovery, compared with the one obtained after the first production/cleaning+disinfection cycle is used as reference. Note that it is not the water flux of the pristine membrane that is never recovered, according all the industrials we have interviewed. Progressively, the cleaning efficiency seems to decrease and the cleaning/disinfection cycle duration increases.
It is a current idea that the problem is the cleaning efficiency and industrial practitioners always look for better detergents. However, the time at which cleaning difficulties occurs at industrial
scale still look like erratic. According to our own experience, industrial partners often attribute the performance loss to a failure in the cleaning process, even when this step is mostly automated. It is noteworthy to point out that such situations generally occur during the second part of the membrane industrial life. Our own assumption is that the problem is not due to a cleaning process failure but a consequence of the membrane ageing. Thus, from a fundamental point of view, membrane ageing can provoke a decrease of its hydraulic resistance, for instance due to the pore size increase. Consequently, if the membrane is efficiently clean (no residual fouling at all), the water flux is supposed to be higher than the one of the pristine membrane. Thus, considering the water flux of the pristine membrane as the target to reach, the recovery of water flux with the aged membrane will be misleading and will fail at evidencing the real membrane cleanliness. On the contrary, it will hide the accumulation of fouling in/on the membrane that could provoke an increased fouling during the subsequent skim milk filtration. To better master the skim milk UF, it is thus necessary to have a fundamental understanding of the origin of flux variation during a membrane life at industrial scale. It required both a better comprehension of the chemical evolution of the membrane: membrane material, fouling nature and quantity, fouling localization and their impacts on fluxes either in skim milk or in water after water rinsing and cleaning/disinfection.
1.1. Overview of membrane fouling during skim milk ultrafiltration
Skim milk is a complex mixture made of an average of [1]: - 45-48 g.L-1 lactose and 8 g.L-1 of various salts.
- 32 g.L-1 proteins: that are mainly caseins in colloidal form (≈ 27 g.L-1) and soluble
proteins. -lactoglobulin (36 kg.mol-1 in dimer form at milk natural pH) is the main
soluble protein (≈ 3 g.L-1) and -lactalbumin (14 kg.mol-1, ≈ 1 g.L-1) the smallest one.
UF is classically performed with spiral wound membrane elements, with a molecular weight cut-off close to MWCO= 5-10 kg.mol-1. The membranes used are generally based on
polyethersulfone (PES) in physical blend with small quantities of polyvinylpyrrolidone (PVP). PVP allows increasing the membrane hydrophilicity and thus the flux in aqueous media when compared to pure PES membranes.
The overall fouling obtained during UF of skim milk can be described as a multilayers’ deposit. Moving from the bulk fluid to the membrane wall, the fouling is:
(1) first made of a complex reversible layer including the concentration polarization and a gel deposit. This gel is mainly made of caseins, the colloidal fraction of the milk proteins, and is intrinsically a self-cohesive layer. However, it can be relatively easily removed by a careful water rinsing [4-5].
(2) second an irreversible layer strongly attached to the membrane and on which the reversible complex layer described above is built-up.
This irreversible fouling is either external or internal. The external part is also a multilayers’ one. -lactoglobulin, was reported as the single or at least the main component entering in the composition of the irreversible fouling on the membrane surface [4-6]. Moreover, from contact angle measurements on both the pristine and fouled membranes using 3 different solvents, it
was drawn that hydrophobic interactions are the main forces responsible in the proteins-membrane interactions [7-8]. This is in good agreement with current knowledge about protein adsorption on surfaces. The existence of external irreversible fouling due to -lactoglobulin was evidenced using tangential streaming potential measurements (i.e. along the membrane surface, before the pore entrance). It was found that the isoelectric pH of the fouled membrane matched well with that of the protein [6].
Moreover, existence of slight internal irreversible fouling was also evidenced using the same technique, but in this case, streaming potential was measured across the membrane thickness (i.e. into the pore) and showed that the isoelectric pH of the fouled membrane matched well with that of -lactalbumin the only protein able to go into the permeate fraction with respect to its size and rejection [6].
This overall irreversible fouling, hereafter called “initial irreversible fouling”, is the target of the cleaning/disinfection steps which might represent up to 30 % of the total operating time. In addition, these steps originate, at least, one third of the environmental negative impacts of the overall UF process [9]. Consequently to match with requirements of a sustainable production, a better control of both the fouling and the cleaning steps is a real need.
For given hydrodynamic conditions (constant cross-flow velocity), the negative impacts of the overall fouling can be limited by filtering at, or below, the critical flux (Jcritical) [10-18] (see
Theoretical section).
1.2. Overview of membrane degradation during disinfection step
Besides the filtration conditions, the membrane material itself has to be taken into consideration as it drives the adsorption of the first irreversible fouling layer that favor the subsequent fouling anchoring. In the case of PES/PVP membranes, ageing was evidenced to be mainly due to the disinfection step involving alkaline solutions containing NaOCl oxidative agent [19-36]. However, the disinfection by chlorine agents remains widely use at industrial scale.
Material ageing ineluctably leads to changes in the membrane hydrophobicity. The first responsible is the oxidation of the hydrophilic PVP provoking its release from the composite membrane [23, 24, 27-29]. The PVP degradation is complex and depends on the chlorine dose received by the membrane, the pH and the temperature. PVP can sometimes evolves in the formation of succinimide groups (addition of an oxygen atom) and/or generates the formation of negatively charged carboxylates. The presence of these decomposition by-products, which are more hydrophilic than the initial PVP, can transiently increase the membrane hydrophilicity. Then the leakage of either PVP or its decomposition by-products can occur up to total disappearance. This last one has been showed for industrial applications at the end of the membranes’ service life [22, 37] (see also Appendix 2). In addition, the PES backbone, even if much more stable than the PVP, can also be attacked. Once again, depending on the pH and the chlorine dose, negatively charged sulfonate groups and/or hydroxylation of phenyl rings can be produced. Both of them increase the membrane hydrophilicity [23, 24, 26-29, 37, 38] (see also Appendix 2).
Moreover, an increase of the membrane pore size has sometimes been evidenced [24, 25, 33,
Finally, on a phenomenological point of view, on one hand, the increase of the pore size and the appearance of surface charges (hydrophilicity increase) might induce a permeate flux increase. Whereas, on the other hand, the decrease in hydrophilicity due to the release of PVP and its degradation products (hydrophilicity decrease) might induce the flux decrease and make the membrane more prone to fouling by organics. Because of these contradictory trends, accurate analysis of permeate flux variation during a membrane life is probably more difficult to achieve than currently thought.
Results in good accordance with these comments have been reported in literature in several cases. Especially the fouling increase for pristine and aged membranes, such as (1) polysulfone (PSf) fouled by humic acids [40] , (2) microfiltration (MF) membranes (PSf, PVDF, Polyethylene) fouled by micro-organisms and exopolysaccharides [41] , (3) PVDF MF fouled by mixtures of bovine serum albumin (BSA) and alginate [39] , or (4) fouling in submerged membrane bioreactor (MBR) treating wastewater [42].
Few authors have reported on the decrease in membrane cleanability associated with membrane ageing, often based on experimental fluxes and membrane resistance calculations with respect to the resistance in series’ model; see for instance Puspitasari et al. [39] for PVDF membranes, Fenu et al. [42] for MBR waste water application. Our own preliminary work reported in [43] dealing with PES/PVP membrane used in skim milk UF was based on fouling quantification by ATR-FTIR as a complementary tool to flux measurements. In our opinion, due to a lack of fundamental understanding of consequence of ageing on membrane cleanability, mistakes are frequent.
Thus, the questions addressed in this paper are the two following ones: (1) Is the misleading interpretation of water flux recovery possible or not in the case of skim milk UF? (2) if any misleading interpretation is possible how to make correction to better master the membrane lifespan at industrial scale?
To answer, this study provides complements to our previous systematic studies devoted to: (1) the cleanability of a pristine PES/PVP UF membrane [18] and (2) reporting on the cleanability decrease due to NaOCl exposure [43, 44]. Especially, this paper reports on the misleading interpretation that can be drawn from water flux recovery during the membrane life, provoking the entrance into a cycle of fouling accumulation only evidenced when irreversible damage is done and service lifetime considerably shorten.
2. THEORY
This part exposes several aspects of the analysis of flux behavior.
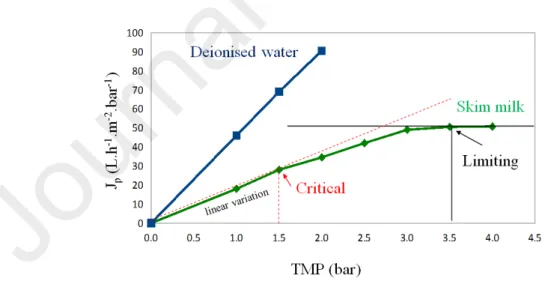
2.1. Critical/threshold and limiting fluxes
In a given membrane/fluid system for which UF is performed at a constant cross-flow velocity, two particular fluxes can be defined: the limiting flux (Jlimiting, maximum reachable flux) and
Initially, the critical flux was defined as the maximum flux without any irreversible fouling on the membrane [10-12, 14]. However, two kinds of critical flux were distinguished: (1) the strong form and (2) the weak form. In the case of the strong form, no concentration polarisation exists below the critical flux, whereas with the weak form concentration polarisation exists. With complex mixtures, especially when containing soluble organic polymers such as proteins, it is not possible to totally avoid the irreversible fouling because these organics tend to naturally adsorbed on the polymer membrane. Thus, in these cases, the initial definition of the critical flux cannot be applied as no filtration conditions can be found without any irreversible fouling. However, one can determined the minimum irreversible fouling only due to adsorption of the fouling species without any pressure applied on the membrane and considered the fouling behaviour with respect to this minimum fouling. The critical flux concept was then adapted and, for the sake of the precision, a new type of critical flux was proposed by Field and Pearce [13]: the threshold flux. This threshold flux is defined as the boundary between filtration conditions for which a low and constant irreversible fouling (due to adsorption) exists and conditions for which the irreversible fouling significantly increases. It has been previously demonstrated by our group [12] that, in the case of skim milk UF with the PES/PVP membrane used in the present study, the critical flux is of threshold type, (hereafter referred as to Jcritical/threshold).
Both Jcritical/threshold and Jlimiting are first reached for a minimum corresponding TMP as explained
in [16] and shown for the sake of clarity in Figure 1. The critical/threshold point (TMPcritical/threshold ,Jcritical/threshold) delimits two membrane fouling behaviors: below this point the
irreversible fouling is minimum and above it strongly increases. Note that this determination method of Jcritical/threshold can be done only if a hysteresis exists when decreasing the TMP after
a first increase, that was previously checked for skim milk UF.
Figure 1: Permeate flux (Jp) vs transmembrane pressure (TMP) and determination of critical and limiting points during skim milk ultrafiltration.
2.2. Membrane resistance vs. membrane ageing (chlorine dose)
In the following, the membrane ageing will be referred as the cumulative chlorine dose received by the membrane, and calculated according to the following equation:
Cumulative chlorine dose (ppm.d)= concentration x number of exposition days (1) With:
- Concentration: the concentration of the NaOCl solution expressed in ppm (mg.L-1) of total
free chlorine (TFC) that is the maximum amount of active chlorine (Cl2) that can be produced
by the solution.
It must be underlined that such definition of the cumulative chlorine dose, further called chlorine dose for the sake of simplicity, has to be coupled with the pH of the NaOCl solution to be an accurate data. Thus, the pH has an important impact on the membrane polymer degradation and huge differences were reported between pH= 8.0 (high and fast degradation) and pH=11.5-12.0 (lower and slow degradation) (see section 1.2).
As explained in the introduction, the membrane ageing may lead to several antagonist phenomena. Because of all these contradictory trends that may compensate each other, the analysis of permeate flux in skim milk with membrane exposure to chlorine has to be carefully perform to avoid misleading interpretations when using the “resistances’ in series’ model”. The main idea of this work is that the membrane resistance varies with the received chlorine dose, whereas it remains constant for the same membrane only exposed to skim milk UF and alkaline cleaning without any chlorine contact. Accordingly, the membrane resistance was determined with respect to the received cumulative chlorine dose and hereafter noted Rm,dose.
This assumption and its confirmation will be discussed later in this article.
The determination of Rm,dose was based on the “resistances’ in series” model that was applied
taking into account the received chlorine dose but also the fouling due to skim milk UF. Accordingly, several cases have to be considered. Details of the full method are given in
Appendix 3.
The initial pristine membrane hydraulic resistance hereafter denoted Rm,0 was taken as reference
(Figure A3.1, Appendix 3). It was determined from the water flux of the pristine membrane using the well-known Darcy’s law:
(2) 𝐽𝑝=
𝑇𝑀𝑃 𝜇.𝑅𝑚 With:
Jp: the permeate flux in water
µ: the permeate viscosity (close to that of water)
Rm = Rm,0: the hydraulic resistance of the pristine membrane
2.3. Hydraulic resistances due to fouling
The determination of the fouling resistances during skim milk UF was achieved using the Darcy’s law in combination with the well-known resistance in series model (equation 3,
(3) 𝐽𝑈𝐹=
𝑇𝑀𝑃 𝜇.𝑅𝑡𝑜𝑡𝑎𝑙 With:
JUF: the permeate flux in skim milk
µ: the permeate viscosity (close to that of water)
Rtotal: the global resistance to mass transfer that can be defined according to:
(4) 𝑅𝑡𝑜𝑡𝑎𝑙= 𝑅𝑚,𝑑𝑜𝑠𝑒+ 𝑅𝑓,𝑡𝑜𝑡𝑎𝑙
With:
Rm,dose the membrane resistance taking into account the material ageing, and assuming that
Rm,dose would be constant during the skim milk UF.
Rf,total the overall fouling resistance measured during skim milk UF. It can be calculated for
each TMP. Hereafter only the value at the end of the filtration (higher TMP) will be shown and discussed.
This total fouling resistance actually accounts for both reversible and irreversible fouling (equation 5).
(5) 𝑅𝑓,𝑡𝑜𝑡𝑎𝑙= 𝑅𝑟𝑒𝑣𝑒𝑟𝑠𝑖𝑏𝑙𝑒+ 𝑅𝑖𝑟𝑟𝑒𝑣𝑒𝑟𝑠𝑖𝑏𝑙𝑒,𝑖𝑛𝑖𝑡𝑖𝑎𝑙
With:
Rirreversible,initial: the hydraulic resistance of the initial irreversible part of the fouling. It can be
calculated from the water flux measured after the water rinsing immediately following skim milk UF. The calculated value only concerned the last applied TMP in skim milk. It was referred as “irreversible, initial” to avoid confusion with the irreversible resistance remaining during and/or at the end of the cleaning step (see below).
Rreversible:the resistance of the reversible part of the fouling, removable by a simple water rinsing
that can be deduced from equation 5. The deduced value only concerned the last applied TMP in skim milk.
As it will be justified in the result section, the selected formulated alkaline detergent (P3-Ultrasil 10), was proven to be efficient to clean pristine and little aged membranes but not the severely aged membranes. To take into account the possible partial inefficiency of the alkaline cleaning, the irreversible initial fouling resistance was thus split in two components:
(6) 𝑅𝑖𝑟𝑟𝑒𝑣𝑒𝑟𝑠𝑖𝑏𝑙𝑒,𝑖𝑛𝑖𝑡𝑖𝑎𝑙= 𝑅𝑖𝑟𝑟𝑒𝑣𝑒𝑟𝑠𝑖𝑏𝑙𝑒,𝑟𝑒𝑚𝑜𝑣𝑎𝑏𝑙𝑒+ 𝑅𝑖𝑟𝑟𝑒𝑣𝑒𝑟𝑠𝑖𝑏𝑙𝑒,𝑟𝑒𝑠𝑖𝑑𝑢𝑎𝑙
With:
Rirreversible,removable :the part of the initial irreversible fouling that can be removed by the chemical
alkaline cleaning using the formulated alkaline detergent without any oxidative agent.
Rirreversible,residual: the part of the initial irreversible fouling not removable by the alkaline
Thus, no resistance due to a final irreversible fouling (after alkaline cleaning + NaOCl exposition) can be detected when using the hypotheses of this study, indirectly assuming that NaOCl polished very efficiently the alkaline cleaning. Accordingly, Rm,dose variation integrated
the membrane variation minus an irreversible fouling remaining after NaOCl that is not detectable by this approach. This means that the impacts on Rm,dose variation described below
were probably lower than the real ones. Such assumption will be discussed at the end of the paper.
3. MATERIAL AND METHODS
3.1. Skim milk and solutions
The skim milk used was a commercial one (UHT, Lait de Montagne, Carrefour, France) containing an average of 32 g.L-1 proteins and 48 g.L-1 carbohydrates (mainly lactose) and only
traces of lipids (< 0.5 wt %).
Water used either for solution preparation or membrane filtration was deionized and 1 µm filtered. Its conductivity was always lower than 1 μS.cm-1.
A formulated cleaning-in-place (CIP) solution was prepared at 4 g.L-1 in water from P3-Ultrasil
10 powder provided by Ecolab (France). Its natural pH was 12.0. This non-oxidative formulated detergent was previously shown to be efficient for the CIP of pristine PES/PVP membranes fouled by skim milk [18]. The water flux recovery was always better than 98% with the pristine membrane used in the present study after cleaning during 1 h at 50°C and 2 bar at the same cross-flow velocity than that use during the skim milk UF.
To deliberately chemically age the membranes, NaOCl solutions set at 400 ppm TFC were prepared from commercial bleach solution provided by Lacroix (“eau de Javel” (bleach) 96,000 ppm TFC, France). The pH was adjusted to 8.0 using HCl (analytical grade, Normapur, Prolabo, France). This value was previously found to correspond to the acceleration of the membrane chemical ageing, mainly due to the appropriate proportions of HClO and ClO- allowing the
formation of numerous OH° radicals [29].
3.2. Membranes and membrane analysis
Either membrane material or membrane spiral wound elements are described here together with the deliberate ageing made on certain spiral wound membrane elements.
o Membranematerial
A PES based UF membrane (MWCO= 5-10 kg mol-1, HFK-131, Koch, USA) was selected as
it is up to now the worldwide reference for the skim milk UF application at industrial scale. This membrane is mainly made of PES but also contains some PVP (see Appendix 2 for structure of polymers).
According to its provider, this membrane is guaranteed up to a cumulative chlorine dose of 5,000 ppm.d. However, no clear information is given on the way to reach this maximum chlorine dose, especially when dealing with the pH of the NaOCl solution.
o Spiral wound membrane elements
The spiral wound membrane used are made of the PES/PVP material described above. Four spiral wound membrane elements were used in this study. They are also called 4”(inch) elements or 4333 elements (Koch, USA) for 4.3” (109 mm) external diameter and 33” (838 mm) length, respectively. One single spiral membrane element is made of three or four double sheets of flat membranes, depending on the membrane element type (see below). Each double sheet is made of two flat membranes glued back to back on 3 of the 4 sides of the flat sheets, forming an opened pocket in which the permeate is collected and further recovered on the opened side itself glued on a central tube. All double sheets are wounded around the permeate collector axis (central tube). The filtering area of one spiral membrane element was 6.5-6.8 m2,
according to the provider.
- Negligible ageing by NaOCl. A first spiral membrane element, hereafter called S-CIP-1 (3 double sheets, Koch reference KM8243083017V, F type spacers = 80 mil) was only used for skim milk filtration at 50°C. Over the 9 years’ life of the membrane element at laboratory scale, the permeance to water remained constant at Lpwater
50°C = 50 ± 5 L.h-1.m-2.bar-1 and that in skim
milk at Lpskim milk
50°C =15 ± 1 L.h-1.m-2.bar-1 with a feed flow rate of 12.5 m3.h-1. This membrane
has been regularly cleaned at 50°C with alkaline detergents at pH 11.5-12.0. During the 9 years of its service life, the cumulative cleaning time by alkaline bleach at 200 ppm TFC and pH= 11.5 has been 330 min meaning that the chlorine dose received by the membrane was 46 ppm.d that was much less than those received by the other spiral membrane elements deliberately aged in this study (see below). In the following, S-CIP-1 was thus assumed to act as a “reference membrane” for which the natural, chemical, mechanical and physical ageing were not evidenced by flux measurements. Consequently, the evolution of the permeance, either in water or in skim milk, for the membrane elements deliberately aged, cannot be attributed to a pure mechanical & physical ageing when considering filtration experiments during less than 5 months (the maximum duration of experiments achieved with the other membrane elements, see below). However, in this study, when long NaOCl filtrations were achieved during the deliberate ageing, synergetic effects between chemical induced ageing and mechanical ones cannot be excluded. Note that even if S-CIP-1 was always correct to achieve filtration we have decided to autopsy it. After a final ultrafiltration of skim milk at an average TMP of 2.6 bar (3.7 at inlet, 1.5 bar outlet), 2h at 50°C and 0.3 m.s-1 , the entire spiral wound membrane element
was autopsied after rinsing but without any chemical cleaning in order to map the initial irreversible fouling and the results have been reported in [45].
- Deliberate ageing by NaOCl. Two other spiral wound membrane elements were used (4333 K131 VYV module, 31 mil retentate spacers, Koch nomenclature); both were 4 double sheet membranes. They are hereafter referred to as S-CIP-2 (Koch reference KMS-K131-V-8983540008) and S-CIP-3 (Koch reference KMS-K131-V-8879759136), respectively. Before its first use, each pristine spiral membrane element was extensively rinsed by deionized water then cleaned by P3-Ultrasil 10 (4 g.L-1, 50°C, 1 bar, 1 h). The membrane was then compacted
by filtration of deionized water at 50°C, TMP= 4 bar for at least 2 h which was a sufficient time to reach a constant reference permeance. After compaction, the water permeance was Lp,0 = 50
± 5 L.h-1.m-2.bar-1 (at 50°C) while the permeance in skim milk at 2 bar was L
p,UF = 15 ± 1 L.h -1.m-2.bar-1 for both S-CIP-2 and S-CIP-3 with a feed flow rate of 9.5-10.0 m3.h-1. These values
were in perfect accordance with those measured with S-CIP-1, meaning that the 3 spiral membrane elements were similar when dealing with their flux behaviour.
- Stocked spiral membrane element to sample flat membranes. A fourth spiral membrane element (denoted S-cut-CIP-1, 4 double sheet membrane, similar to S-CIP-2 and S-CIP-3) was used as a stocked material in which small flat membranes were sampled. These flat membranes were occasionally used for the determination of the irreversible fouling location by Raman spectroscopy and scanning electron microscopy pictures (see results section).
Images of fouled S-CIP-1 by FESEM
Field emission scanning electron microscopy (FESEM) was used to acquire images of the initial irreversible fouling of the S-CIP-1 membrane at the end of its service life, even if its performances remained satisfying. The sample was collected in a highly fouled zone as checked by ATR-FTIR quantification of proteins. Moreover, the dried membrane samples were put in liquid nitrogen and break in order to reveal the different layers of both the pristine membrane and the fouled ones. The consequence of the sample preparation was that some parts of the fouling were removed and the deposit was not homogeneous on the obtained pictures. The microscope was a JSM JEOL 6301 F (Japan) working at a low accelerating voltage of 7 kV. o Analyses of fouled spiral wound membrane element by ATR-FTIR
The two spiral wound membrane elements deliberately aged were autopsied after their final skim milk UF and a careful water rinsing (no cleaning, last TMP= 4.7 bar in skim milk). The full autopsy of a single spiral membrane element required the registration of 336 ATR-FTIR spectra. Each one of the 8 flat sheets of a spiral membrane element (2 x 4 double sheets) was entirely cut in 42 coupons of 127 cm2, and the location of each one was recorded, allowing
a full mapping of the spiral membrane element. Before analysis the membrane samples have to be carefully dried few days under dynamic vacuum to totally remove traces of water. Each spectrum was collected at the center of the 127 cm2 coupons.
ATR-FTIR spectra were registered on a Spectrum 1000 spectrometer (Perkin Elmer) using a ZnSe crystal at 45° allowing 12 reflexions. Each spectrum was the average of 20 scans with a 2 cm-1 resolution. Data were processed by the mean of the Spectrum for Windows software
(version 5.0).
Quantification of the protein amount (using the amide II band located at 1539 cm-1, precision ±
1 µg.cm-2) directly on the PES/PVP membrane was achieved by ATR-FTIR according to a
procedure previously described [4]. Simultaneously, the ageing states of the membranes were systematically checked by following the PVP removal (C=O band located at 1661 cm-1) as well
as the PES backbone attack (several mechanisms leading to different bands, all located at 1030 cm-1) using a procedure reported in [34]. The final results for S-CIP-2 and S-CIP-3 were
calculated as the average of the 336 spectra acquired for each one.
For small flat membranes, the same protocol was used except the number of registered spectra (see results section).
o Analyses of flat membrane by Raman scattering
Raman spectroscopy was used to determine the location of the proteins of the initial irreversible fouling either on the membrane surface or in the membrane structure of a pristine flat membrane (127 cm2 sampled in S-cut-CIP-1) after skim milk UF. Before analysis the samples were
carefully dried under dynamic vacuum to remove water traces.
Measurements have been performed on a HR 800 (HORIBA, Jobin-Yvon) micro-Raman spectrometer with the following configuration: Helium-Neon laser (633 nm) coupled to a microscope with an x100 ulwd objective allowing a spatial resolution of about 1µm. The spectrometer was coupled to a micro-translation table allowing control of the focusing distance (z).
The present study focused on the amide III bond of proteins (located close to 1450 cm-1) and
PES membrane signature (close to 1500 cm-1). Spectra were collected between z = - 2.5 µm
(outside membrane) and z= +10.1 µm (inside membrane) knowing that the membrane surface was located at z= - 0.7 µm. Measurements have been performed at room temperature and ambient air.
3.3. Ultrafiltration conditions
UF was achieved with small flat membrane for analytical purpose and with the 3 spiral wound membrane elements (S-CIP-1, S-CIP-2, S-CIP-3).
o UF with flat membrane used for Raman scattering
A flat PES/PVP membrane (127 cm2) sampled in S-cut-CIP-1 was inserted in a plate and frame
Rayflow X100 module. A 2 mm thickness spacer was inserted in the liquid channel on the feed/retentate side. A permeate spacer was also used in the permeate side to mimic as close as possible the sandwich spacer/membrane/spacer encountered in a spiral membrane element. The flat membrane was fouled by skim milk at 2 bar, 50°C, 0.3 m.s-1 during 2 h then carefully rinsed
by deionized water only allowing the removal of the reversible part of the fouling. o UF with spiral membrane element and hydrodynamic standard conditions
UF was carried out on a 100 L capacity-pilot scale filtration device provided by TIA (Bollène, France) equipped with one 4” spiral membrane element (see Appendix 5 for scheme and pictures of the pilot).
Unless otherwise specified, UF at 50°C was achieved in standard conditions, processing 25 L of solution. The volume reduction ratio was VRR = 1, obtained by full recycling of both retentate and permeate in the feed tank. The feed flow rate was Qfeed= 11.0 ± 1.5 m3.h-1 leading
to an average cross-flow velocity in free liquid channel estimated to be v = 0.38 ± 0.05 m.s-1.
Depending on the experiment, the average TMP (mean value of the retentate pressure at inlet and outlet of the module) was varied in the 1-5 bar range. In these TMP range, the pressure drop along the module length was constant at P = 2.2 bar.
o UF of skim milk, water rinsing and alkaline cleaning with spiral membrane element 24 L of skim milk were processed for each filtration. The average TMP was progressively increased from 1.1 to 4.7 bar; critical and limiting fluxes were deduced from these filtrations.
After skim milk UF, water rinsing was carefully achieved at TMP= 2 bar in open circuit until whiteness has totally disappeared from the effluents, the pH of which were controlled to be neutral. After few minutes at TMP= 2 bar in water, the membrane permeance was measured again to evaluate the reversibility/irreversibility of the fouling.
Finally, the membrane was cleaned by P3-Ultrasil 10 at TMP= 2 bar, 50°C, 1 h. After alkaline cleaning, water rinsing was carefully achieved first in open circuit until pH of the retentate was neutral. Rinsing was then continued with retentate recycling (to minimize water consumption) until the permeate pH was neutral to guarantee the cleaning agent removal.
o Spiral membrane element ageing by NaOCl in UF conditions
The membranes were deliberately aged at 50°C by continuous filtration of NaOCl (25 L, 400 ppm at pH= 8.0) at TMP= 2 bar (UF standard conditions) during different time. Controlled chemical ageing of the two spiral wound membrane elements were achieved up to different cumulative chlorine dose: 2,000 ppm.d and 2,800 ppm.d, for S-CIP-2 and S-CIP-3, respectively. For each of the module, skim milk UF are sometimes intercalated between the filtrations of NaOCl to check the membrane behavior according to the received chlorine dose. The detailed protocol used for membrane ageing is given in Appendix 1.
3.4. Calculations
All these calculations were made for experiments achieved with S-CIP-2 and S-CIP-3 spiral wound membrane elements.
o Determination of critical/threshold and limiting fluxes
Permeate fluxes were measured during filtration of skim milk by increasing step by step the TMP from 1.1 to 4.7 bar. Each 0.5 bar increase of TMP was performed only after the plateau of permeate flux value was reached at the previous pressure. The duration of UF, at each TMP, was 25-40 min depending on the TMP. The accuracy on flux measurement was better than 3%. The critical and limiting points defined in the theory section were graphically determined (Figure 1).
o Calculation of membrane resistance vs membrane ageing (NaOCl dose)
In absence of any ageing due to chlorine, the hydraulic resistance of the membrane (Rm or Rm,0)
remained the membrane resistance regardless of the fouling due to skim milk as no chemical degradation occurs. For instance, this is the case for the first filtration of skim milk with the pristine S-CIP-2 and for the 3 first ones (hereafter noted UF1, UF2, UF3 on figures) for the pristine S-CIP-3 and the two following duplicate, respectively.
During NaOCl filtration, experiences have depicted that the flux evolution with time was different depending on the presence of proteins on the membrane:
- Case 1: In absence of any residual fouling due to proteins the flux increased slowly vs
time, following a monotone slope. The variation of the hydraulic resistance can unambiguously be attributed to the membrane progressive degradation (that can be due either to chemical degradation or to a combination of chemical and mechanical degradation if synergies existed between the two). This is the case of a membrane very efficiently cleaned after a fouling step (Figure A3.2, Appendix 3).
- Case 2: In presence of any residual fouling due to proteins, the flux increased rapidly
during the first few minutes and then much more slowly. The first slope was attributed to the superimposition of the membrane degradation and the protein removal due to the cleaning effect of NaOCl polishing the previous alkaline cleaning when this last one was not efficient enough to remove all the proteins. The second slope can unambiguously be attributed to the membrane progressive degradation (similar trends as case 1). It was assumed that the second slope can model the impact of the membrane degradation due to NaOCl during the first minutes of NaOCl filtration, the sole cleaning impact being determined from the difference of the two slopes.
Case 1 was also that of little aged membranes; just after skim milk UF + alkaline cleaning, the water flux recovery was systematically close or better than 90%. After the NaOCl treatment up to a certain cumulative chlorine dose and water rinsing, the membrane resistance was easily calculated from the following water flux thanks to the Darcy’s law, by substituting Rm for
Rm,dose in equation 2. This allowed the determination of the variation of Rm,dose with contact
time with NaOCl (and cumulative chlorine dose) (Figure A3.2, Appendix 3).
Case 2 was that of membranes having received “high” cumulative chlorine dose before skim milk UF and for which the flux recovery after the alkaline cleaning was lower than 90%. The flux increased following two distinct and consecutive slopes (high then low) meaning that two different phenomena occurred with different kinetics (Figure A3.3, Appendix 3).
4. RESULTS
The impact of the membrane chlorine exposure will now be shown, first on the global process parameters as critical/threshold and limiting fluxes, and second on the flux recovery after cleaning and its possible interpretations.
4.1. Initial irreversible fouling location
Complementary FESEM pictures and Raman analysis were achieved to evidence the location of the initial irreversible fouling due to proteins.
FESEM pictures of the initial fouling of the S-CIP-1 membrane in a region fouled by 125 µg.cm-2 proteins as quantified from ATR-FTIR are depicted Figure 2 b-e. In dried state, the
external fouling layer can be estimated as 1-2 µm thickness. However, FESEM is not a tool able to highlight the pore size of the pristine membrane (Figure 2a) and consequently that of the fouled one. Similarly, FESEM failed at evidencing any internal fouling.
On the contrary, Raman spectroscopy achieved on a flat membrane fouled at 2 bar allowed to evidence the presence of both external and internal fouling due to proteins (Figure 3).
The fouling was mainly located on the membrane surface with a micron order thickness in very good agreement with SEM pictures obtained on the dried membrane after cryo-fracture in liquid nitrogen (Figure 2e). However, Raman spectroscopy also allowed to localise proteins inside the membrane in a layer of few microns thickness. Knowing from FESEM pictures that the active layer of the pristine membrane was about 1 µm thickness (higher magnification, Figure
structure including the active layer but also in the intermediate layer, both being made of a blend of PES and PVP. The fouling occurrence, on top of and inside the membrane, revealed by Raman spectroscopy was in good agreement with our previous results obtained from streaming potential measurements [6].
(a)
(b) (c) (d) (e)
Figure 2: FESEM pictures - (a) PES/PVP HFK-131 pristine membrane evidencing a denser layer of less than 1 µm thickness assumed to be the active layer thickness in dried state.- (b-e) highly fouled zone observed near the permeate axisof the S-CIP-1 membrane after fouling and rinsing. (e) the white cloudy layer about 1-2 µm thick on the membrane surface is assumed to be the external initial irreversible fouling in dried state. The corresponding fouling amount was equal to 125 µg.cm-2 proteins as quantified by ATR-FTIR but is not representative of the entire autopsy reported in [45].
Raman diffusion raw spectra outside /surface/inside membrane (PES membrane) (Amide III proteins) In te n si ty (c o u n t. s -1) In te n si ty (c o u n t. s -1) PES Amide III outside inside Depth (µm) Wavenumber (cm-1)
Figure 3: Raman spectroscopy analysis of a pristine PES/PVP (HFK-131) membrane fouled by skim milk at 2 bar, 50°C, VRR=1, 0.3 m.s-1. Membrane surface is located at z= - 0.7 µm. Positive z values correspond to fouling inside the membrane. The corresponding fouling amount was equal to 30 µg.cm-2 as quantified by ATR-FTIR.
4.2. Influence of membrane ageing on Jcritical/threshold and Jlimiting
The variation of permeate flux with TMP in skim milk was studied for the two spiral wound membrane elements with respect to the received chlorine dose.
o Pristine membranes
Before any ageing, one skim milk UF was achieved with the S-CIP-2 membrane whereas 3 successive filtrations were carried out with the S-CIP-3 membrane (with alkaline cleaning between each milk UF). Both Jcritical/threshold and Jlimiting were deduced from Figure 4.
0 10 20 30 40 50 60 0.0 0.5 1.0 1.5 2.0 2.5 3.0 3.5 4.0 4.5 5.0 Jp at 5 0 °C ( L .h -1.m -2) TMP (bar)
Figure 4: Variation of permeate flux with TMP during filtration of skim milk by spiral membrane elements S-CIP-2 and S-CIP-3. ◊: pristine S-CIP-2; ♦pristine S-CIP-3, UF1; ●: S-CIP-3, UF2; ▲: S-CIP-3, UF3.
UF experiments showed a very good reproducibility and Jcritical/threshold = 29 L.h-1.m-2 while
Jlimiting = 50 L.h-1.m-2. These values are in accordance with previous results obtained by Diagne
et al. [18] for the same membrane type used in flat configuration in a plate-and-frame module with close hydrodynamic conditions.
After the alkaline cleaning, no residual fouling can be evidenced from water flux measurements. For the sake of comparison, it was checked over that the 9 years of service life of S-CIP-1 that the permeance to water remained equal to Lp= 50 ± 5 L.h-1.m-2.bar-1 while its permeance in
skim milk was constant and equal to 15 ± 1 L.h-1.m-2.bar-1. These results allowed to conclude
that further evolution of the critical and limiting fluxes of S-CIP-2 and S-CIP-3 might be due to the membrane ageing induced by NaOCl and not to the polymer natural & physical & mechanical ageing.
o NaOCl aged membranes
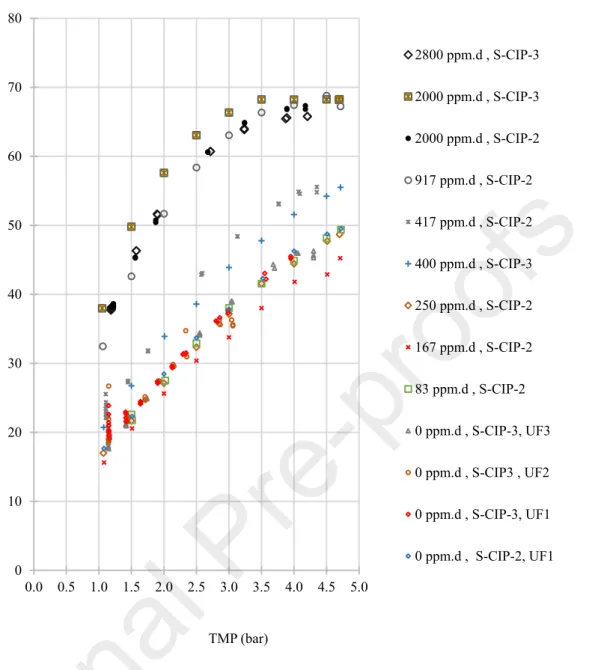
Figure 5 depicts the flux in skim milk for the same two membranes after membrane exposure
to different chlorine dose. For a given pressure the permeate flux in skim milk tended to increase with membrane exposure to chlorine.
0 10 20 30 40 50 60 70 80 0.0 0.5 1.0 1.5 2.0 2.5 3.0 3.5 4.0 4.5 5.0 Jp a t 5 0 °C ( L .h -1 .m -2 ) TMP (bar) 2800 ppm.d , S-CIP-3 2000 ppm.d , S-CIP-3 2000 ppm.d , S-CIP-2 917 ppm.d , S-CIP-2 417 ppm.d , S-CIP-2 400 ppm.d , S-CIP-3 250 ppm.d , S-CIP-2 167 ppm.d , S-CIP-2 83 ppm.d , S-CIP-2 0 ppm.d , S-CIP-3, UF3 0 ppm.d , S-CIP3 , UF2 0 ppm.d , S-CIP-3, UF1 0 ppm.d , S-CIP-2, UF1
Figure 5: Variation of permeate flux with TMP during filtration of skim milk on the aged S-CIP-2 and S-CIP-3 spiral membrane elements. The values in ppm.d represent the cumulative chlorine dose received by each membrane before UF of skim milk.
At first sight, these results could appear surprising as industrial partners regularly mentioned that fluxes in skim milk decrease with industrial lifetime of a membrane, generally inducing questions about the cleaning efficiency as already mentioned. However, these results are in good agreement with the several possible mechanisms explained in introduction, especially dealing with the complex variation of membrane hydrophobicity due to both PVP and PES oxidation which can in turn affect membrane filtration performances.
The PVP degradation was proven to induce two consecutive steps that have been observed for low MWCO PES/PVP membranes (5-10 kg.mol-1) [43] but not mentioned with membranes of
higher MWCO such as 100-150 kg.mol-1 [27, 28]. With the low MWCO membranes, first the
PVP removal induced a decrease in water flux with respect to the increase in the membrane hydrophobicity. Second after a sufficient exposure to chlorine an increase in water flux was
evidenced, due to a more important chemical degradation, also evidenced from contact angle measurements and drawn surface tensions, either polar or apolar ones [43].
Moreover, several studies have demonstrated the possible increase in membrane pore size due to the PVP dislodgment [24, 25, 27]. The pore size variation was not determined in the present work, and this variation is only an assumption here. However, if the pore size increases it could decrease the rejection of the smallest protein of milk (-lactalbumin) and thus increase the internal fouling. Conditions of exact compensation of the two phenomenon, either pore size increase or fouling increase might exist.
Figure 6 depicts the variation of Jcritical/threshold and Jlimiting, and the according TMPcritical/threshold
and TMPlimiting against membrane chlorine dose exposition.
(a)
(b)
Figure 6: Evolution of (a) Jcritical/threshold and Jlimiting and (b) TMPcritical/threshold and TMPlimiting with membrane chlorine dose exposition deduced from experimental data of Figure 5.
Both fluxes varied similarly with the membrane exposure to NaOCl. For chlorine doses below 250 ppm.d, fluxes were constant and equal to those measured with the pristine membranes. Further chlorine dose increase between 250 and 1,000 ppm.d led to an increase of both fluxes. Finally, for doses greater than 1,000 ppm.d and up to 2,800 ppm.d the fluxes level-off to reach plateau values of about 40 L.h-1.m2 and 70 L.h-1.m2 for J
critical/threshold and Jlimiting, respectively.
These plateau values correspond to 140 % of the initial respective values of the pristine membranes.
Variations of TMPcritical/threshold and TMPlimiting followed similar trends as fluxes, depicting
constant values up to 50 ppm.d followed by a decrease between 250 and 1,000 ppm.d. Finally, a stabilization at 1.2 bar and 3.2 bar, respectively is observed for for greater doses.
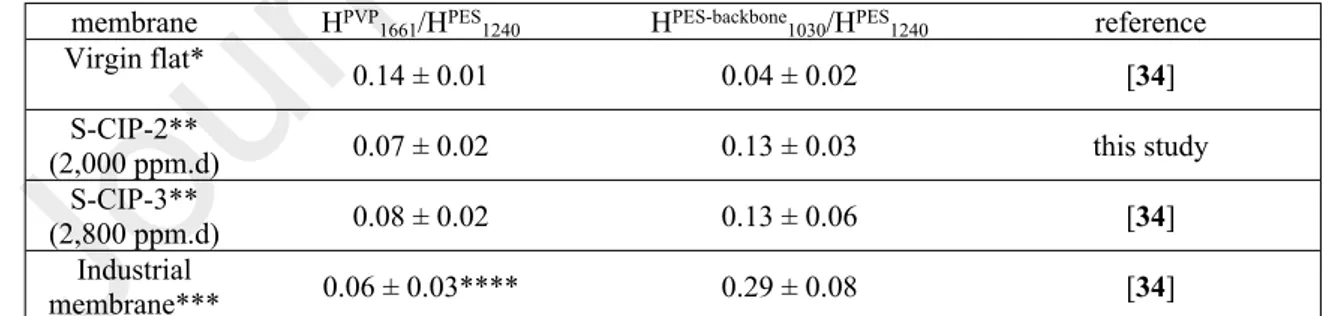
Aiming at evidencing if such variations could be related to the gradual oxidation and the subsequent release of the PVP but also the PES backbone attack, the two membranes were autopsied at 2,000 ppm.d for S-CIP-2 and 2,800 ppm.d for S-CIP-3.
The quantitative evaluation of PVP amount in the membrane was determined from the relative absorbance at 1658 cm-1 (HPVP
1658) with respect to an internal reference band of PES located at
1237 cm-1 (HPES
1237). Table 1 clearly confirms the reduction of PVP amount (HPVP1658/HPES1237
ratio decrease) compared to the pristine membrane but no total disappearance contrary to what was previously evidenced with a spiral wound membrane element at the end of its industrial life [34, 37]. ATR-FTIR showed also the increase in PES degradation determined from the relative absorbance at 1027 cm-1 (HPES-backbone
1027) with respect to the internal reference band of
PES(HPES-backbone
1027/HPES1237 ratio increase).
The more advanced ageing state (S-CIP-3) corresponded approximately to about half of a membrane industrial lifespan, regarding the received chlorine dose that was equivalent to the half of the dose guaranteed by the membrane provider, but also to the half-decrease of the PVP band intensity. However, the PES degradation was also shown at these “early” stages.
Table 1: ATR-FTIR analysis of virgin and spiral aged membranes.
membrane HPVP
1661/HPES1240 HPES-backbone1030/HPES1240 reference
Virgin flat* 0.14 ± 0.01 0.04 ± 0.02 [34] S-CIP-2** (2,000 ppm.d) 0.07 ± 0.02 0.13 ± 0.03 this study S-CIP-3** (2,800 ppm.d) 0.08 ± 0.02 0.13 ± 0.06 [34] Industrial membrane*** 0.06 ± 0.03**** 0.29 ± 0.08 [34]
*Average of 54 spectra acquired on different flat membranes collected in S-cut-CIP-1, ** average of 336 spectra acquired on the overall membrane element (4 double sheets = 8 flat sheets, 42 spectra per flat sheet) , ***8 inches spiral wound membrane element aged at industrial scale and at the end of its service life [37], **** raw band without removal of slight contribution due to proteins, knowing that applying roughly the treatment to remove amide II band led to a full disappearance of the PVP band.
4.3. Influence of membrane ageing on membrane fouling
In order to get further insight into membrane ageing consequences, the progressive influence of chlorine dose on membrane resistance and membrane fouling was evaluated for the spiral membrane elements.
Figure 7 shows the regular decrease of the membrane resistance (Rm,dose) with the received
chlorine dose confirming the regular membrane degradation with exposure duration to NaOCl.
0.0E+00 1.0E+12 2.0E+12 3.0E+12 4.0E+12 5.0E+12 6.0E+12 7.0E+12 8.0E+12 9.0E+12 1.0E+13 1.1E+13 1.2E+13 1.3E+13 0 500 1000 1500 2000 2500 Rir ev er si b le ,r es id u a l (m -1) Rm ,d o se (m -1) Chlorine dose (ppm.d)
R
m ,d os e(m
-1)
R
ir re ve rs ib le , r es id u al(m
-1)
Chlorine dose (ppm.d)
Figure 7: Variation of the membrane resistance (●: Rm,dose) and of the residual irreversible fouling resistance (▲: Rirreversible,residual) determined by the resistance in series’model after classical alkaline cleaning by formulated detergent against chlorine dose received by the membrane
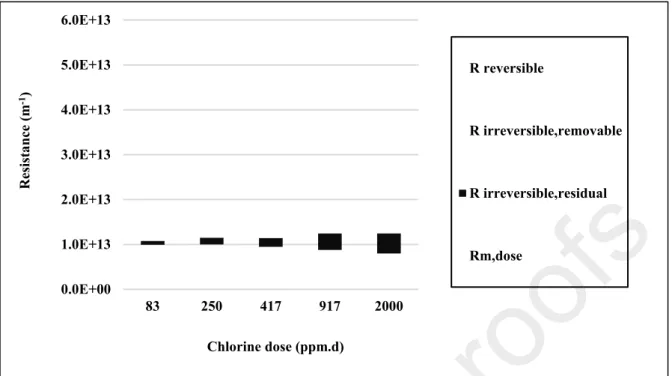
Figure 8 shows the variation of the resistances determined at the end of each skim-milk
filtration cycle (TMP= 4.7 bar) by the mean of the resistance in series’ model. The total fouling resistance (Rf,total, equation 5) was significantly higher than the membrane resistance itself as
Rm,dose remained in the range 1.3 1013- 0.8 1013 m-1.
With the pristine membrane, skim milk UF in standard conditions led to a total fouling resistance Rf,total= 4.0 1013 m-1. This value increased up to 4.8 1013 m-1 after the first 83 ppm.d
dose (see also Figure A4.1 in Appendix 4). However, further increase of the chlorine dose led to the decrease of the total fouling resistance in good agreement with flux increase, but surprisingly when compared to the industrial knowledge. Between 1,000 and 2,800 ppm.d, the total fouling resistance value seemed to reach a plateau value close to Rf,total= 3.0 1013 m-1 which
corresponds to chlorine dose above which Jcritical/threshold and Jlimiting leveled off. It must be
0.0E+00 1.0E+13 2.0E+13 3.0E+13 4.0E+13 5.0E+13 6.0E+13 83 250 417 917 2000 R es is ta n ce ( m -1) Chlorine dose (ppm.d) R reversible R irreversible,removable R irreversible,residual Rm,dose
Figure 8: Decomposition of the different fouling types according to the resistance in series model for membrane having received different chlorine dose (all values correspond to S-CIP-2 membrane) with 𝑅𝑓,𝑡𝑜𝑡𝑎𝑙= 𝑅𝑟𝑒𝑣𝑒𝑟𝑠𝑖𝑏𝑙𝑒+ 𝑅𝑖𝑟𝑟𝑒𝑣𝑒𝑟𝑠𝑖𝑏𝑙𝑒,𝑖𝑛𝑖𝑡𝑖𝑎𝑙 (equation 5) and 𝑅𝑖𝑟𝑟𝑒𝑣𝑒𝑟𝑠𝑖𝑏𝑙𝑒,𝑖𝑛𝑖𝑡𝑖𝑎𝑙=
(equation 6)
𝑅𝑖𝑟𝑟𝑒𝑣𝑒𝑟𝑠𝑖𝑏𝑙𝑒,𝑟𝑒𝑚𝑜𝑣𝑎𝑏𝑙𝑒+ 𝑅𝑖𝑟𝑟𝑒𝑣𝑒𝑟𝑠𝑖𝑏𝑙𝑒,𝑟𝑒𝑠𝑖𝑑𝑢𝑎𝑙
The reversible fouling contribution (Rreversible) could be considered more or less as roughly
constant and independent of the membrane ageing (Figure 8, see also Figure A4.1 in Appendix
4). This behavior could be explained as follows. In the reversible part of the fouling, that was
located far from the membrane surface, foulant-foulant (protein-protein) interactions acted rather than foulant-membrane interactions. Thus, once the first fouling layers were formed on the membrane, the build-up of the following layers becomes independent of the properties of the initial membrane material (charge, hydrophobicity).
The irreversible fouling resistance (Rirreversible,initial, Figure 8, see also Figure A4.1 of Appendix
4) strongly decreased with the chlorine dose received by the membrane. Furthermore, for
chlorine dose greater than 1,000 ppm.d, a plateau was reached close to R,irreversible,initial = 1.0 1013
m-1. This value is more than 2 times lower than the irreversible fouling resistance observed for
a chlorine dose of 83 ppm.d. At first sight, this could appear in contradiction with the current idea of increase in problems due to fouling with membrane long term use.
For the sake of complement, the quantification of the proteins responsible for the initial irreversible fouling at 4.7 bar (final applied TMP during skim milk UF) was achieved by ATR-FTIR for the two spiral wound membrane elements (Table 2). The full autopsy of these two membrane elements suggested that the irreversible fouling remaining before the membrane final cleaning increased with the received chlorine dose. This increase of foulant protein amount is also in good agreement with quantification achieved on flat membrane deliberately aged by NaOCl under micro-wave conditions and reported in [44]. Such results appeared in better agreement with those expected contrary to the resistance calculations which gave relatively close results between 2,000 and 2,800 ppm.d dose.
Table 2: Quantification of proteins of the initial irreversible fouling on entire spiral
membrane elements deliberately aged determined by ATR-FTIR membrane during foulingFinal TMP
(bar) Proteins (µg.cm-2) reference S-CIP-2 (2,000 ppm.d) 4.7 39 ± 10 * this study S-CIP-3 (2,800 ppm.d) 4.7 50 ± 9 * [34]
* average of 336 spectra acquired on the overall membrane element (4 double sheets = 8 flat sheets, 42 spectra per flat sheet)
4.4. Influence of membrane ageing on membrane cleaning
The water flux recovery is the only on-line determination to estimate the membrane cleaning efficiency. However, the pristine membrane (and its Rm,0) is always taken as the reference.
According to the variation of Rm,dose this reference appears as a “not well appropriate” one.
For the pristine membrane as well as for the membrane aged up to 83 ppm.d dose, Rirreversible,initial
= Rirreversible,removable and Rirreversible,residual was null (see equation 5 for definition). On the contrary,
Rirreversible,residual increased for more severely aged membrane. Figure 8 (see also Figure A4.2 in
Appendix 4) shows the significant decrease of Rirreversible,removable until a 1,000 ppm.d dose
before reaching a plateau up to 2,000 ppm.d dose. A non-linear behavior was observed for Rirreversible,residual with a sharp increase up to a chlorine dose of 1,000 ppm.d while it became
lower above this value.
These results clearly evidenced that the irreversible fouling was more and more difficult to remove with membrane exposure to chlorine. This behavior might be the consequence of the membrane surface physico-chemical modifications leading to an increase in protein-membrane interactions. However, it could also be the consequence of the increase of the internal fouling amount for aged membranes compared to the pristine one, as already suggested in 4.2 section when dealing with possible pore size increase. Interestingly, and contrary to the decrease of the total and initial irreversible fouling resistances with membrane ageing that was commented above, difficulties in cleaning observed here were in fairly good agreement with industrial knowledge.
Figure 9 depicts the evolution of the flux in NaOCl following a cycle skim milk UF + alkaline
cleaning. During the 150 first minutes, a rapid increase of the membrane permeance was observed mainly attributed to the oxidant cleaning (“cleaning polishing”). After that, the kinetics of the permeance increase was much lower and was attributed to the membrane degradation by chlorine. This assumption was reinforced as this second part looked like to the behavior in NaOCl for all treatment that did not immediately followed a skim milk UF + alkaline cleaning cycle. These observations confirmed the hypothesis of a cleaning action only during the first 150 min.
50 55 60 65 70 75 0 50 100 150 200 250 300 350 L p @ 5 0° C ( L .h -1.m -2.b ar -1)
Time in NaOCl (min)
916 to 1000 ppm.d 416 to 500 ppm.d 250 to 333 ppm.d 83 to 166 ppm.d 0 to 83 ppm.d
Figure 9: Membrane permeance variation during the NaOCl ageing steps immediately following each skim milk UF + alkaline cleaning + water rinsing
Rirreversible, residual (equation 6) was negligible with the slightly aged membrane. However it was
about 50% of the irreversible initial fouling for membrane having received a 2,000 ppm.d dose (Figure 8). It must be noticed that no residual irreversible fouling after NaOCl cleaning could be evidenced from such calculations, regardless of the membrane ageing up to a 2,000 ppm.d dose because of assumptions explained in the theoretical part.
Figure 7 highlights that during the first half-time life of the membrane (up to about 2,000 ppm.d
dose) empirical correlation could be drawn between Rm,dose and Rirreversible,final. Such relationship
could be used as complementary data to the water flux recovery evidenced here as sometimes misleading when dealing with cleaning efficiency. Consequently, from an industrial point of view, monitoring the membrane cleanability/ageing by simple permeability measurements might not be feasible over a chlorine threshold dose that have not been determined yet.
5. DISCUSSION
The discussion aims first at the demonstration of the misleading interpretation that can be drawn from water flux recovery after cleaning of aged membranes when only using the pristine membrane as reference. The second part of the discussion is devoted at giving an explanation of the relative values of the fouling resistances depicted Figure 8 that could appeared counter-intuitive at first sight.
5.1. Is the water flux recovery relevant to control cleaning efficiency at industrial scale?
Figure 7 shows the variation of both Rm,dose and Rirreversible,residual (equation 4 &5 &6) against
dose and evidenced by Rm,dose variation have clearly a negative impact on both the fouling
ability and the cleanability of PES/PVP UF membrane.
Figure 10 depicts the polynomial relationship between Rm,dose and Rirreversible,residual. It clearly
shows the acceleration in the irreversible fouling not removed by the alkaline cleaning with the membrane degradation (Rm,dose decrease). This is in full agreement with the current intuitive
understanding of increasing difficulty in membrane cleaning with ageing.
y = 2E-13x2 - 4.4636x + 3E+13 R² = 0.993 0.0E+00 5.0E+11 1.0E+12 1.5E+12 2.0E+12 2.5E+12 3.0E+12 3.5E+12 4.0E+12 4.5E+12 5.0E+12
0.00E+00 5.00E+12 1.00E+13 1.50E+13
Rir re ve rs ib le , r es id u al (m -1 ) Rm,dose(m-1) - 30% Rm,0 - 15% Rm,0 - 10% Rm,0 (2000) (917) (417) (250) (83) (0) - 20% Rm,0
<== ageing
Figure 10: Correlation between Rirreversible,residual and Rm,dose compared to several variation of Rm,0 in the range 10%-30% highlighting how compensation between the membrane degradation decreasing Rm,dose and the irreversible fouling increase can hidde the build-up of fouling in a silent mode not detected by simple measurement of water flux.The number into the bracket is the chlorine dose recieved by the membrane for the given Rm,dose.. with 𝑅𝑓,𝑡𝑜𝑡𝑎𝑙=
(equation 5) and
𝑅𝑟𝑒𝑣𝑒𝑟𝑠𝑖𝑏𝑙𝑒+ 𝑅𝑖𝑟𝑟𝑒𝑣𝑒𝑟𝑠𝑖𝑏𝑙𝑒,𝑖𝑛𝑖𝑡𝑖𝑎𝑙 𝑅𝑖𝑟𝑟𝑒𝑣𝑒𝑟𝑠𝑖𝑏𝑙𝑒,𝑖𝑛𝑖𝑡𝑖𝑎𝑙= 𝑅𝑖𝑟𝑟𝑒𝑣𝑒𝑟𝑠𝑖𝑏𝑙𝑒,𝑟𝑒𝑚𝑜𝑣𝑎𝑏𝑙𝑒+
(equation 6) 𝑅𝑖𝑟𝑟𝑒𝑣𝑒𝑟𝑠𝑖𝑏𝑙𝑒,𝑟𝑒𝑠𝑖𝑑𝑢𝑎𝑙
The Rirreversible,residual was compared with fractions of Rm,0 and more especially 10%, 15%, 20%
and 30 % (rectangles in Figure 10). In this study, the accuracy on flux measurements was better than 3%.However, when dealing with industrial scale the current accuracy on permeate flux value is close to 10%. This value is thus used for the discussion. When the water flux recovery after the alkaline cleaning (compared to the pristine membrane) is better than 90%, the hydraulic cleanliness of the membrane is reached and the cleaning efficiency is considered as good.
Consequently, if Rirreversible,residual remained lower than 0.10 x Rm,0 (chlorine dose close to 250
ppm.d at pH= 8.0) no problem would be detected and the next skim milk filtration would be achieved. Indeed, the membrane ageing has started, Rm,dose was lower than Rm,0 and