Publisher’s version / Version de l'éditeur:
Highway Research Record, 128, pp. 1-17, 1966-10-01
READ THESE TERMS AND CONDITIONS CAREFULLY BEFORE USING THIS WEBSITE.
https://nrc-publications.canada.ca/eng/copyright
Vous avez des questions? Nous pouvons vous aider. Pour communiquer directement avec un auteur, consultez la
première page de la revue dans laquelle son article a été publié afin de trouver ses coordonnées. Si vous n’arrivez pas à les repérer, communiquez avec nous à [email protected].
Questions? Contact the NRC Publications Archive team at
[email protected]. If you wish to email the authors directly, please see the first page of the publication for their contact information.
NRC Publications Archive
Archives des publications du CNRC
This publication could be one of several versions: author’s original, accepted manuscript or the publisher’s version. / La version de cette publication peut être l’une des suivantes : la version prépublication de l’auteur, la version acceptée du manuscrit ou la version de l’éditeur.
Access and use of this website and the material on it are subject to the Terms and Conditions set forth at
Performance of city pavement structures containing foamed plastic
insulation
Penner, E.; Oosterbaan, M. D.; Rodman, R. W.
https://publications-cnrc.canada.ca/fra/droits
L’accès à ce site Web et l’utilisation de son contenu sont assujettis aux conditions présentées dans le site LISEZ CES CONDITIONS ATTENTIVEMENT AVANT D’UTILISER CE SITE WEB.
NRC Publications Record / Notice d'Archives des publications de CNRC:
https://nrc-publications.canada.ca/eng/view/object/?id=a3ffb6c4-8eaf-4df0-85bd-972f1356e459 https://publications-cnrc.canada.ca/fra/voir/objet/?id=a3ffb6c4-8eaf-4df0-85bd-972f1356e459
S e r
TH1
N2lr2no.
292 c . 2BLDG
NATIONAL RESEARCH COUNCIL CANADA
CONSEIL NATIONAL DE RECHERCHES
Performance of City Pavement Structures
Containing Foamed Plastic Insulation
by
/
ner, M. D. Oosterbaan,and R. W. Wodman
-
L ] P 3 . P , . ? ' , 'SEP
23
1969
I
KA?'P\AL, r - z .- 'c 2 ,K:% ) Reprinted f r o mHighway Research Record Number 128 (1966) Highway Research Board, Washington, D. C., U. S. A.
Research P a p e r No. 292 of the
Division of Building Research
P r i c e 25 cents
OTTAWA October 1966
L E COMPORTEMENT DE CHAUSSEES RENFERMANT
UN ISOLANT DE PLASTIQUE MOUSSEUX
SO MMAIRE
Cette communication p r 6 s e n t e l e s r 6 s u l t a t s d'une etude s u r l e com-
portement de deux s e c t i o n s d e c h a u s s e e s , longue de cent pieds
chacune, isolges au moyen de de-ax pouces de polystyrolene
mous seux coul6 en place.
Ces sections experimentales f u r e n t
c o n s t r u i t e s
>
Sudbury, Ontario, Canada et l e s donnees ont 6t6
obtenues a u c o u r s d'un s e u l hiver. L'etude a comport6 l a m e s u r e
d e s t e m p e r a t u r e s , d e l a p6netration du gel au moyen du bleu
de mgthylene, d e s soulevements db a u gel, e t des dgflections
apr'es l e d6gel
>
l ' a i d e du deflectom'etre Benkelman.
L1isolant a rgduit l a pengtration du gel d e 35 pouces durant un
hiver dont l'indice de gel s ' e s t chiffr6
5
2, 600 d e g r g s - j o u r s .
De s m e s u r e s de conductivit6 thermique n'ont dhmontr6 aucune
d e t 6 r i o r a t i o n des proprigtgs isolantes du polystyrolene mousseux.
La pgnetration du gel dans l a zone de contr6le fut d ' e n v i r o n
6 5
pouces e t s e c o m p a r e de faqon favorable
l a pengtration anticip6e
p a r l e
"U. S. Corps of E n g i n e e r s " a u moyen de m e s u r e s obtenues
dans une couche de l i a i s o n g r a n u l a i r e sous une piste d'envol
d6blay6e.
Performance of City Pavement Structures
Containing Foamed Plastic Insulation
E . PENNER, R e s e a r c h Officer, Division of Building R e s e a r c h , National R e s e a r c h Council, Ottawa;
M. D. OOSTERBAAN, Construction Engineer, P l a s t i c s Development and Service, Dow Chemical Co., Midland, Michigan; and
R. W. RODMAN, Roads and Drainage Engineer, City of Sudbury, Ontario This paper p r e s e n t s one w i n t e r ' s r e s u l t s of two 100-ft city pavement sections insulated with a 2-in. thickness of extruded polystyrene plas- t i c foam i n Sudbury, Ontario, Canada. The experimental r e s u l t s con- s i s t e d of t e m p e r a t u r e m e a s u r e m e n t s , frost-depth m e a s u r e m e n t s with methylene blue gages, elevation m e a s u r e m e n t s f o r f r o s t heave and Benkelman beam deflections following the thawing period.
The insulation reduced f r o s t penetration by 35 in. during a 2600 degree-day winter. Thermoconductivity m e a s u r e m e n t s showed that no deterioration o c c u r r e d i n the insulating p r o p e r t i e s of the insulation. F r o s t p e n e t r a t i o n i n t h e control a r e a w a s approximately 65 in., which c o m p a r e s favorably with the depth predicted by the U. S. Army Corps of E n g i n e e r s f r o m m e a s u r e m e n t s in g r a n u l a r b a s e c o u r s e beneath snow-cleared a i r p o r t runways.
.THE CONCEPT of thermally insulating frost-susceptible subgrades h a s been used widely on Norwegian r a i l r o a d s s i n c e the turn of the century (1). The practice has been to r e p l a c e frost-susceptible s o i l in the freezing zone with a lgyer of peat blocks o r other highly fibrous m a t e r i a l s . Such m a t e r i a l s usually contain m o r e water than s o i l . When wet peat f r e e z e s a proportionately l a r g e r quantity of latent heat is r e l e a s e d and hence the freezing plane moves downward m o r e slowly. The frostline may a l s o b e attenuated with a d r y insulating l a y e r of high t h e r m a l r e s i s t a n c e placed in the pavement s t r u c t u r e . This is the b a s i s of a technique that has received attention recently.
The f i r s t full-scale field t r i a l s with a d r y insulation using extruded polystyrene plas- tic foam with s u r f a c e skins w e r e described by Oosterbaan and Leonards (2) and Young (3). An e a r l i e r study, which compared predicted and m e a s u r e d f r o s t penetration depths beneath s m a l l concrete s l a b s , a l s o included a s m a l l amount of data on an insulating layer of cellular g l a s s
(5).
The desirability of d e c r e a s i n g frostline penetration in highways and s t r e e t s in a r e a s of seasonal f r o s t a r i s e s because the design pavement thickness, based s t r i c t l y on load- c a r r y i n g capacity, is usually l e s s than the thickness required to prevent f r o s t penetra- tion into the subgrade. Consequently, detrimental f r o s t action ensues if the subgrade is frost-susceptible.
If an insulating m a t e r i a l is embodied in the pavement s t r u c t u r e i t should retain i t s t h e r m a l r e s i s t a n c e over the lifetime of the road in spite of a varying m o i s t u r e r e g i m e i n the surrounding m a t e r i a l . F u r t h e r , the insulating l a y e r should not i n t e r f e r e signifi- cantly with the stability of the pavement s t r u c t u r e , e i t h e r because of the flexible n a t u r e of the insulation o r by creating an unfavorable water condition in the other components of the road.
The amount of insulation r e q u i r e d will depend on the type of pavement s t r u c t u r e , the t h e r m a l constants of the various l a y e r s , and the climate. As t h e r e a r e s o m e difficulties
Paper sponsored by Committee on Frost A c t i o n and presented a t the 45th Annual Meeting.
associated with the prediction of r e l i a b l e t h e r m a l patterns in pavement s t r u c t u r e s , field t r i a l s have been initiated.
In the p r e s e n t paper the r e s u l t s of one winter's observations a r e given for two s t r e e t sections i n the City of Sudbury insulated with extruded polystyrene plastic foam with s u r f a c e skins. The project was a joint undertaking by Dow Chemical of Canada Ltd., the City of Sudbury, and t h e Division of Building R e s e r a c h of the National Research Council of Canada.
CONSTRUCTION AND INSTRUMENTATION
Insulated sections w e r e constructed a t two locations in Sudbury, on Antwerp and Byng S t r e e t s , which w e r e unpaved s t r e e t s s l a t e d f o r reconstruction and surfacing. F i g u r e 1 shows a plan view of both the insulated and control sections on Antwerp Street. The 100-ft insulated section was 3 5 ft wide and extended beneath t h e e a s t sidewalk o v e r most of i t s length and to the edge of the sidewalk on the west s i d e . L e t t e r s A to G give the seven thermocouple locations; the c i r c l e d numbers a r e t h e locations of the f r o s t - depth gages.
A s i m i l a r plan view shows the Byng S t r e e t location (Fig. 2 ) . T h i s s i t e was i n s t r u - mented with frost-depth gages only. T h e insulated a r e a was 108 f t long ahd 3 5 f t wide. Again, the insulation extended underneath the proposed sidewalk a r e a on t h e e a s t s i d e but the sidewalk was not constructed before the f i r s t w i n t e r ' s observations.
F i g u r e s 3 and 4 show c r o s s - s e c t i o n s of the pavement s t r u c t u r e and thermocouple depths f o r both the insulated and control a r e a s on Antwerp Street. The pavement de- sign on the e a s t half of Antwerp S t r e e t consisted of 3% in. of asphaltic concrete, 3 in. of "A" base m a t e r i a l , 9 in. of "B" subbase and 2 in. of insulation. On the west half, an additional 7 in. of "B" subbase was placed below the insulation. The control a r e a
386 390
& 394
Figure 1. Plan o f insulated and control section o n Antwerp Street w i t h locations o f thermocouples and frost-depth gages.
----
lo Lorne Ave + /8" Sanitary Sewer
Control Area
Figure 2. Plan v i e w o f insulated and control areas on Byng Street showing l o c a t i o n o f frost depth.
XI' WEsT E A S T 14' 10" I Sidewalk DNew Sidewalk E
-
Subgrade 9'6"I-
15' 20' at 6' 6" Depth I I - 1 - I1
cri
Thermocouple Locations A, 0, C, D & E8" Sanitary Sewer
at 12' Depth
Figure 3. Pavement design and thermocouple locations o f insulated section a t Station 5+41, A n t w e r p Street.
w a s uniform on both s i d e s consisting of 3% in. of asphaltic concrete, 3 in. of "Aw b a s e c o u r s e , and 18 in. of "B" subbase.
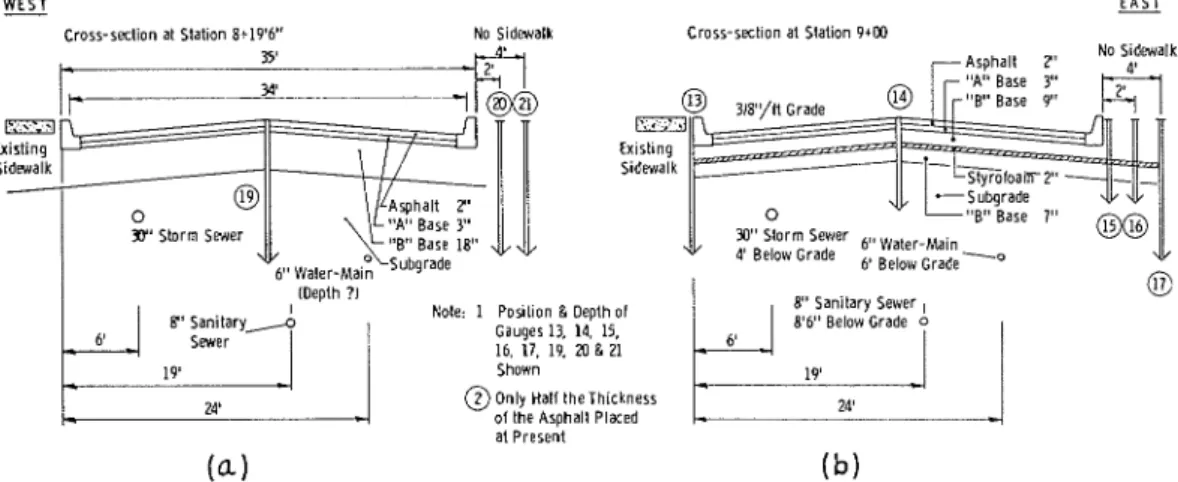
C r o s s - s e c t i o n s of the pavement s t r u c t u r e on Byng S t r e e t a r e shown in F i g u r e s 5a and 5b. The pavement design of 3% in. of asphaltic concrete, 3 in. of "A" b a s e c o u r s e
I 6" C. I. W a t e r - M a i n -$ at 6'6" Depth
I---I
T h e r m w u p l e Locations F L G 8" S a n i t a r y Sewer at 1P DepthFigure 4. Pavement design and thermocouple locations of control section at Station 6+10, Antwerp
,
Street.
E A S T C r o s s - s ~ l i o n at Station 8'19'6" No Sidwalk C r o s s - s ~ l l o n al Slation 9 + M
-. .
30" Slorm Sevier 6,, Water.Main 4' Below Grade 6, Below Grade
- 0
(Depth ?I
Nole: 1 Posilion & Depth ol 8" Sanilary Sewer I
B' Sanitary/ Gauges 13. 14. 15.
16. 17. 19. i0 & 21
19' Shown
24' @ O n l y Half IheThickness of the Asohalt Placed at Present
( b l
Figure 5. Cross-section of insulated and control areas on Byng Street showing pavement structure and locations of frost-depth gages.
and 1 8 in. of "B" subbase was based on the standard p r a c t i c e of the City of Sudbury f o r the subgrade s o i l s a t both locations. Only 2 in. of asphaltic concrete was placed a t Byng S t r e e t p r i o r to freeze-up. The remaining 1% in. was scheduled f o r place- ment in the s u m m e r of 1965.
Frost-Depth Gages
718" OD 518" l D T h e frost-depth gages (Fig. 6) w e r e of
Swedish design, the details of which have been published (5). Briefly, the gage con- s i s t s of two telescoping lucite tubes. The
19132" OD 112" l D inner plastic tube contains a soft rubber tube and the annulus between the r u b b e r
tube and plastic outer tube is filled with a n aqueous solution of methylene blue. The thin annulus of solution can expand easily on freezing by c o m p r e s s i n g the i n n e r rubber tube. The outer tube, an- chored a t t h e s u r f a c e , can move vertically in c a s e of heave o r settlement without damaging the gage. The gages w e r e r e a d weekly to follow the p r o g r e s s of the f r e e z - ing plane by this method.
Thermocouple Installation
Fifty 20-gage copper-constantan t h e r -
W mocouples w e r e installed on Antwerp
S t r e e t ( F i g s . 3 and 4) and connected to a Figure 6. Frost-depth gage. panel located in the basement of a house
adjacent to the experimental a r e a . Twenty thermocouples w e r e connected to a suitably preamplified millivolt r e c o r d e r f o r continuous m e a s u r e m e n t s and the remaining thirty w e r e r e a d e i t h e r daily o r weekly depending on the depth of installation. In m o s t c a s e s the thermocouples located in the upper s t r a t a of the pavement and above the insulation were connected to t h e r e c o r d e r ; the lower ones w e r e r e a d with a standard manually operated potentiometer. An automatic t h e r m o e l e c t r i c i c e bath was u s e d a s a r e f e r e n c e t e m p e r a t u r e .
A Stevenson s c r e e n containing a thermograph was installed on the Antwerp S t r e e t s i t e f o r a i r t e m p e r a t u r e m e a s u r e m e n t s .
F r o s t Heave Measurements
Elevations a t the tops of the frost-depth gages w e r e determined weekly to m e a s u r e f r o s t heave. E v e r y t h r e e weeks, elevations w e r e determined on the s u r f a c e of the road on a 20-ft g r i d s y s t e m .
Site P r e p a r a t i o n
Site preparation f o r the placing of the extruded polystyrene insulation b o a r d s (2 f t by 4 f t by 2 in.) was to fine g r a d e and hand r a k e the s u r f a c e . The panels, placed i n a staggered fashion, w e r e held in place with 6-in. wooden dowels. No attempt was made to s e a l the c r a c k s between adjacent boards. The subbase was end-dumped f r o m t r u c k s and then bladed o v e r the insulation by t r a c k vehicles riding on a n 8-in. cushion of the subbase m a t e r i a l .
The Byng S t r e e t experimental s i t e had a gentle upward slope of 1 . 5 p e r c e n t f r o m south to north. On Antwerp Street, the slope was about 4 p e r c e n t in t h e s a m e direction.
TABLE 1 The e a s t s i d e of t h e pavement w a s about
GRADING RE Q U W M E N T S 6 in. lower than the w e s t s i d e a t both lo-
c a t i o n s . This had s o m e b e a r i n g on t h e
Percent Passing d r a i n a g e and deflection p a t t e r n of both
Tyler Screen
t e s t s e c t i o n s .
Size "A" Base Modified Granular Openings Course ''B" Subbase
BASE -COURSE MATERIALS AND SOILS
4 in. 2% in. 1 in.
78
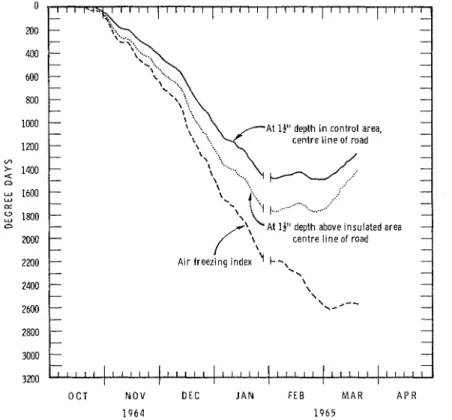
in. "/, in. No. 4 No. 8 No. 14 No. 28 No. 48 No. 100 No. 200 T h e p a r t i c l e - s i z e g r a d i n g r e q u i r e m e n t s f o r both t h e "A" b a s e c o u r s e and "B" s u b -b a s e m a t e r i a l s a r e given i n T a b l e 1. T h e s e
w e r e compacted i n a c c o r d a n c e with t h e u s u a l p r a c t i c e followed by t h e City of Sudbury.
As both i n s t a l l a t i o n s w e r e built o n p r e - viously unpaved s t r e e t s , t h e f i r s t few f e e t of m a t e r i a l below t h e s u r f a c e v a r i e d con- s i d e r a b l y . Although i t w a s hoped t h a t the insulation on the e a s t half of Antwerp S t r e e t could b e placed d i r e c t l y on n a t u r a l
TABLE 2
SOIL TEST DATA ON ANTWERP STREET PRIOR TO PRESENT CONSTRUCTION September 14, 1964
Hole 1, Station 5+45, 6 f t west of centerline Hole 2, Station 4+96, 2 f t west of centerline Hole Depth
(f t) Description
1 0-2
-
- - - Sandy gravel fill with slag and ashes; dry.2-4 22.3 - -
-
As above to 2. 5 ft, then brown silty fill to3.9 ft, then 1 in. peat, then dense brown silt.
4-5.7 22.0 22.7 22.1 125 Brown cohesive sand s i l t with numerous
oxidized stains. Hit obstruction a t 5.7 ft. lvIove r i g 2 ft.
6-8 22.6
-
- - Erown moist silt.8-10 18.6 25.3 19.3
-
Brownish grey, stratified, fissured co-hesive silt. Could not jack sample. Silt partings a t frequent intervals.
2 0-2
-
-
-
- Dry sandy gravel fill with slag and ashesto 20 i n . , then brown clayey silt.
4-6 20.1
-
--
Grey and brown c o a r s e s i l t , very moist4.5 to 4.7 ft.
8-10 21.8 - -
-
Dense brown silt, thin clay s e a m s , moistonly.
ffl s
.-
- L ffl + C U ffl .+:
0, u X Isubgrade soils, t h i s was in f a c t not the c a s e . At the Antwerp s i t e , the upper few f e e t consisted of f i l l m a t e r i a l of s l a g and a s h e s mixed with s i l t . Grain-size c u r v e s f o r s a m p l e s of the subgrade below 39 in. a r e given in F i g u r e 7. These show 1 8 t o 26 p e r - cent in the clay s i z e s , m o s t of the remaining percentage in the s i l t s i z e , and a s m a l l amount of fine sand. The m o i s t u r e contents ranged f r o m 1 7 t o 22 p e r c e n t by weight just before construction. T e s t r e s u l t s and a description of t h e s o i l s on A n t w e r p s t r e e t a r e given in Table 2.
The Byng S t r e e t installation w a s constructed on a previously filled low-lying swampy a r e a . Again, the upper m a t e r i a l s consisted of a s l a g - a s h f i l l intermixed with s i l t s . Below 3 f t the organic r e s i d u e s and s i l t s w e r e too soft t o s a m p l e with a hand a u g e r .
RESULTS A i r T e m p e r a t u r e and F r e e z i n g Index
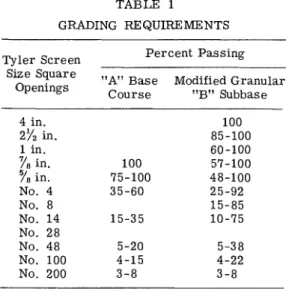
The air freezing index based on degree-days F , calculated f r o m thermograph mea- s u r e m e n t s on the s i t e , was 2600 (Fig. 8). The a v e r a g e f o r 1954-1960 a t the Sudbury a i r p o r t 12. 5 m i l e s NE of t h e city was 2387.
T h e design f r e e z i n g index f o r the a r e a is 3200 d e g r e e - d a y s (6). The freezing index was 1770 degree-days a t a depth of 1% in. in the asphaltic c o n c r e t e over t h e insulated a r e a and 1500 a t t h e s a m e depth in the control a r e a . T h i s g i v e s an "n-factor" of 0.68 f o r the insulated a r e a and 0. 58 f o r the control a r e a .
Subsurface T e m ~ e r a t u r e s
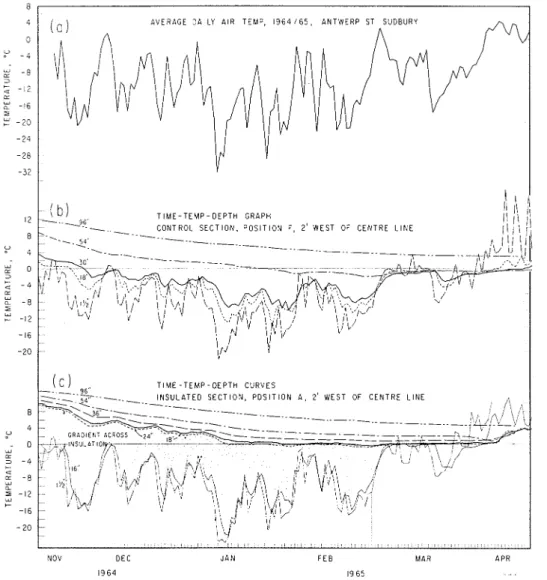
T h e a v e r a g e daily a i r t e m p e r a t u r e s a r e shown i n F i g u r e 9a f o r t h e winter of 1964-65. F i g u r e s 9b and 9c show the t e m p e r a t u r e s a t v a r i o u s depths (2 f t off centerline) of the control a r e a and insulated a r e a respectively. The shaded a r e a g i v e s the t e m p e r a t u r e .difference a c r o s s the 2 in. of insulation.
MOO 3200 I O C T N O V DEC J A N FEE M A R A P R 1 9 6 4 1 9 6 5 1 0 1 1 1 1 1 1 1 1 1 1 1 l - - - - - -
-
- - - - - - - - --
--
--
At 11" depth in control area, -- centre line of road -
- - - - -
-
,,,.,... ."'",'...,,,.,.. '2 - - - - - --
- Air freezing index k-,.
- \ - \ - - \
-
- - \\,+,-- - - - - - --
- - - 1 1 1 1 1 I I I I I 1 1 1 1 1 1 1 1 1 1-
- - ,$-9. T I M E - T E M P - D E P T H GRAPH \ CONTROL S E C T I O N , P O S I T I O N F, 2' W E S T OF C E N T R E L I N E.
---\.. " . . 54 1. ----.._.._.- T I M E - T E M P - O E P T H CURVES ----..__. - - ? . , , , , , , , , ,NOV DEC J A N F E E MAR APR
1964 1965
Figure 9. A i r and ground temperatures on Antwerp Street.
When the soil and a i r temperature r e c o r d s were started, on November 16, 1964, a l l the material above the insulation was frozen. The 0-deg C isotherm did not reach the 18-in. level in the control a r e a until the end of November.
Thermal response of the base-course materials to a i r temperature was much more rapid above the insulation than a t s i m i l a r depths in the control section. This particular feature i s shown by the s m a l l differences between the temperature a t 1% in. and 16 in. The differences were usually much g r e a t e r i n the control a r e a (Fig. 9b).
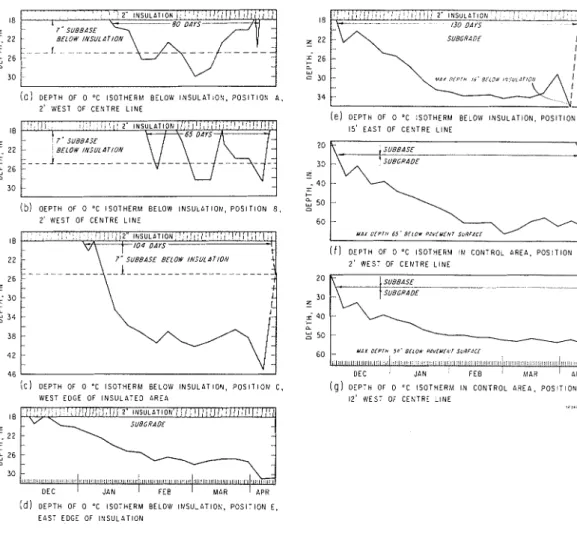
The frostline, based on the depth of the 0-deg C isotherm, was below the insulation f o r 80 days a t position A, 2 ft west of centerline. The maximum penetration-12 in. below the insulation-was on March 2, 1965 (Fig. 10a). The minimum temperature just beneath the insulation a t this position was -0.9 C on February 28, 1965. The average temperatures were +O. 8 C during January, -0.45 C during February, and -0.15 C dur- ing March. At the top of the natural subgrade s o i l the minimum temperature was -0.4 C .
AtpositionB, 12 f t west of centerline (3 ft from the west edge of the insulation), the period of f r o s t penetration was 65 days (Fig. lob). The maximum penetration was 9 in. a t this position OP. March 2, 1965. The minimum temperature just beneath the insula-
tion a t this point was -0.3 C on March 2, 1965. The average temperature at this point during February and March was about 0 C.
2' INSULATION 1: . ' I 1 1 I 8 0 DAYS- I I ( 0 ) D E P T H OF 0 'C I S O T H E R M BELOW I N S U L A T I O N , P O S I T I O N A . 2' W E S T OF C E N T R E L l N E I B " I i - '7. SUBBASE ( b ) OEPTH OF 0 'C I S O T H E R M BELOW I N S U L 4 T I O N . P O S I T I O N 8 . 2 ' W E S T O F C E N T R E L l N E 1 0 4 DAYS 2 2 7' SUBB4SE BELOW l / i S U L 4 I / O N 2 6 z - ( c ) D E P T H OF 0 'C I S O T H E R M B E L O W I N S U L A T I O N , P O S I T I O N C, WEST EDGE O F I N S U L A T E D A R E A 130 DAYS 3 I SUBGRIDE I I I ( e l D E P T H OF o 'C I S O T H E R M BELOIV INSULATION, P O S I T I O N O. 15' E A S T OF C E N T R E L l N E i f ) D E P T H OF 0 'C I S O T H E R M I N C O N T R O L 4 R E A . P O S I T I O N F , 2 ' VIEST OF C E N T R E L I N E 2 0
'
su88dsf _____-_..- --WOE
- - 3 0 I I - F E E'
hlAR 4 P R ( g ) D E P T H OF 0 'C I S O T H E R M I N C O N T R O L A R E A , P O S I T I O N G , 12' W E S T OF C E N T R E L l N E ,a,.;, , 3 0 ( d l D E P T H OF 0 "C I S O T H E R M BELOW I N S U L A T I O N , P O S I T I O N E, E A S T EDGE OF I N S U L 4 T I O NFigure 10. Frost penetration on Antwerp Street.
D i r e c t l y below the w e s t edge of t h e insulation (position C ) , t h e period of f r e e z i n g b e - low t h e insulation w a s 104 d a y s and t h e m a x i m u m f r o s t penetration w a s 27 in. ( F i g . 10c). F o r t h e e a s t half of t h e s t r e e t t h e insulation w a s placed d i r e c t l y on t h e s u b g r a d e ; t h e t h e r m o c o u p l e positions i n t h i s a r e a w e r e D and E . At position D (which is a t the curb- line on t h e e a s t s i d e , 5 f t i n f r o m t h e e a s t edge of t h e insulation) t h e p e r i o d of f r o s t penetration below t h e insulation w a s o v e r a l o n g e r period and t o a g r e a t e r depth than a t a c o m p a r a b l e position on t h e w e s t s i d e ( F i g s . l o b and 10e). T h i s a s p e c t is d i s c u s s e d in d e t a i l l a t e r i n t h i s p a p e r .
The depths of t h e 0-deg C i s o t h e r m f o r t h e two positions i n t h e c o n t r o l s e c t i o n a r e given in F i g u r e s 10f and l o g . T h e m i n i m u m t e m p e r a t u r e a t the 18-in. depth w a s - 1 4 C on J a n u a r y 30, 1965. The m i n i m u m t e m p e r a t u r e a t t h e 30-in. depth w a s -10 C on F e b r u a r y 4, 1965. The m a x i m u m f r o s t penetration a t t h i s point w a s 65 i n .
C o m ~ a r i s o n of F r o s t - D e ~ t h G w e s with Z e r o I s o t h e r m s
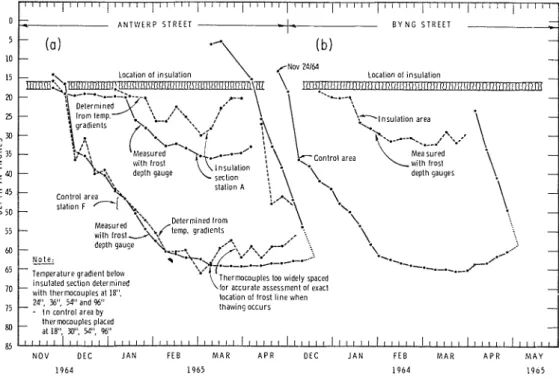
F i g u r e l l a g i v e s t h e c o m p a r i s o n of f r o s t l i n e depth a s a function of t i m e b e t w e e n g a g e m e a s u r e m e n t s and t h o s e e s t i m a t e d f r o m t e m p e r a t u r e g r a d i e n t s . T h e c o m p a r i s o n is f a v o r a b l e i n t h e c o n t r o l a r e a a s long a s t h e f r o s t l i n e w a s actively penetrating down- w a r d s . In t h e i n s u l a t e d a r e a s t h e g a g e s indicated a g r e a t e r p e n e t r a t i o n ( a v e r a g e of 5. 5 in.) than did t e m p e r a t u r e m e a s u r e m e n t s when t h e f r o s t l i n e w a s in t h e vicinity of t h e insulation. T h i s is p e r h a p s not unexpected s i n c e the t h e r m a l conductivity of the plastic g a g e is much g r e a t e r than that of the insulation.
85
N O V DEC JAN FEB M A R APR DEC J A N FEB M A R APR M A Y
1964 1965 1 9 6 4 1 9 0 5
-~
: / I l l , p i , : /- -
ANTWERP STREET
I
-
B Y N G STREET + -- (a) - - (b)
-
Measured with fro81 depth gauges temp. gradients - ,... Note:-.-
-Temperature gradlent below
--.-.--.-
,-
-
-insulated secllon delermined
- Thermocouples t w ividely spaced
ivilh thermocouples at 18". for accurate assessment of exacl - 24". 36". 54" and 96" location of frost lhnevihen -
- I n control area by lhaiving occurs thermocouples placed
a1 18". 33". 56". 96" -
/ 1 1 1 1 1 t I t I I l I t I l l I ~ I I I I I I I ~ l I I I I I I I I I I I t I l I I l I I I I I I I I l I t I I I , l l t , l l l l l t
Figure 11. Frost depth determinations w i t h frost-depth gages and temperature measurements.
T h e r e was a l s o poor agreement toward the end of the freezing period when the f r o s t - line was receding in the control a r e a . A p a r t of the disagreement r e s u l t s f r o m estimat- ing the freezing plane f r o m widely spaced thermocouples, particularly when thawing was occurring both f r o m the top and the bottom of the frozen layer. During the active thawing period the frozen layer was too c l o s e to z e r o d e g r e e s to estimate accurately the location of the freezing plane f r o m t e m p e r a t u r e gradients.
F r o s t penetration a s m e a s u r e d by frost-depth gages on Byng S t r e e t is shown in Fig. l l b . The depth of freezing was about the s a m e (65 in.) as on Antwerp Street in the con- t r o l a r e a . The f r o s t penetration c u r v e beneath the insulation shows a trend s i m i l a r to that a t the Antwerp S t r e e t location. No t e m p e r a t u r e m e a s u r e m e n t s w e r e c a r r i e d out a t t h i s s i t e , but consideration of the difference between the gage and thermocouple f r o s t depths indicates that the actual f r o s t penetration was about 27 in. (9 in. below the insulation).
F r o s t Heave Measurements
F i g u r e 12 gives the r e s u l t s of s u r f a c e elevation m e a s u r e m e n t s on Antwerp Street. T h e f i r s t m e a s u r e m e n t s (January 21) showed s o m e settlement in the insulated a r e a . By this date the control a r e a had heaved a maximum of 0 . 3 ft i n one spot, but in g e n e r a l the heave was l e s s than 0 . 2 ft. By F e b r u a r y 20, 7 in. of f r o s t penetration had o c c u r r e d beneath the insulation a t the centerline. T h e w e s t s i d e (with t h e additional 7 in. of sub- base beneath the insulation) showed no heaving; the e a s t s i d e (without t h e additional sub- base) had heaved 0 . 1 ft, and a t a position 2 f t off centerline i t was slightly l e s s . A s shown, additional heaving o c c u r r e d i n March but by April 12 the pavement in the in- sulated a r e a was back to i t s original position.
At the Antwerp S t r e e t location, heaving was g r e a t e s t on the e a s t side, w h e r e d r a i n - age conditions w e r e known to be poor, and l e a s t on the west side. The average heave i n the insulated a r e a was one-third to one-half of the heave in the a r e a s to t h e north and south.
The heaving pattern was the s a m e on Byng Street (Fig. 13). Heaving was greatest in the central a r e a s beyond the ends of the insulated section and the onset of heaving in the insulated a r e a was consistent with the time of f r o s t penetration of the insulationand the underlying subbase. More heaving occurred on the e a s t side, where drainage con- ditions were poor, than on the west side. Again, the average heave in the insulated section was about one-half of the heave in the control a r e a s .
Prediction of F r o s t Penetration Depth
The variable material in <he subgrade at both locations reduced the possibility of obtaining meaningful theoretical frost-depth predictions-even for the center of the road where one-dimensional heat flow might be anticipated. It i s of interest, however, to compare the f r o s t depth measured in the control section with the design curve for f r o s t penetration obtained by the U. S. Army Corps of Engineers
(7)
from measurementsTABLE 3
ASSUMED PROPERTIES FOR FROST PENETRATION PREDICTION, ANTWERP STREET Freezing Index, 1500 and 2600 degree-days F ; F r e e z e Time, 126 days; Mean Annual Temperature, 37 F
Water Thermal Volumetric Heat Latent Heat Layer Thickness, Content, xv D ( " l ~ ~ ~ ~ ; ~ d Conductivity, k
(ft) Capacity, c of Fusion, L
($) (BTU/ft-hr-deg F ) (BTU/CU ft-deg F ) (BTU/cu ft)
Asphalt 0. 29 0 143
"A" base 0. 25 6 . 0 13 5
"B" base 1. 50 8.0 130
Subgrade 2 2 . 7 102
Z
ost depth gauge location
W E S T O F O F R O A D E A S T O F O F R O A D
Figure 14. Cross-section of temperature pattern i n insulated roadsection (5+41) anddepth o f frost pene- tration i n insulated and control section, Antwerp Street, January 12, 1965.
in g r a n u l a r base c o u r s e s beneath c l e a r e d a i r p o r t runways and by the prediction based on the Modified B e r g g r e n Method.
F o r a 2600 degree-day freezing index (based on a i r t e m p e r a t u r e m e a s u r e m e n t s on the Antwerp s i t e ) the design c u r v e p r e d i c t s 65 to 70 in. of f r o s t penetration; the Modi- fied Berggren Method predicts 81 in.
(8).
This c o m p a r e s favorably with the experi- mental value of 65 in. in the control a r e a (2 ft west of centerline). F o r a 1500 degree- day freezing index the Modified B e r g g r e n Method p r e d i c t s a f r o s t penetration of s o m e 63 in. The s o i l p r o p e r t i e s used in this calculation a r e given in Table 3.Maximum f r o s t penetration 2 ft west of centerline i n the insulated a r e a was 30 in. F o r this type of pavement, depth to insulation, and climatic conditions, 2 in. of this insulation attenuated f r o s t penetration by s o m e 35 in.
Soil T e m p e r a t u r e P a t t e r n and Edge Effects
A weekly t e m p e r a t u r e pattern was plotted f o r the control section (at Station 6+10) and the insulated section (Station 5+41) on Antwerp S t r e e t t o follow t h e t h e r m a l changes i n the ground. F i g u r e 14 shows such a graph f o r January 12, 1965. The t h e r m a l pat- t e r n is not only influenced by the insulation but obviously a l s o by snow-clearing p r a c - t i c e s . The e a s t s i d e of the roadway was a l s o m o r e shaded than t h e west side. These f a c t o r s , i n addition to the variability of t h e subgrade, ruled out t h e possibility of mak- ing meaningful comparisons between the t h e r m a l edge effects observed with theoreti- cally computed values.
One anomaly was the e a r l i e r and deeper f r o s t penetration of the insulation 1 5 f t e a s t of center (location D) than a t location B , 12 f t west of centerline. F i g u r e 14 shows t h e t e m p e r a t u r e a t 18 in. (directly below the insulation) to be above freezing a t A (2 f t w e s t of centerline) and a t B (3 f t f r o m the west edge of t h e insulation), but -1. 8 C a t D, which was 5 f t f r o m the e a s t edge of the insulation. T e m p e r a t u r e distributions of this type p e r s i s t e d during the e n t i r e winter but w e r e m o s t m a r k e d during the period when the frostline was actively progressing downward. At the t i m e of maximum f r o s t penetra- tion the frostline was 4 in. deeper a t D than a t A. T h i s was not a t e m p e r a t u r e m e a s - u r e m e n t e r r o r because the methylene blue frost-depth gages a l s o showed a s i m i l a r trend as can b e observed f r o m F i g u r e 14. Based on t e m p e r a t u r e m e a s u r e m e n t s , the period when freezing occurred beneath the insulation was about 130 days a t D and only about 65 days a t B
.
During construction i t was noted that the drainage was poor on the e a s t s i d e and, following a heavy r a i n during construction, the d e s i r e d compaction was difficult to ob- tain. The poor compaction r e s u l t e d in g r e a t e r pavement deflections as will be shown l a t e r . The subbase and subgrade m a t e r i a l s w e r e sampled f o r m o i s t u r e content imme- diately a f t e r thawing a t locations A and D. The subbase a t t h e center of t h e road had a n average m o i s t u r e content of 6 percent. At D the subbase was completely s a t u r a t e d ,
as water was s e e n to r i s e i n boreholes above the depth of t h e insulation.
Because the t h e r m a l conductivity of s o i l s i n c r e a s e s with m o i s t u r e content, the dif- f e r e n c e s noted i n the cooling r a t e between the c e n t e r of the road and the e a s t s i d e m i g h t be attributed in p a r t t o the influence that m o i s t u r e content h a s on heat conduction. It was deemed desirable, however, to inspect t h e insulation and to m e a s u r e i t s m o i s t u r e content and t h e r m a l conductivity. A 2-ft-wide trench was excavated f r o m the c e n t e r - line to t h e e a s t edge of the insulation in e a r l y June and s a m p l e s of t h e insulation w e r e removed f r o m t h e center and e a s t s i d e of t h e installation n e a r the position of the t h e r - mocouples a t Station 5+41. In the a r e a where poor compaction was obtained beneath the insulation s o m e of the panels had hairline c r a c k s which w e r e attributed to poor sub- g r a d e support.
Evaluation of Antwerp S t r e e t Insulation After Nine Months1 Service
Two s a m p l e s , approximately 14 in. s q u a r e , w e r e taken f r o m two insulation panels n e a r the center of the road (location A), and two m o r e w e r e taken between locations D and E which were in the "wet" zone. The samples were sealed in polyethylene bags f o r transportation and f o r the t h e r m a l t e s t s .
Thermal conductivities w e r e determined on a guarded hot plate apparatus 12 in. s q u a r e a t a mean temperature of 75 F and a t a t e m p e r a t u r e difference of 40 deg.
The measured average K value of panels 1 and 2 near the center of the road was 0.23 (BTU-in.)/(sq ft/hr/deg F ) . The s a m p l e s w e r e then r e v e r s e d with r e s p e c t to hot and cold sides and the conductivity values w e r e redetermined. The measured K was 0.23. Since stone indentations made a somewhat unsatisfactory t h e r m a l contact with the plate, the outside portions of the insulation w e r e shaved off to leave a 1-in. thickness of in- sulation. T h i s was oven-dried to constant weight and i t s K value in the dry s t a t e was determined to be- 0.24. The moisture content of panel 1 was 22.8 percent by weight o r 0 . 7 7 percent by volume. Its m e a s u r e d d r y density was 2 . 1 lb/cu ft. The moisture content of panel 2 was 11. 6 percent by weight, 0.43 percent by volume and i t s density was 2.28 Ib/cu ft.
Panels 3 and 4 from the wet a r e a (east side) had an average t h e r m a l conductivity of 0.25 before drying. The average moisture content of panel 3 was 4 . 7 percent by weight and 0.16 percent by volume when tested in the wet state. The center 1%-in. layer had a moisture content of 2. 63 percent by weight (0.092 percent by volume). It i s con- cluded that the unusual heat flow pattern observed on the e a s t side of Antwerp Street was not due to any change in the t h e r m a l conductivity of the insulation.
Benkelman Beam Rebound Measurements
Deflection m e a s u r e m e n t s by the Ontario Department of Highways w e r e made 6 to 8 f t i n f r o m the c u r b a t intervals on both the control and insulated sections under 9000-lb dual loads. The deflection f o r the particular section given i n Table 4 is an average of five. This information i s a l s o shown i n F i g u r e 15.
The deflections w e r e g r e a t e r f o r the insulated sections a t both locations. At Antwerp Street the g r e a t e r deflections on the e a s t s i d e f o r both control and insulated a r e a s a r e considered to b e the r e s u l t of poor subgrade support and inadequate drainage. On the west side the deflections of the insulated section w e r e 0.005 to 0.010 in. g r e a t e r than the deflections of the control section. The mean f a l l deflection of 0. 035 in. i s con- s i d e r e d quite tolerable for this s t r e e t . T h e r e was a l s o an additional 6 in. of subbase on the west side.
At the Byng Street location the increased deflection of the insulated section i s con- s i d e r e d to be the r e s u l t of two factors.
One, the pavement s u r f a c e is 2 in. of asphaltic concrete. This relatively thin s u r - f a c e may not be adequate to distribute the loads to an acceptable amount a t the depth of the insulation.
TABLE 4
AVERAGE BENKE LMAN BEAM DE F LE C TIONS
,
INCHE S Antwerp Street Byng Street Date Insulated Control Insulated ControlE a s t West E a s t West E a s t West E a s t West April 22, 1965 May 19, 1965 June 3, 1965 June 17, 1965 June 30, 1965 July 14, 1965 July 27, 1965 August 12, 1965 August 24, 1965
0 E - l n s u l a t e d o E - C o n t r o l 0 W - l n s u l a t e d o W - C o n t r o l Y 0--- [email protected]*- a---
--
0---- .-*---.* 40 ---:--o- @~-Q,--- -m 8-: ----+--- o---o-- ---8+Q---
--o----o 20 A N T W E R P S T , S U D B U R Y , O N T . 1 0 0 80 7' 6 0 - 0 Ar
4 0 - Z-
2 0 -5
0 I I I1
A P R I L M A Y J U N E J U L Y A U G U S T 1 9 6 5 I --
e-e+: - **.a,.--"
8=:::------
0 '\\, ----_ --_
0----O--- ----
, -8====---~~~~~8 - o--- B Y N G S TFigure 15. Benkelman beam deflections on A n t w e r p and Byng Streets.
Two, the f r o s t penetration into the upper 9 in. of the subgrade s o i l h a s been slow enough to c r e a t e a large amount of ice lensing (0. 10-ft s u r f a c e heave f o r 9 in. f r o s t penetration, compared with 0.24-ft s u r f a c e heave f o r 40 in. f r o s t penetration into the subgrade i n the control section, based on frost-depth gage measurements).
These i c e l a y e r s subsequently r e l e a s e d a l a r g e amount of m o i s t u r e into the subgrade s o i l a t the end of freezing which would lower the bearing capacity of the normally weak subgrade. F u r t h e r m o r e , the s m a l l e r slope on this s t r e e t attenuated drainage of this e x c e s s moisture. This factor is considered to be the most significant and is most probably the cause of the large deflections of the insulated section on Byng Street.
Minimum rebound values in the f a l l of the y e a r w e r e estimated a t 20 to 30 for the control sections a t both s t r e e t s . F o r the insulated sections, 40 and 50 a r e estimated for Antwerp and Byng Streets, respectively.
C ONC LUSIONS
F o r the conditions a t Sudbury, Ontario, 2 in. of the particular insulation used at- tenuated 35 in. of f r o s t penetration during a winter when the a i r freezing index ap- proached the design value. This insulating l a y e r a l s o reduced the amount of heave by one-half to two-thirds of that m e a s u r e d i n an uninsulated pavement.
Poor drainage conditions a t the e a s t s i d e of the installations caused g r e a t e r f r o s t penetration, large pavement deflections in the Benkelman beam t e s t , and eliminated the possibility of obtaining meaningful r e s u l t s on t h e r m a l effects a t the edge of the insulation.
The methylene-blue frost-depth gages a r e a c c u r a t e in uninsulated sections. In in- sulated sections the gage predicts f r o s t penetrations that a r e too large.
The t h e r m a l p r o p e r t i e s of the insulation w e r e unaffected by 9 months' exposure to s e v e r e moisture conditions.
Benkelman beam deflection t e s t s showed that the insulated sections had somewhat l a r g e r deflections. Where the asphaltic concrete s u r f a c e w a s 3% in. the deflections i n the insulated section w e r e 0.005 to 0.010 in. m o r e than deflections of the control s e c - tion. The estimated mean f a l l rebound values in the insulated a r e a (0.040 to 0.050 in.) a r e considered tolerable. On Byng Street the l a r g e rebound values in the insulated section a r e considered a r e s u l t of the relatively large amount of i c e lens formation i n the top of the subgrade and the thin (2 in.) asphaltic concrete surface.
ACKNOWLEDGMENTS
The authors wish to e x p r e s s t h e i r appreciation to the Ontario Department of High- ways f o r carrying out the Benkelman beam measurements. This paper i s a joint con- tribution f r o m The Dow Chemical Company, Midland, Michigan; the City of Sudbury; and the Division of Building R e s e a r c h , National R e s e a r c h Council, Canada.
REFERENCES
Skaven-Haug, Sv. Protection Against F r o s t Heaving on the Norwegian Railroads. Ge'otechnique, Vol. 9, No. 3, pp. 87-106, 1959.
Oosterbaan, M. D.
,
and Leonards, G. A. Use of an Insulating Layer to Attenuate F r o s t Action in Highway Pavements. Highway Research Record 101, pp. 11- 27, 1965.Young, F . D. Experimental Foamed P l a s t i c B a s e Course. Highway R e s e a r c h Record 101, pp. 1-10, 1965.
Quinn, W. F . , and Lobacz, E . F. F r o s t Penetration Beneath Concrete Slabs Maintained F r e e of Snow and Ice, With and Without Insulation. Highway Re- s e a r c h Board Bull. 331, pp. 98-115, 1962.
Gandahl, R. Bestzmning av Tj%lgr'hs-I Mark Med Enkel Typ av Tjalgransmxtare. Statens Vaginstitut, Report 30, Stockholm, 1957.
Linell, K. A . , Hennion, F . B . , and Lobacz, E . F . Corps of Engineers' Pavement Design-Areas of Seasonal F r o s t . Highway Research Record 33, pp. 76-128, 1963.
Corps of Engineers, U. S. Army. Addendum No. 1, 1945-47, to Report on F r o s t Penetration, 1944-45. Corps of Engineers, U. S. Army, New England Division, Boston, 1949.
Sanger, F. J. Degree-Days and Heat Conduction in Soils. P r e s e n t e d a t Inter- national Conference on P e r m a f r o s t , Purdue university, Nov. 1963.