HAL Id: hal-02348276
https://hal.archives-ouvertes.fr/hal-02348276
Submitted on 5 Nov 2019
HAL is a multi-disciplinary open access archive for the deposit and dissemination of sci-entific research documents, whether they are pub-lished or not. The documents may come from teaching and research institutions in France or abroad, or from public or private research centers.
L’archive ouverte pluridisciplinaire HAL, est destinée au dépôt et à la diffusion de documents scientifiques de niveau recherche, publiés ou non, émanant des établissements d’enseignement et de recherche français ou étrangers, des laboratoires publics ou privés.
BotMap: Non-Visual Panning and Zooming with an
Actuated Tabletop Tangible Interface
Julie Ducasse, Marc J.-M. Macé, Bernard Oriola, Christophe Jouffrais
To cite this version:
Julie Ducasse, Marc J.-M. Macé, Bernard Oriola, Christophe Jouffrais. BotMap: Non-Visual Panning and Zooming with an Actuated Tabletop Tangible Interface. ACM Transactions on Computer-Human Interaction, Association for Computing Machinery, 2018, 25 (4), pp.24:1-24:42. �10.1145/3204460�. �hal-02348276�
Any correspondence concerning this service should be sent to the repository administrator: [email protected]
This is an author’s version published in: http://oatao.univ-toulouse.fr/22392
To cite this version: Ducasse, Julie and Macé, Marc and Oriola, Bernard and Jouffrais, Christophe BotMap: Non-Visual Panning and Zooming with an Actuated Tabletop Tangible Interface. (2018) Transactions on Computer-Human Interaction - TOCHI, 25 (4). 24:1-24:42. ISSN 1073-0516
Official URL
DOI : https://doi.org/10.1145/3204460
Open Archive Toulouse Archive Ouverte
OATAO is an open access repository that collects the work of Toulouse researchers and makes it freely available over the web where possible
BotMap:
Non-Visual Panning and Zooming with an Actuated
Tabletop
Tangible Interface
JULIE
DUCASSE, MARC MACÉ, and BERNARD ORIOLA,
CNRS IRIT, Université Toulouse 3CHRISTOPHE
JOUFFRAIS,
CNRS IRIT, Université Toulouse 3, CNRS IPALThe development of novel shape-changing or actuated tabletop tangible interfaces opens new perspectives for the design of physical and dynamic maps, especially for visually impaired (VI) users. Such maps would allow non-visual haptic exploration with advanced functions, such as panning and zooming. In this study, we designed an actuated tangible tabletop interface, called BotMap, allowing the exploration of geographic data through non-visual panning and zooming. In BotMap, small robots represent landmarks and move to their correct position whenever the map is refreshed. Users can interact with the robots to retrieve the names of the landmarks they represent. We designed two interfaces, named Keyboard and Sliders, which enable users to pan and zoom. Two evaluations were conducted with, respectively, ten blindfolded and eight VI partici-pants. Results show that both interfaces were usable, with a slight advantage for the Keyboard interface in terms of navigation performance and map comprehension, and that, even when many panning and zooming operations were required, VI participants were able to understand the maps. Most participants managed to accurately reconstruct maps after exploration. Finally, we observed three VI people using the system and performing a classical task consisting in finding the more appropriate itinerary for a journey.
Key Words: Visual impairment, non-visual interaction, tangible interaction, actuated interface, tangible user interface, pan, zoom, tactile map, interactive map
1 INTRODUCTION
The ability to pan and zoom is mandatory when one wants to explore a map. For sighted users, pinch-to-zoom and drag-to-pan gestures have become basic gestures to navigate a map. For vi-sually impaired (VI) users, however, these functionalities have very rarely been implemented and studied. Up to now, research has either focused on digital maps or hybrid maps (see [10] for a review). Maps that are purely digital can be displayed on a flat screen or projected onto a surface. Even though they can be easily refreshed, their exploration is usually constrained to a single point
Authors’ addresses: J. Ducasse, M. Macé, B. Oriola, and C. Jouffrais, IRIT-ELIPSE, Université P. Sabatier, 118 route de Nar-bonne, F-31062 Toulouse Cedex 09, France; emails: {Julie.Ducasse, Marc.Mace, Bernard.Oriola, Christophe.Jouffrais}@irit.fr. https://doi.org/10.1145/3204460
of contact, such as a finger or a virtual cursor. This makes exploration highly sequential (i.e., the user can only perceive the pieces of information one after the other) and challenging from per-ceptual and cognitive perspectives [38]. Interactive raised-line maps, the most common type of hybrid maps, are both digital and physical: users can interact with them using their two hands [5], which makes the exploration less sequential and less cognitively demanding. However, their content cannot be easily updated, making it impossible to implement panning and zooming.
The development of shape-changing or actuated interfaces opens new avenues for the design of physical maps that could support panning and zooming. For example, we can mention two proto-types: one relies on a refreshable tactile display [77], the other, named Linespace, on a 3D-printer [67]. Even though promising, the former is prohibitively expensive and the latter is currently too slow to be usable. On the contrary, actuated tabletop tangible interfaces have not been investigated for displaying non-visual maps (i.e., maps that are not displayed with visual elements only, such as tactile maps), but they are of particular interest, in terms of cost, physicality, and dynamicity. They are composed of several actuated tangible objects that can serve as tools to interact with the display or represent pieces of information, such as landmarks [16], and can support panning and zooming.
On the other hand, even though a few prototypes implemented non-visual panning and zooming [49,65], the design of suitable interaction techniques for panning and zooming has very rarely been considered. In addition, the effect of panning and zooming on mental representations has never been investigated with VI users.
To address these questions, we developed BotMap, an affordable and actuated tangible tabletop interface that allows the dynamic display of tangible maps. The digital map is displayed on the screen of an interactive tabletop, and small robots are placed over the main landmarks (e.g., main cities). The robots move to their new position whenever the map is rescaled or moved. One of the user’s fingers is tracked by a camera, and auditory feedback is provided when this finger passes over a robot. To investigate the effect o f p anning a nd z ooming o n m ental representations, we developed two interfaces that allow for discrete vs. continuous panning and zooming. The Keyboard interface (discrete control) relies on a numeric keypad, whereas the Sliders interface (continuous control) relies on three tangible sliders.
A first experiment was conducted with 10 blindfolded participants to evaluate the usability of the two interfaces. A second experiment was conducted with eight VI participants to evaluate the effect of the interfaces and of panning and zooming on map comprehension. The results showed that both interfaces are usable, with the Keyboard interface having a slight advantage over the Sliders interface. More interestingly, the second study showed that the majority of VI users were able to understand the maps and make inferences about the topology of different landmarks, even though these landmarks had never been displayed simultaneously. Finally, we conducted an additional study with three blindfolded and three VI participants. We added four basic functionalities (e.g., “Go to that landmark”) and assessed that BotMap enables users to independently explore a “pan & zoom” map in order to plan a journey.
2 RELATED WORK
2.1 Maps for Visually Impaired Users
Maps are essential in our everyday life, whether it is when learning an itinerary, visualizing geo-statistical data, such as temperatures, or acquiring knowledge about the geography of a country. Maps are also widely used at school. However, map accessibility for VI users is limited. Tradition-ally, visual maps are made accessible by creating a tactile version of the map. One of the most common methods to create a tactile map is to print the map on a microcapsule paper and then to heat it in a special oven. The printed areas rise above the surface of the paper and this tactile
map can be explored with the fingers. Because these tactile maps must be prepared and printed by a tactile graphics specialist, they are rarely available outside specialized education centers. More importantly, they can only present a limited amount of information. Therefore, to enable VI peo-ple to access the same amount of spatial data as sighted users do, it is necessary to spread the map content over many tactile documents, which may raise cognitive issues [25] and/or storage issues [34]. An alternative, which we investigate in this article, is to enable users to perform pan-ning and zooming operations on accessible interactive maps. A key benefit of interactive maps is that they can provide auditory and/or haptic feedback. Different types of accessible interac-tive maps exist; the classification proposed in [10] distinguishes between digital maps and hybrid maps.
Digital maps can be displayed on a screen or projected over a flat surface. The user can explore them by moving a cursor, and auditory feedback is provided according to what is under the cur-sor. The cursor can be moved indirectly using regular 2D-pointing devices, such as a keyboard, a mouse, or a joystick. 2D-pointing devices with additional feedback can also be used, such as force-feedback devices [12] or mice augmented with two Braille cells [26]. Digital maps can also be directly explored with the finger when they are displayed on a touch-screen device [53]. To make up for the absence of tactile feedback and facilitate the exploration of digital maps (and in particular touch-screen maps), a number of techniques have been proposed. For example, Kane et al. [31] designed innovative interaction techniques called access overlays that enable VI users to locate a landmark on a map (edge projection), retrieve the name of the nearest landmark (neigh-borhood browsing) or initiate guided directions to find a landmark. Other techniques involve, for example, the use of a virtual grid [1,78] or of tactile overlays [32,61]. The main advantage of dig-ital maps is that they can be instantly refreshed and can even be used in mobility when displayed on a tablet. However, both the lack of physicality and the fact that only one point of the map can be explored at a time are important issues: the exploration of the map is sequential and the user must integrate both the cursor position and the corresponding auditory or vibratory feedback over time, which is cognitively demanding [34,38,47].
Hybrid maps rely on both a digital and a physical representation, therefore allowing VI users to physically interact with the map, which improves many cognitive processes involved in map exploration. By sweeping their hands over the map, users can quickly locate the map elements. They can also quickly relocate specific elements in the graphic [75]. In addition, they can touch several elements simultaneously, making it possible to estimate distances between them as well as their relative position [35,44,45,76], for example, using “back-and-forth” movements [15,73]. These behaviors, as well as the cognitive processes that they underlie, are particularly interest-ing for “pan & zoom” maps. Indeed, in the case of “pan & zoom” maps, users must frequently (re)explore different parts of the map. Three types of hybrid maps exist. Interactive tactile maps usually consist of a tactile overlay (e.g., a raised-line map) placed over a touch-screen device [5]. Users can explore the map with both hands but also interact with it, for example, to retrieve the name of an element or to compute distances. Tangible maps are composed of a set of objects that represent the map elements. For example, in the prototype of Ducasse et al. [11], users were guided by audio instructions to progressively construct and explore a map. The objects were used to make digital points (e.g., cities) and lines (e.g., borders) tangible using retractable reels. Finally, refresh-able tactile displays consist of a matrix of pins that can be raised or lowered. The major limitation of hybrid maps concerns the updating of the physical representation. Indeed, interactive tactile maps cannot be updated without changing the overlay. Maps composed of a set of non-actuated tangible objects can be reconfigured, but the procedure is too slow to be usable. As for refreshable tactile display, they can be almost instantly updated but they are of limited size and very expensive (around $40,000 USD for a 120 × 60 matrix).
In conclusion, in order to implement accessible hybrid “pan & zoom” maps, it is mandatory to investigate alternative technical solutions that must be more dynamic than existing interactive tactile and tangible maps, and less expensive than refreshable tactile displays. In that sense, actu-ated tabletop Tangible User Interfaces (TUIs) are very promising.
2.2 Actuated Tabletop TUIs
Since the seminal work of Ishii and Ullmer on Tangible Bits [23], a large number of tabletop TUIs have been developed and several usage scenarios were related to the exploration of tangible maps. In their article, Ishii and Ullmer introduced the Tangible Geospace application, based on the metaDESK system, which enabled users to interact with a map of the MIT campus by manipulating tangible objects representing buildings. Urp [70] allowed sighted urban planners to simulate wind flow and sunlight by moving physical architectural models. With the MouseHous Table [22], users could simulate several arrangements of urban elements, such as streets and buildings. Maquil et al. [42] proposed the ColorTable, a tool to aid urban planners and stakeholders when discussing urban changes. The potential of TUIs for geospatial applications has also been discussed in a number of publications [28,57].
According to Holmquist et al.’s taxonomy [20], tangible objects can be associated with any type of digital content (containers), can represent a piece of information (tokens) or can be used to manipulate the data (tools). In the scope of the current study, we focus on tangible objects that represent points of interest on a geographical map, and then act as tokens, and on tangible objects that can be used to interact with the map and then act as tools. When tangible objects are used as tokens, issues arise when the physical representation must be updated to reflect a change that occurred in the digital model, for example, when an element is repositioned. In fact, most tabletop TUIs rely on tangible objects that are passive and can only be manipulated by the user. Although users can move the tangible objects to their new position, it takes some time when several objects must be replaced, especially in absence of vision [11].
This issue can be tackled with actuated interfaces, defined as “interfaces in which physical com-ponents move in a way that can be detected by the user” [54]. Actuation can be used to update the physical representation of a TUI by altering, for example, the shape or the position of the tangible objects. Actuated tabletop TUIs have been developed for various application domains, including remote collaboration [60] and simulation [51]. Interestingly, Riedenklau et al. [59] used actuated tangibles in combination with sonification techniques to make scatterplots accessible to VI users; tangible objects moved to the center of data clusters to help users locate them.
Two main approaches exist to move an object over a surface [52,58]: either the objects are pas-sive and the surface itself is moving the objects, or the objects are motorized and they can move by themselves. With the first approach, the surface is usually composed of an array of electromagnets (e.g., in [50,51]). These interfaces, referred as electromagnetic surfaces [52], can move passive ob-jects but are expensive and complex to build. With the second approach, the objects are motorized and their wheels can be controlled either wirelessly or by displaying a particular pattern on the screen. These interfaces are usually easier and cheaper to build than magnetic surfaces, but require the tangibles to be self-powered. In both cases, tangibles differ in size, motion speed and motion abilities, and interfaces are limited by the number of tangibles that can be used simultaneously. A more detailed comparison of these two approaches can be found in [52,58].
With the ongoing development of robotics, it becomes easier to buy or build small, affordable, and fast robots, which opens new perspectives for the design of actuated tabletop TUIs. For ex-ample, Le Goc et al. [16] recently proposed a new platform composed by many Zooids, which are small (2.6cm), affordable (50 $), and high-speed (44cm/s) custom-made robots. Possible scenarios with Zooids included drawing of Bézier curves, interactive visualizations, such as scatterplots as
well as ambient displays. In this study, we used robots to display physical and dynamic maps: each robot represents a landmark and can move to a new position whenever the digital map is updated. 2.3 Panning and Zooming Interfaces
According to Hornbaek et al. [21], “panning changes the area of the information space that is visible, and zooming changes the scale at which the information space is viewed.” The visible area of the canvas is often referred to as the view and it is displayed inside the viewport [27]. For panning, two conceptual models can be used [2]: users can either move the canvas directly (e.g., using “grab/touch and drag” techniques) or move the viewport over the canvas (by using navigation buttons or by moving a field-of-view box). Panning can be continuous (in which case the user can move the canvas or the viewport in any direction), or constrained/discrete (in which case the user can move the canvas or the viewport a predefined distance to a predefined set of directions). For zooming, sighted users can usually select a scale [27] by moving a slider along a vertical or horizontal axis, by pressing zoom-in or zoom-out buttons, or using the mouse wheel. Two main types of zoom exist [3,21]: geometric (all elements are always displayed, whatever the scale, but the size of the icons depends on the chosen scale) or semantic (different elements are displayed at different scales, for example, the name of buildings or rivers only appear beyond a certain scale). Semantic zooming is more often used in online maps. As an example, OpenStreetMap provides both discrete (with on-screen buttons and key presses) and continuous (with the mouse) panning and zooming functions, and relies on semantic zooming. Users can zoom in and out in order to explore continents, countries, wide areas, or villages. In OpenStreetMap, there are 20 zoom levels, corresponding to 20 predefined scales.1 When panning and zooming, users can experience “desert fog” if the part of the map displayed does not contain any elements, and users may feel lost or disorientated [29].
For visual panning and zooming, the effect of various factors on users’ performances, satisfac-tion, and spatial memory have been investigated: presence or absence of overviews, comparison of input techniques, use of animation when zooming, display sizes, and so on. In addition, frame-works, toolkits, novel input techniques, and navigation aids (e.g., to avoid desert fog) have been proposed (see [3] for examples).
The literature on non-visual panning and zooming is much more restricted. These functionali-ties have mainly been implemented with refreshable tactile displays [24,65,77]. Input techniques included buttons [65] or drag-to-pan and pinch-to-zoom gestures [77], but were not evaluated. With Linespace [67], users can ask the system to 3-D print another part of the map currently dis-played (similar to panning) or a detailed view of the area (similar to zooming), but the process is currently very slow. With iSonic [78], a tool for the exploration of geostatistical data, a numeric keypad enabled users to zoom in or out using a 3 × 3 recursive grid, a technique first proposed by Kamel et al. [30]. A number of zooming algorithms have also been developed to take into account the limited amount of information that can be accessed non-visually. For example, Rastogi et al. [56] developed an algorithm that determines intuitive zoom levels for the exploration of detailed diagrams, based on a tree hierarchy of the diagram elements. Palani et al. [49] proposed two types of zoom for touch-screen devices: with Fixed zoom, the elements displayed at Level 1 are displayed at Level 2 alongside new elements; with Functional zoom, different elements are displayed at dif-ferent zoom levels (e.g., walls at Level 1 and corridors at Level 2). These two zooming modes were compared to a no-zoom condition. Even though the evaluation was conducted with sighted and blindfolded participants, results showed that users managed to build an accurate cognitive map regardless of the conditions.
2.4 Summary of Related Work and Research Questions
To sum up, it appears that despite being very promising, actuated tabletop TUIs have not been used to display physical and dynamic maps accessible to VI users. A few prototypes have implemented non-visual panning and zooming but their usability has not been studied and it is unclear whether they enable VI users to efficiently navigate and understand the maps. Although the work of Palani et al. [49] addressed similar questions, their study was limited to simple and non-physical maps and was conducted with blindfolded participants only. In this work, we tackled the issue of non-visual panning and zooming by addressing the following research questions: (RQ1) how to design usable non-visual interaction techniques for panning and zooming on an actuated tabletop TUI? (RQ2) Which panning and zooming modes (discrete vs. continuous) should be used for VI users? (RQ3) Can VI users understand large tangible maps whose exploration requires panning and zooming? (RQ4) Is comprehension influenced by the interaction technique? To answer these questions, we designed and evaluated BotMap, an actuated tabletop TUI that allows for the display of dynamic maps, and supports panning and zooming.
3 BOTMAP: SYSTEM OVERVIEW AND INTERFACES
The design of BotMap was based on an iterative user-centered process. We included one VI person and six blindfolded participants (including three HCI experts and one ergonomist) in many brain-storming and pilot sessions. During the brainstorming sessions, we addressed many questions related to the type of viewport, the design of interactions (whether keyboard or slider based), the number of zoom levels, the number of elements in the map, and so on. We aimed to design a system that was answering user needs and that was based on their skills (e.g., moving viewport instead of moving map, see Section 3.3.1). During the pilot test sessions, we evaluated the usability of in-dividual components, such as sliders behavior or zooming function. In this section, we describe the main aspects of BotMap as well as how panning and zooming can be performed using the Keyboard and the Sliders interfaces.
3.1 System Overview
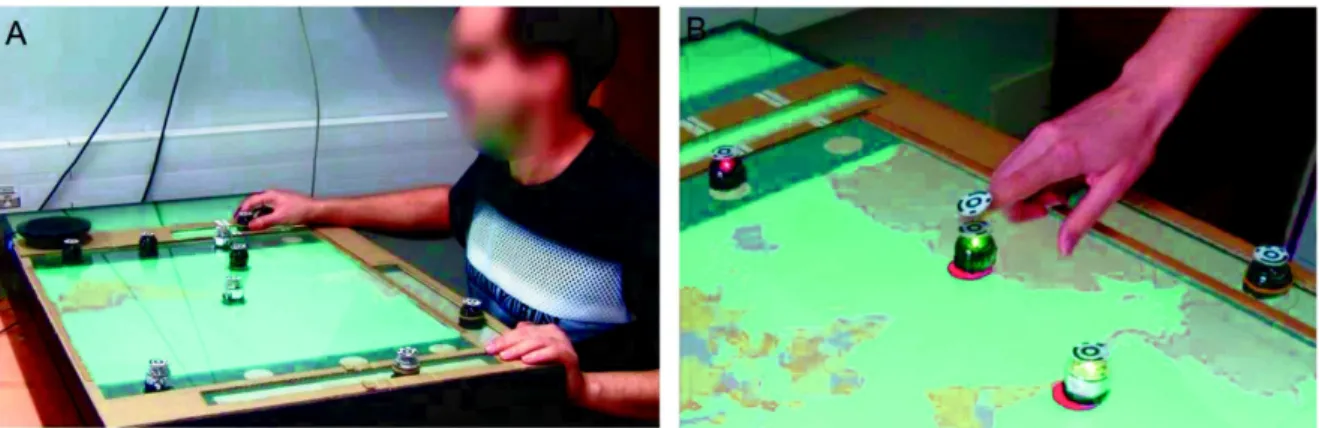
In BotMap, landmarks are represented by robots that are tracked by a camera placed above an in-teractive table and that can move freely on the surface whenever the map is updated (Figure 1(A)). Users can explore the map using both hands and they can interact with the robots in order to re-trieve the names of the corresponding landmarks (Figure 1(B)). They can also ask for other pieces of information using voice commands. When panning and zooming, feedback concerning the view-port position and the scale (i.e., how many kilometers the viewport represents) is provided. When the user confirms the ongoing operation, the robots move to their new position.
Maps are composed of several landmarks (in the current version of BotMap, lines and areas are not rendered). Similar to Google Maps or OpenStreetMaps, we defined different zoom levels, and each landmark appears at a certain level depending on its type (semantic zooming). For example, for the first two studies, we used the following zoom levels: city, town, and village. At the City level, the whole map can be displayed within the viewport but only the cities are displayed; at the Town level, the cities and the towns of a selected area are displayed; at the Village level, the cities, towns, and villages of a smaller area are displayed. Users can switch between these levels by zooming in or out.
3.2 Identification of Landmarks
Users can retrieve the names of the landmarks (Figure 1(B)). A marker is attached to the index finger and is tracked by the camera placed above the tabletop. To retrieve the name of a landmark, users must place the index on top of the robot. The name is given via Text-To-Speech (TTS),
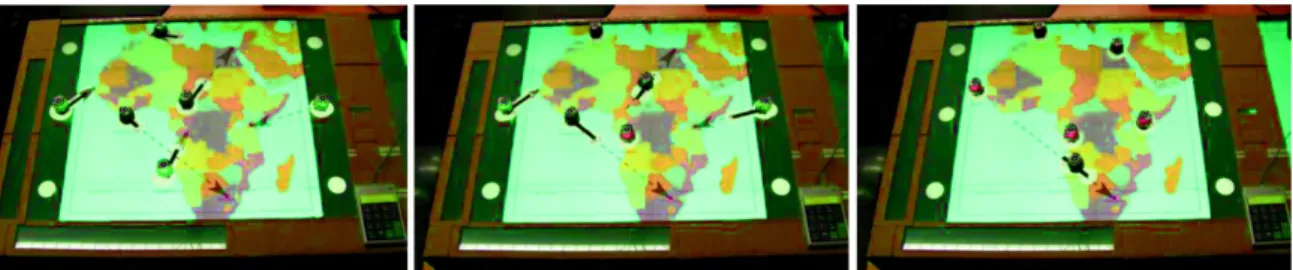
Fig. 1. (A) BotMap is composed of an interactive tabletop and several robots, tracked by a camera. Each robot represents a landmark and moves to its new position whenever the map is refreshed. On the picture, a blind user is zooming with the Sliders interface. (B) Users can select a robot to retrieve the name of the corresponding landmark.
followed by the type of the landmark (town, city, or village). When there are more robots than landmarks to be displayed, robots move to parking areas located on each side of the viewport (three on the left, three on the right). If the user selects a robot that is on a parking space, the message “parking” is played.
3.3 Interaction Techniques for Panning and Zooming
In this section, we first describe the design rationale of BotMap in terms of input modalities and panning and zooming implementations, and then describe the two interfaces.
3.3.1 Design Rationale.
3.3.1.1 Input Modalities. The design space of interaction techniques above or around an inter-active table is large and mainly includes touch interaction, tangible interaction, mid-air interaction, or the use of regular devices, such as a keyboard/mouse or voice commands. Throughout our it-erative design process, we found that touch-based techniques were not suitable for panning and zooming, as unintentional inputs were often triggered, making it difficult to correctly perform a gesture. Mid-air interaction techniques have been successfully used to enable VI users to interact with a map [1]. However, the detection of gestures is usually performed with a motion-capture system and therefore requires additional and expensive hardware. In addition, in [1], users re-ported that mid-air gestures induced fatigue. On the other hand, keyboards and tangible objects are cheap and provide tactile and/or kinesthetic feedback. In particular, keyboards are the most common input devices for VI users to interact with computers. Keyboard and tangible objects have been successfully used in various prototypes developed for VI users, notably to navigate a map (e.g., keyboard in iSonic [78]) or a graph (e.g., a tangible slider in the Tangible Graph Builder [43]). Building on these successful prototypes, we used a numeric keyboard for discrete panning and zooming (Keyboard interface) and tangible sliders for continuous panning and zooming (Sliders interface). Users can also interact with the system using voice commands.
3.3.1.2 Implementations of Panning and Zooming. In this section, we briefly explain the deci-sions concerning the choice of particular implementations for panning and zooming:
• Constrained vs. continuous panning and zooming. Two models exist for panning and zooming [2]: discrete vs. continuous. In order to evaluate whether one model could be more usable than the other, we designed two interfaces: the Keyboard interface allows constrained or discrete panning and zooming, while the Sliders interface allows continuous panning and zooming.
Fig. 2. Before panning and zooming, users must activate the corresponding mode. They must confirm (or cancel) the action. Audio feedback is the same for the two interfaces.
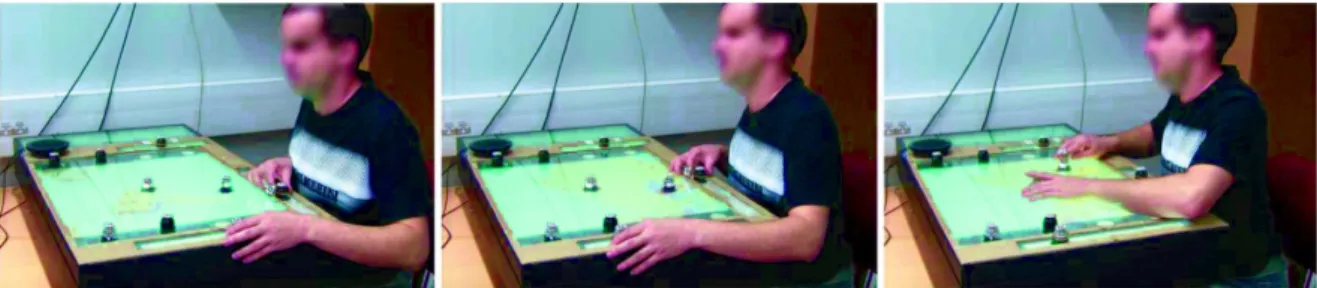
Fig. 3. Zooming with the keyboard interface: A participant selects a landmark in order to center it (left), then zooms in by pressing a key (middle), and finally explores the map once the robots are in place (right).
• Clutch-free panning and zooming. During the design process, various techniques were im-plemented and evaluated. Based on these preliminary tests, we decided not to implement any interaction technique that would require “clutching” operations (when users must lift their finger or the object they are manipulating and reposition it [46]). These operations are cognitively demanding because they disrupt the panning and zooming processes. We thefore discarded “drag-to-pan” and “pinch-to-zoom” interaction techniques, as they might re-quire clutching.
• Moving the map vs. moving the viewport. To our knowledge, the question of which panning implementation should be used for VI users has never been addressed. However, VI users do extensively use panning when using a screen reader or a refreshable Braille display. On these devices, pressing “down” results in listening or displaying the line below the current line and is therefore similar to moving down the viewport. According to this observation, during the design process, we decided to implement panning that requires users to move the viewport instead of the map.
3.3.2 Description of the Keyboard and Slider Interfaces. The voice commands and feedback for panning and zooming are the same for the two interfaces (Figures2,3, and4). However, the input techniques differ between the two interfaces (Figures5 and 6). In this section, we first describe the voice commands and feedback for activation and confirmation, and then describe the input techniques.
3.3.2.1 Activation/Confirmation. Users can activate the pan or zoom modes using the voice commands “Pan” and “Zoom.” The message “pan activated” or “zoom activated” is then played. When panning, feedback concerning the viewport’s position is given, with respect to its initial position (i.e., at the time of activation). Direction is given using an analogy of the 12-hour clock2
2Providing directions with the clock-metaphor is commonly used in specialized education centers for visually impaired
users and this method is particularly appreciated by visually impaired people [19]. In addition, it has been successfully used in several prototypes [11], as it is an effective way to provide precise directions [62].
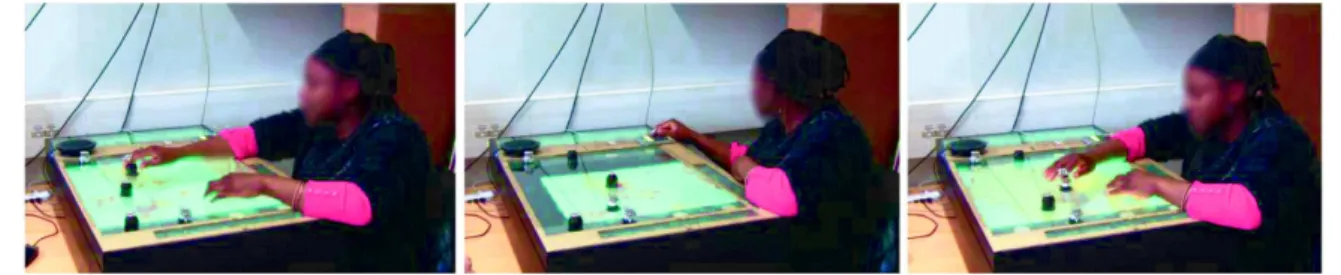
Fig. 4. Panning with the sliders interface: A participant moves the two sliders for panning (left and middle) and explores the map once the robots are in place (right).
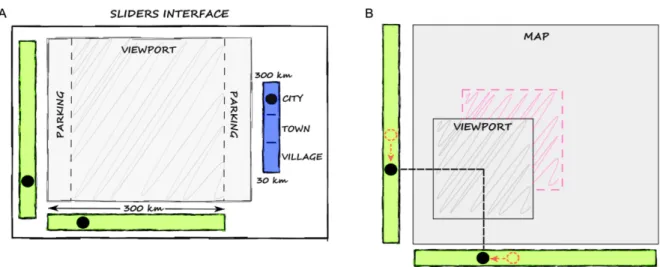
Fig. 5. (A) Keyboard interface. For panning, users can move the viewport in any of eight directions by pressing the corresponding key (in green). For zooming (in blue), they must press the “plus” key (zoom in) or the “minus” key. Only three predefined scales can be selected (one per zoom level). Unused robots move to the parking areas. (B) Illustration of the viewport with its nine virtual cells, as well as two successive viewport’s positions over the map (before and after the red key has been pressed).
(3 hours means that the viewport has been moved to the right); distance is given in kilometers. The frequency at which feedback is given depends on the interface and is described in the following sections. When zooming in or out, feedback concerning the zoom level and scale is provided (e.g., “Cities level. The viewport represents 100 km.”).
When the user confirms the current operation (voice command “ok”), the names of the land-marks that have disappeared and appeared are given (e.g., “Previous towns: Bordeaux. New city: London. New town: Bristol.”). At the same time, the robots move to their new position. When the robots are correctly positioned, the message “ok” is played. Users may also cancel the ongoing operation.
3.3.2.2 Keyboard Interface. For this interface, the viewport is divided into a grid of 3 × 3 square cells (Figure5). A numeric keyboard is placed on the right side of the viewport. Tactile cues were added to the keyboard to help users find the central key.
For panning, users must press one of the eight direction arrows in order to move the viewport one cell in the corresponding direction. Whenever a key is pressed, feedback concerning the dis-tance and direction of the viewport are provided with respect to its initial position (i.e., at the time of activation). For example, if the user presses the right key at the Town level, the message “3 hours, 30 kilometers” is played; if the user then presses the right key another time, the message “3 hours, 60 kilometers” is played.
Fig. 6. (A) Sliders interface. For panning, users can move the viewport horizontally and vertically by moving two robots (black dots on the green areas) that represent the position of the viewport’s center. Users can move the third robot in the zooming area (in blue) to select any scale between 30km and 300km. (B) Illustration of two successive sliders’ and viewport’s positions over the map.
For zooming, users have to press the “plus” or “minus” keys. The “plus” key allows users to zoom in: the part of the map displayed in the central cell expands to fill in the entire viewport. The “minus” key allows users to zoom out: the part of the map displayed within the entire view-port shrinks to fill only the central cell. Whenever the “plus” or “minus” key is pressed feedback concerning the current zoom level is provided. The predefined scales are 300km (City zoom level), 100km (Town zoom level), and 30km (Village zoom level). If the user cannot move the viewport (because one of the edges of the map has been reached) or cannot zoom in or out, feedback is provided accordingly (e.g., “Impossible to go to the right,” and “Impossible to zoom in”).
The Keyboard interface only provides the relative position of the viewport with respect to its initial position (i.e., at time of activation). Users can infer the absolute position of the viewport on the map but cannot retrieve it directly from the interface.
3.3.2.3 Sliders Interface. For this interface, three additional robots (referred to as sliders) can be moved by the user inside three rectangular areas delimited by cardboard (Figure 6). Two tactile cues (rubber-bands) were added on each slider to identify them.
The vertical and horizontal areas, respectively, to the left of and below the viewport, are used for panning. Users can move the viewport by moving the sliders. The position of the sliders within these areas corresponds to the vertical/horizontal position of the viewport over the map. When panning, feedback concerning the current position of the viewport is provided with respect to its initial one every 2 seconds (the delay of 2 seconds between messages has been chosen during the design sessions, after several iterations). For example, if the user moves the slider in the horizontal area to the right, the messages “3 hours, 50km,” “3 hours, 70km,” “3 hours, 100km” are successively played. Feedback is interrupted when the user validates or cancels the current operation.
For zooming, a vertical slider area is placed to the right of the viewport. The position of the slider placed within this area represents the current scale of the map, in kilometers. The highest position of the slider corresponds to a viewport representing 300km × 300km, while the lowest position corresponds to a viewport of 30km × 30km. Any scale between 30 and 300km can be selected. Feedback concerning the current zoom level and scale is provided every second or as soon as a new zoom level is selected. Tactile cues were placed on both sides of this slider area to indicate the
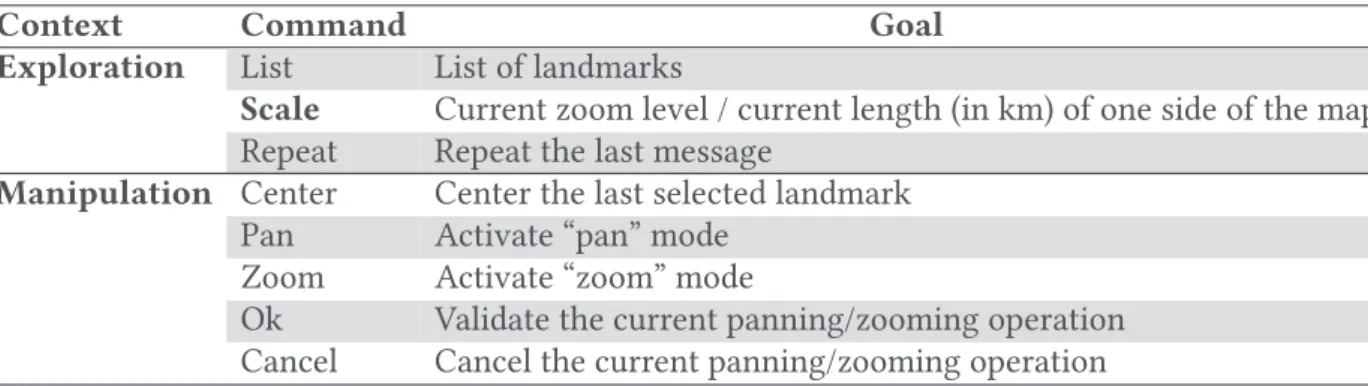
Table 1. Summary of Voice Commands
Context Command Goal
Exploration List List of landmarks
Scale Current zoom level / current length (in km) of one side of the map Repeat Repeat the last message
Manipulation Center Center the last selected landmark Pan Activate “pan” mode
Zoom Activate “zoom” mode
Ok Validate the current panning/zooming operation Cancel Cancel the current panning/zooming operation
limit between the three zoom levels (City level: between 300km and 150km; Town level: between 150km and 80km; Village level: between 80km and 30km).
By touching the Sliders, users can retrieve the absolute position of the viewport on the map (see Figure6(B)), as well as the current zoom level (City level in Figure6(A)) and the approximate scale (around 200km in Figure6(A)).
3.4 Additional Commands
3.4.1 Voice Commands during Exploration. Three voice commands allow users to retrieve ad-ditional pieces of information:
— “List”: The system lists all the landmarks currently displayed, according to their type (e.g., “Cities: London. Towns: Cambridge”). The message “no landmarks” is given when there are no landmarks displayed.
— “Scale”: The system indicates the zoom level as well as how many kilometers the length of the viewport represents (e.g., “Towns Level. The window represents 100km”).
— “Repeat”: The system replays the last message.
3.4.2 Centering on a Landmark for Zooming In and Out. To display more details around a land-mark, it is necessary to place this landmark at the center of the viewport before zooming in, other-wise it may move out of the viewport when zooming in. We therefore implemented a “centering” feature that enables users to place any landmark currently displayed at the center of the viewport. Users first need to select the landmark and then use the voice command “Center.” The map is then updated accordingly.
During pilot tests, we observed that when zooming out, participants were sometimes disorien-tated because a landmark that was displayed at Village level could not be displayed at Town/City level. This was particularly an issue when users were asked to find the nearest town/city to a village: when zooming out, the village would disappear. In order to enable users to have a fixed reference between different zoom levels, we modified the zooming algorithm. When the user cen-ters the viewport on a landmark before zooming out, this landmark is preserved and displayed at inferior zoom levels until the user centers the viewport on another landmark (it is therefore possible to display one village at Town and City levels and one town at City level).
3.5 Summary
Fig. 7. Photographs illustrating how the robots move to reach their position by following lines displayed on the underlying screen. Arrows indicate the trajectories computed for each robot.
4 IMPLEMENTATION
The table was a MultiTaction interactive table (MT420S, MultiTouch Ltd., Helsinki, Finland), run-ning Windows 7. The display area was 93cm × 52cm for a diagonal of 42in. The different slider areas were surrounded by thick cardboard (0.5cm) and bordered the viewport (see Figure 1(A)). Two laminated strips were placed at the top and bottom of the viewport to help users distinguish between the viewport and the parking spaces.
Although the table can track fiducial markers, these markers were too large for our application (4cm × 4cm). We therefore used an additional webcam placed above the tabletop to track the robots upon which we attached a small circular marker (2.5cm diameter). The user’s index finger was identified with a marker and tracked by the same camera. A USB speaker and a numeric keyboard (for the Keyboard interface only) were connected to the table.
For the robots, Ozobots Bits (Ozobot & Evollve, Inc.) were used, which are small and light toy robots (2.5cm diameter × 2.5cm high, 9 grams). The robots have two wheels and can move at speeds up to 44mm/s. Ozobots Bits are equipped with a color sensor, and their behavior can be programmed in advance, using the OzoBlockly Editor that is based on the Blockly graphical pro-gramming language. Possible behaviors include following a colored line, rotating and changing the LED color. The autonomy of the Ozobots Bits is around 1 hour when moving. Three additional Ozobots Bits were used as sliders for the Sliders interface, so that the sliders can be repositioned if the user cancels a panning or zooming operation. Each robot costs 50€. For the purpose of our studies, we used nine robots, yielding to a total of 450€ (although we used a Multitaction table, a regular 42in screen can be used to reduce the overall cost of the system).
Audio instructions were provided with a SAPI4 compliant TTS engine distributed as part of the CloudGarden TalkingJava SDK 1.7.0. To avoid any issue with voice recognition, vocal commands were triggered by the evaluator using a keyboard.
The BotMap application was developed using the MultiTouch4Java library (MT4J, [37]). Besides receiving TUIO messages sent by the interactive table, the library provides basic methods for pan-ning and zooming. However, the library requires the use of tiled web maps. To work offline, we generated offline map tiles using TileMill, an open source map design studio. The application also managed the robots.
Robots’ markers were tracked using the TopCode library, which provides their position and orientation. To improve the precision of the detection, the markers’ coordinates were refined using a homography. Whenever the map is rescaled or the viewport repositioned, each robot is assigned a landmark or a parking space, depending on the number of landmarks to be displayed. A Java application controls the robots in order to avoid collisions and lock-ups by displaying lines and circles of different colors that make the robots move, pause or rotate (Figure 7). In the current version of BotMap, six robots can be used simultaneously, in addition to the three sliders for the Slider Interface. All robots move simultaneously, and the average time required for all the robots
to be correctly positioned was 9 seconds. In addition, the landmarks must not be too close to each other to ensure the reliability of the algorithm (we found that a distance of approximately 6cm between two landmarks was appropriate), and the number of landmarks to be displayed must not exceed the number of available robots. For the user studies, we designed maps that fulfilled these criteria.
5 STUDY 1: COMPARISON OF THE USABILITY OF THE TWO INTERFACES
The aim of this study was to evaluate whether the two interfaces enabled users to perform panning and zooming operations of various complexities (panning various distances and directions, with or without zooming). We also aimed to investigate whether one interaction technique was more usable than the other. To do so, we used a basic target reaching task that did not require high cognitive processes but rather basic interaction processes (pressing the keys or moving the sliders). As the aim of this study was to assess usability and not mental representations, we did not expect any significant differences between blindfolded and VI participants.
5.1 Material and Methods
5.1.1 Participants. In this first study, the purpose was to assess that the two interfaces were usable to perform panning and zooming operations without vision. Recruiting VI participants is difficult and time consuming; therefore, conducting a first study with sighted users is an accepted procedure [43]. It is a way to assess basic features of a system before conducting a more compre-hensive study where differences between VI and sighted participants could be expected. We re-cruited 10 sighted participants (2 females and 8 males) from the research laboratory. Participants were aged between 24 and 29 years (M = 26.4, SD = 1.6) and were all right-handed.
5.1.2 Material. We used the setup described in the previous section with six robots (in addition to the three sliders for the Sliders interface). In order to decrease the duration of the experiment, the robots were not moving alone but were manually placed at their correct position after each panning/zooming command. Two randomly generated maps were used: 8 landmarks were selected in the first map for the training, and 24 landmarks were selected in the second map for the test. Landmark names were extracted from a list of existing village names and were randomly assigned at the beginning of each trial.
5.1.3 Task. The task was to find and select a landmark called “Target” as quickly as possible. At the beginning of each trial, a message was played indicating the current zoom level, the zoom level at which the target was present and its direction and distance with respect to the center of the viewport (e.g., “City level. Target village located at 3 hours and 150 kilometers”). At any time (i.e., even when panning), users could ask the system to give the updated direction and distance with the voice command “Info.” Distance and direction were given with respect to the current position of the viewport.
5.1.4 Experimental Design and Conditions. The experiment used a within-subject design with four independent variables and two factors for each independent variable. Therefore, there were 2 × 2 × 2 × 2 = 16 conditions, i.e., 8 for each interface:
— Interface. The Keyboard and the Sliders interfaces were compared.
— Direction. Targets were either located next to the vertical or horizontal axes (Vertical/ Horizontal), i.e., North, South, West, East, or next to the diagonal axes (Diagonal), i.e., NE, NW, SE, SW. We ensured that all targets were within an angle of 15° around the axis. — Distance. Targets were either located within 40–50km from the current position (Small) or
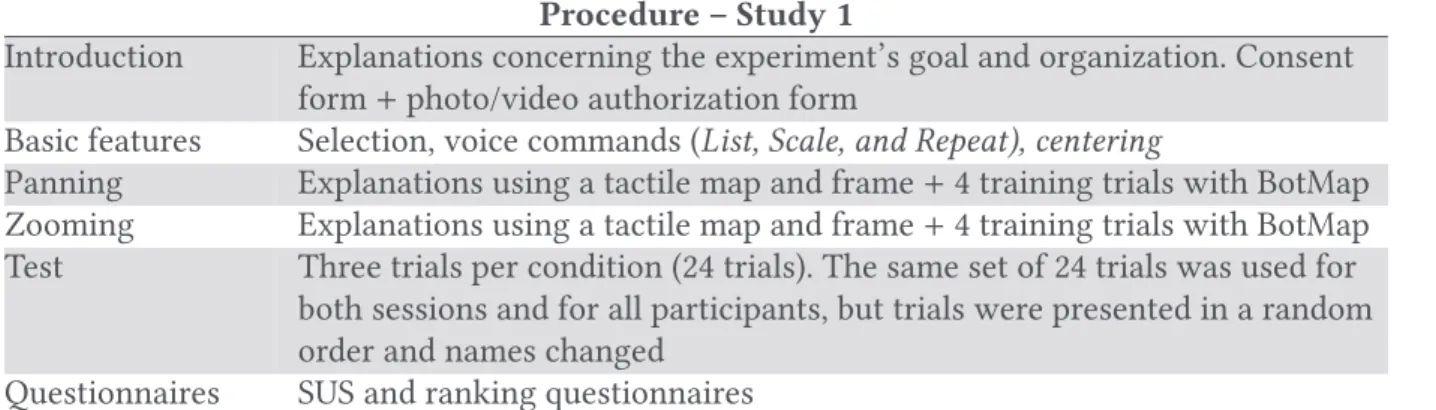
Table 2. Procedure for Each Session of Study 1 Procedure – Study 1
Introduction Explanations concerning the experiment’s goal and organization. Consent form + photo/video authorization form
Basic features Selection, voice commands (List, Scale, and Repeat), centering
Panning Explanations using a tactile map and frame + 4 training trials with BotMap Zooming Explanations using a tactile map and frame + 4 training trials with BotMap Test Three trials per condition (24 trials). The same set of 24 trials was used for
both sessions and for all participants, but trials were presented in a random order and names changed
Questionnaires SUS and ranking questionnaires
There was one session for each interface.
— Zoom level. At the beginning of the trial, the zoom level of the map was either City or Village but all the targets were villages. Therefore, the initial zoom level and the target zoom level were either identical (Identical) or different (Different), in which case users had to zoom in in order to display the target.
5.1.5 Variables.To assess the usability of the interfaces, we measured the time required to display and select the target. For each trial, we also logged the successive positions of the viewport and scales. Finally, participants had to fill out the System Usability Scale (SUS) questionnaire [6], and to indicate which interface was the more efficient, which one was the more pleasant, and which one they would choose if they had only one choice, and for what reasons. All sessions were video recorded.
5.1.6 Data Analysis. In accordance with the recent recommendations from the APA organi-zation [14], we report effect sizes with 95% confidence intervals (CI) instead of p-Value statistics based on the Null Hypothesis Significance Testing paradigm, the use of which has been criticized (see [7,9] for instance).
For completion times, we first log-transformed all completion times to correct for right skew-ness. We then computed means and 95% exact CIs on the transformed data and report the results anti-logged, i.e., we report geometric means instead of arithmetic means, as recommended in [63]. For pairwise comparisons, we first computed differences between means on log-transformed data (Sliders minus Keyboard), for each participant and each factor. We then computed means and 95% exact CIs and report the results anti-logged: differences between mean completion times are there-fore expressed as ratios [9,13].
For distances, we computed means and 95% bootstrap CIs. For pairwise comparisons, we first computed ratios between interfaces (Sliders/Keyboard), for each participant and each factor.3 We then computed means and 95% bootstrap CIs.
5.1.7 Procedure. The experiment was composed of two sessions (one per interface), conducted on separate days but during the same week. Interface order was counterbalanced. Each session lasted approximately 1 hour and 30minutes. The procedure is described in Table2.
3As the distance that users had to pan depended on the trials (Small vs. Large), computing mean differences in distances
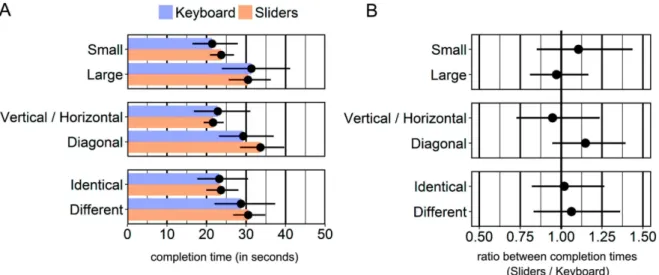
Fig. 8. (A) Mean completion times per condition, in seconds (N = 8). (B) Mean ratios between completion times (Sliders/Keyboard, N = 8). Values superior to 1 indicate larger times for the Sliders than for the Key-board. Error bars show 95% exact CIs.
5.2 Results
5.2.1 Completion Times. Because different strategies were used to select the landmark once it was displayed (such as asking for the system to provide distance and direction with respect to the viewport’s center), we only report times required to display the target. As a reminder, we report geometric means, and differences between completion times (Sliders minus Keyboard) are expressed as ratios. Values superior to 1 indicate that participants took longer with the Sliders than with the Keyboard.
All participants managed to display and select the target within the allowed time (3 minutes). Times were similar between the two interfaces (Keyboard: mean completion time = 25.8 seconds, 95% CI [19.8, 33.5]; Sliders: mean completion time = 26.8 seconds, 95% CI [23.3, 30.7]). However, with the Sliders, participants took consistently longer to perform Diagonal than Vertical/Horizontal trials (the two orange bars in the central row of Figure8(A)).
The mean ratio between completion times, computed across all conditions, was 1.0, 95% CI [0.8, 1.2], meaning that overall, participants took as much time to perform the task with the Sliders as with the Keyboard. Figure8(B) shows pairwise comparisons between the two interfaces for each factor: it shows that participants tended to take longer with the Sliders than with the Keyboard for Small and Diagonal trials.
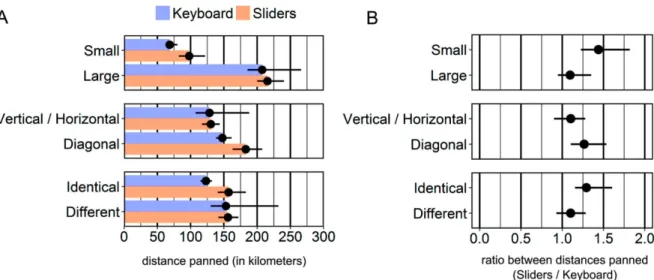
5.2.2 Distances. We computed the distance (in kilometers) panned by the participants to reach the target in each condition. Results show that participants panned larger distances for Diagonal than for Vertical/Horizontal trials with the Sliders (the two orange bars in the central row of Fig-ure9(A)). With the Keyboard, participants tended to pan smaller distance when the zoom level was Identical than when it was Different (the two purple bars in the lower row of Figure9(A)). This sug-gests that when the zoom level was Different, participants performed unnecessary panning actions at the City level.
The mean ratio between distances panned (Sliders/Keyboard), computed across all conditions, was 1.3 (95% CI [1.2, 1.6]). Figure6(B) shows pairwise comparisons for each factor. Given the fact that interval endpoints are about seven times less plausible than the point estimate [7], participants tended to pan larger distances with the Sliders in all conditions, and in particular for trials where
Fig. 9. (A) Mean distance panned (in kilometers) per condition (N = 8). (B) Mean ratio between distances panned (Sliders/Keyboard, N = 8). Values superior to 1 indicate that participants panned larger distances with the Sliders than with the Keyboard. Error bars show 95% bootstrap CIs.
the distance was Small (ratio = 1.4, 95% CI [1.2, 1.8]), the direction Diagonal (ratio = 1.3, 95% CI [1.1, 1.5]), and the zoom level Identical (ratio = 1.3, 95% CI [1.2, 1.5]).
5.2.3 Navigation Strategies. In this section, we report different strategies that we identified, based on log analysis. As a reminder, three zoom levels were defined (Village, Town, and City). With the Sliders, users could select any scale between 30km and 300km (Village level: between 30km and 80km; Town level: between 80km and 150km; City level: between 150km and 300km). With the Keyboard, there was only one predefined scale per zoom level (Village level: 30km; Town level: 100km; City level: 300km).
With the Sliders, two participants (P5 and P10) systematically moved to 80km (the limit between Village and City level), regardless of the initial zoom level. Other participants (P1, P2, P3, P4, P6, and P9) used a similar strategy, but only when the initial zoom level was City. In this condition, the other two participants (P7 and P8) systematically moved to 30km (the lowest position of the slider).
With the Keyboard, when the initial zoom level was City level, four participants (P1, P3, P5, and P7) almost systematically zoomed in to the Village level before panning, regardless of the distance to the target. In contrast, other participants tended to zoom out to the City and/or Town levels, then pan, then zoom in to the Village level.
We also observed that the final position of the target within the viewport varied between the two interfaces: with the Sliders, 45.8% of the targets were located in the center of the viewport at the end of the trials, vs. 26.2% for the Keyboard.
5.2.4 Satisfaction and Feedback. The overall score for the SUS questionnaire was 85.5 (out of 100) for the Keyboard (95% CI [77.0, 91.2]) and 86.0 for the Sliders (95% CI [80.7, 90.7]). Four par-ticipants out of ten found the Keyboard interface more efficient than the Sliders, and five found it more enjoyable than the Sliders. Overall, four participants preferred the Keyboard and six the Sliders.
Concerning the Sliders interface, three participants appreciated the fact that they could pan large distances without having to zoom out (P2, P7, and P9) and several participants mentioned the usefulness of the tactile cues in the zooming areas (P5, P6, and P8). Participants preferred the
Sliders because they were easier to use (P6 and P10), more precise (P7) and intuitive (P8), but also because they could be used to move the viewport in any direction (P2 and P6) and that, compared to the Keyboard, they were based on large movements with both hands (P8 and P9). However, several participants reported that practice and time were necessary in order to learn how to use both sliders simultaneously (P5) or to correctly position the sliders (P5, P9, and P6).
Concerning the Keyboard interface, half of the participants found that it was sometimes difficult to distinguish between the directional keys (for panning) and the plus and minus keys (for zoom-ing) and suggested that the two sets of keys should be more clearly separated. They also reported that the Keyboard interface enabled them to move the viewport to a certain distance by “counting” the number of key presses. This feature was the main reason why the Keyboard was found more efficient than the Sliders (P1, P3, P4, and P5) or less efficient (P10) and less enjoyable (P6 and P7). 5.3 Discussion and Summary of Study 1
The results show that all participants managed to successfully perform the task with the two interfaces, each in less than 30 seconds. Completion times indicate that overall, participants took as much time with the Keyboard as with the Sliders interface. However, participants tended to pan larger distances with the Sliders than with the Keyboard, especially for Small, Diagonal, and Identical trials. This is in line with the fact that, with the Sliders, participants took longer and panned larger distances to perform Diagonal than Vertical/Horizontal trials, whereas this difference was not as clear with the Keyboard. These observations suggest that the Sliders are less easy to control than the Keyboard when the viewport must be moved diagonally or for small distances. As suggested by some participants, additional practice with the Sliders may improve performance.
There were no clear preferences in subjective ranking for one interface or the other. The fact that the Keyboard interface allowed for discrete panning was seen by some as an advantage (users counted how many times they had to press each key to reach the target) and by others as a disad-vantage (it was not always possible to place the target at the center of the viewport). It is interesting to note that using BotMap, participants managed to develop strategies similar to those that they might have developed using a visual interface, such as zooming out to pan larger distances.
To sum up, this first study showed that the designed input techniques and feedback allowed users to perform panning and zooming actions of various complexities without vision. Both inter-faces led to similar performances, with the Keyboard having a slight advantage over the Sliders in terms of efficiency (smaller distances panned). However, blindfolded participants were already fa-miliar with the concepts of panning and zooming, which might have helped them determine how to use the interfaces. In the following study, we specifically investigated whether VI users were also able to efficiently navigate maps through panning and zooming and, above all, to understand them.
6 STUDY 2: USABILITY AND MENTAL REPRESENTATIONS WITH VISUALLY IMPAIRED USERS
The main aim of this study was to evaluate whether BotMap enables VI users to understand a map whose exploration requires panning and zooming: users had to explore a map with several landmarks and memorize the overall configuration in order to answer comprehension questions and eventually reconstruct the map. We also wanted to investigate whether one interface would be more usable than the other for VI users.
6.1 Material and Methods
6.1.1 Rationale. In this study, users had to explore a map with 10 landmarks and memorize the overall configuration in order to answer comprehension questions and eventually reconstruct the
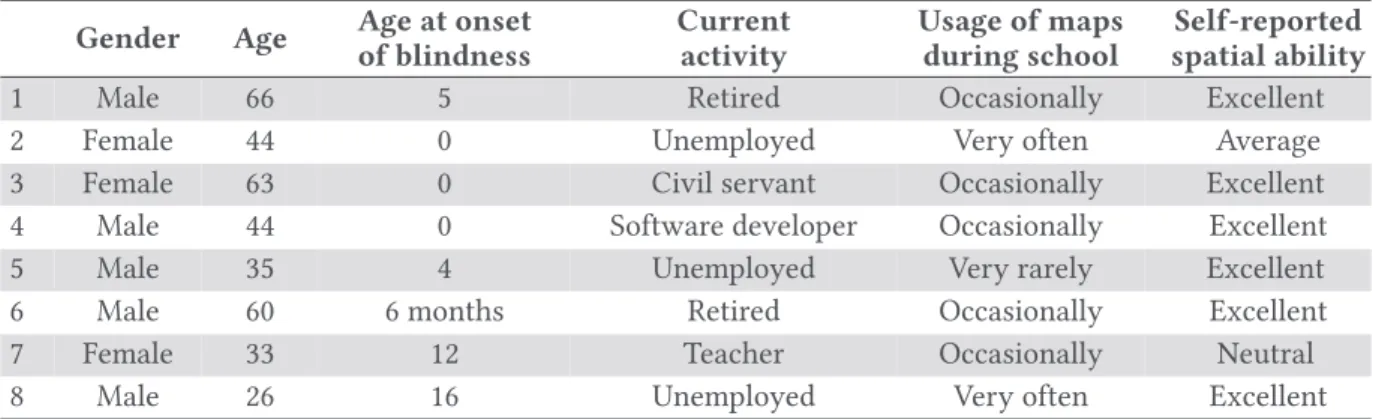
Table 3. Participants’ Main Characteristics Gender Age Age at onset
of blindness Current activity Usage of maps during school Self-reported spatial ability
1 Male 66 5 Retired Occasionally Excellent
2 Female 44 0 Unemployed Very often Average
3 Female 63 0 Civil servant Occasionally Excellent 4 Male 44 0 Software developer Occasionally Excellent
5 Male 35 4 Unemployed Very rarely Excellent
6 Male 60 6 months Retired Occasionally Excellent
7 Female 33 12 Teacher Occasionally Neutral
8 Male 26 16 Unemployed Very often Excellent
map. Besides providing distinct measures related to map navigation (completion time and distance panned for each trial) and map comprehension (percentage of correct answers and accuracy of the reconstructed map), such a task mimics a realistic scenario where users would first discover and learn spatial relations between items before recalling them [55]. A similar procedure was used in a number of studies dealing with sighted user’s spatial memory in panning and zooming interfaces [27,55].
6.1.2 Participants. We recruited eight legally blind people (five males and three females), aged between 26 and 66 years (M = 46.4, SD = 15.0). P2, P3, and P8 had residual perception of very bright light but could not rely on it to distinguish shapes. All participants possess a smartphone and a laptop, and use them very frequently. All participants use a screen reader. All participants also reported that, when at school, they had used maps, but at various frequencies. The following table sums up participants’ main characteristics (Table 3).
We asked participants whether they knew how online maps (e.g., Google Maps) work as well as whether they were familiar with the concepts of panning and zooming. Apart from P8 who lost sight at 16, participants knew very little about Google Maps. They mainly knew that Google Maps enables users to compute an itinerary between two points of interest and that this itinerary can be displayed on the map. Other reported some knowledge about Google Street View. For example, P5 indicated that “one can enlarge the images to have more details and we can even see streets and cars.” As for the concept of zooming, most participants said that it was used to enlarge a picture. None were familiar with the word “panning.”
6.1.3 Material. We used the same apparatus as for Study 1. Four different m aps were used for the Training session and the Evaluation session. During training, names of landmarks were either names of planets, musical instruments, or vegetables. In that way, we ensured that the maps used for training did not interfere with those used for the test. For the evaluation, two maps were used; the second map was symmetric to the first one. Both maps were fictitious in order to ensure that participants had no prior knowledge regarding these maps. Both maps were composed of ten landmarks: three cities, five towns, and two villages (see Figure 10for an example). In order to help the users memorize the three cities and their configuration, we used the names of well-known cities and respected their relative locations (for example, in Map 2 the western city was labeled Madrid and the eastern was labeled Zurich). The names of the towns and villages were randomly chosen from a list of municipalities so that each landmark began with a different letter. Different names were used for the two maps.
Fig. 10. The two maps used for the test. The three cities are written in black, the five towns in blue, and the two villages in green (colors for illustration purpose only).
Fig. 11. Summary of a trial.
6.1.4 Task. At the very beginning of the test, users were asked to explore the map at the City level and to memorize the locations and names of the three cities. The task was composed of eight trials. In each trial, users had to find one or two landmarks as quickly as possible and were asked to understand and memorize their locations. In order to ensure that participants would use both panning and zooming, the order of the landmarks to be found was controlled and panning or zooming were either not allowed or mandatory, depending on the trials being performed. In addition, to keep the length of the experiment within 2.5 hours, while taking into account the fact that haptic exploration takes time, two landmarks were explored only once and six landmarks were explored twice. In order to compensate for the lack of repetitions, we asked comprehension questions immediately after each trial. The overall reconstruction of the map was made at the end of the session.
To help the subjects locate a target, they were told its type (Town or Village) as well as its ap-proximate position with respect to a reference landmark (given as “R” in the upcoming text), which was a Town or a City already explored. Users had to pan and/or zoom to find the target(s). When they found and selected a target with their finger, its name was given, followed by its type and the message “found.” At the end of each trial, users were given 30 additional seconds to explore the current view (without panning, zooming, or centering). Then, they had to answer four compre-hension questions. At the beginning of the following trial, the viewport was repositioned so that all users started a given trial with the same configuration. Figure11 summarizes how each trial was conducted.
6.1.5 Experimental Design and Conditions. The experiment relied on a within-subject design with two independent variables: Interface (Keyboard and Sliders) and Actions needed in each trial (Zoom in; Pan; Zoom in & Pan; and Zoom out & in), i.e., 2 × 4 = 8 conditions. Participants performed two trials for each condition. The trials were presented in the same order for each participant. In
that way, participants were “guided” to progressively explore the whole map. For each trial, users had to perform a different set of actions:
— Zoom in: The initial zoom level was City level. Users had to zoom in to find two towns located within 60km of the reference city R. It was possible to simultaneously display the city R and the targets if the viewport was centered on R at the City level.
— Pan: The initial zoom level was Town level. Users had to pan in order to find one town located beyond 160km from the reference town R, within a range of 3 hours (e.g., 6–9 hours). — Zoom in & Pan: The initial zoom level was Town level. Users had to find one village located within 60km of town R, on its left or right side. Users had to zoom in (in order to display villages) and then pan (the target and R could not be displayed simultaneously).
— Zoom out & in: The initial zoom level was Town level. Users had to find two towns located within 60km of city R. Therefore, users had to zoom out, pan to find R, and finally zoom in to find the two targets.
These four types of trials were chosen to mimic realistic map exploration tasks, similar to those performed by sighted users on Google Maps or Open Street Maps, for example. Zooming in is re-quired to focus on a specific area of the map. Panning is required when one is discovering what is around a specific area or landmark. Zooming out and in is a basic process in multi-scale environ-ments [17]. It must be noted that all of these tasks can be performed with the Keyboard and with the Sliders (as shown in Study 1), and did not favor one interface in particular. However, with the Sliders, users were free to place the viewport anywhere on the map and to select any possible scale. Provided that participants were able to take advantage of this feature, it could lead to a greater sat-isfaction (increased sense of control) and to a better understanding (some distant landmarks could not be displayed simultaneously with the Keyboard, but they could be displayed simultaneously with the Sliders by precisely adjusting the scale). Finally, it must be noted that users can easily move from one discrete level to the next with the Sliders. They can rely on the two tactile cues that were added to the zooming slider area.
6.1.6 Variables.
6.1.6.1 Map Comprehension. Many methods have been used or suggested to assess mental rep-resentations of VI users (see [33] for a review). The tests often measure differences between es-timated and effective distances or directions between two landmarks or several landmarks. They usually rely on a set of questions or on graphical methods, such as sketching, filling blank elements on a map, or reconstructing a model using building blocks. In this work, we used both distance and direction questions, as well as a reconstruction task.
Two main variables were used: (1) the number of correct answers given by users to the ques-tions asked at the end of each trial; (2) the bidimensional regression coefficient, which indicates how similar two 2D configurations are [68]. Additional questions concerning subjective map com-prehension were also asked (Questionnaire 2).
Multiple Choice Questions. Four questions were asked after each trial. They were multiple choice questions with four options. Half of the questions, referred to as Local questions, required users to compare landmarks that belonged to the same cluster (i.e., a city and its surrounding towns and villages). The other half, referred to as Global questions, required users to compare one landmark to landmarks that did not belong to the same cluster (e.g., City A with towns B1 and B2). Questions concerned either distances or directions, and required the users to compare two landmarks only (simple) or three or more landmarks (complex).
Table 4. Examples of Multiple Choice Questions Asked After Each Trial
Question Type Answer A Answer B Answer C Answer D I am in A, facing Simple/Direction 12 h–3 h 3 h–6 h 6 h–9 h 9 h–12 h North. Where is B? Simple/Distance <80km 80–180 180–280 >280km
Which landmarks are located east of A?
Complex/Direction B B, C C, D B, C, D What is the shortest
distance?
Complex/Distance A–B A–B1 A–C A–C1
Only one answer is correct.
In total, 32 questions were asked: 16 were Local questions and 16 were Global questions; out of the 16 Local/Global questions, there were four questions of each type (distance/direction × simple/ complex). The following table gives an example of questions asked after each trial (Table4).
Map Reconstruction. At the end of the eight trials, participants were asked to reconstruct the map. To do so, a set of magnets were placed on a magnetic board, each magnet being labeled with the Braille initial of a landmark. Two cities were already placed to provide anchor points and scale, and the edges of the map were delimited with magnetic strips. Participants were read the names of the landmarks before reconstruction. At the end of the reconstruction, a photo was taken and later analyzed to retrieve the coordinates of each landmark.
The reconstructed maps were compared to the initial map using a bidimensional regression analysis based on Euclidean geometry. This statistical method, initially proposed by Tobler [68], can be used to compute how similar two 2D-configurations are (regression coefficient ranging from 0 to 1). We used the true coordinates as independent variables and the coordinates of the reconstructed map as dependent variables.
6.1.6.2 Usability. To assess the usability of the interfaces for VI users, we used the same pendent variables as for Study 1. In addition, because we expected the task to be cognitively de-manding, participants had to answer the NASA-TLX questionnaire [18] at the end of each session. Additionally, several questions were asked concerning the usability of each interaction technique (Questionnaire 3). Users also had to indicate which interface they preferred and for what reasons (Questionnaire 4). Finally, all sessions were video-recorded.
6.1.7 Data Analysis. We used the methodology described in Study 1. For completion times, we computed geometric means and 95% exact CIs on log-transformed data, and pairwise comparisons of completions times are expressed as ratios. For the other variables (percentage of correct answers, regression coefficients, and NASA-TLX scores), we computed means and 95% bootstrap CIs. For pairwise comparisons, we first computed differences between interfaces (Sliders minus Keyboard), for each participant and each factor. We then computed means and 95% bootstrap CIs. For distances only, we computed ratios between interfaces (Sliders/Keyboard), instead of differences between interfaces.4
6.1.8 Procedure. The experiment was composed of two sessions, each of which lasted approx-imately two and a half hours. During the first session (training only), participants were explained the basic features of the application and were explained how to pan and zoom using the two in-terfaces. During the second session (evaluation session per se), participants had a brief training
4As the distance that users had to pan depended on the trials, computing mean differences in distances across different
Table 5. Description of the Procedure for the First Session (Training) Training session
Introduction Explanations concerning the goal and organization of the experiment Consent form + photo/video authorization form
Questionnaire 1 (user’s profile) Clock face test5
Pan & Zoom Explanations concerning panning and zooming using three tactile maps of different sizes and one tactile frame moved over the maps
Basic features Selection, voice commands (List, Scale, and Repeat), centering – 3 trials6. For each interface Panning – 4 trials
Zooming – 4 trials
Panning and Zooming – 4 trials
Table 6. Description of the Procedure for the Second Session (Evaluation) Evaluation session
Introduction Reminder of the aim of the experiment
Pan & Zoom Reminder of the concepts of panning and zooming
Commands Selection, voice commands (List, Scale and Repeat), centering – 2 trials For each interface Training – 7 trials
Test – 8 trials Map reconstruction
SUS and NASA-TLX questionnaires
Questionnaires 2 (subjective comprehension) and 3 (usability) Debriefing Questionnaire 4 (users’ preferences and comments)
period before performing the test. The following tables summarize how both sessions were orga-nized (Tables5and6).
The order of presentation of the interfaces was counterbalanced within and between the ses-sions. For the evaluation session, two different maps were used and their order was also counter-balanced (half of the participants explored Map 1 first, and half explored Map 2 first).
6.2 Results
6.2.1 Navigation Performances.
6.2.1.1 Success. Out of the 128 trials, 115 were performed without the help of the evaluator and considered as successful. Other trials during which the experimenter had to help the participants were considered as unsuccessful. Out of the 13 unsuccessful trials, there was 1 Pan, 10 Zoom in & Pan, and 2 Zoom out & in trials. Zoom in & Pan trials mainly failed because participants became disoriented; one participant misunderstood the instruction; one participant forgot to zoom in to
5Clock face test: we ensured participants knew how to interpret directions given using the clock metaphor. We asked them
to point on a raised-line clock-face the ticks corresponding to hours given by the evaluator. Participants also had to explore a raised-line map with three landmarks and to answer questions such as “I am in A. Where is B?” using clock directions.
6Training: For Session 1 and Session 2 training trials, participants had to find a target and were then asked a series of
ques-tions concerning the position of the target with respect to other landmarks. In that way, we ensured that participants not only performed the action properly, but also understood what the actions meant in terms of map manipulation/exploration. If an incorrect answer was given, explanations were given.