HAL Id: hal-01061352
https://hal-univ-rennes1.archives-ouvertes.fr/hal-01061352
Submitted on 5 Sep 2014HAL is a multi-disciplinary open access
archive for the deposit and dissemination of sci-entific research documents, whether they are pub-lished or not. The documents may come from teaching and research institutions in France or abroad, or from public or private research centers.
L’archive ouverte pluridisciplinaire HAL, est destinée au dépôt et à la diffusion de documents scientifiques de niveau recherche, publiés ou non, émanant des établissements d’enseignement et de recherche français ou étrangers, des laboratoires publics ou privés.
Inter-layer charge disproportionation in the dual-layer
organic metal (tTTF-I)2ClO4 with unsymmetrical I***O
halogen bond interactions.
Kyoung-Soon Shin, Olivier Jeannin, Mariya Brezgunova, Slimane Dahaoui,
Emmanuel Aubert, Enrique Espinosa, Pascale Auban-Senzier, Roman
Świetlik, Arkadiusz Frąckowiak, Marc Fourmigué
To cite this version:
Kyoung-Soon Shin, Olivier Jeannin, Mariya Brezgunova, Slimane Dahaoui, Emmanuel Aubert, et al.. Inter-layer charge disproportionation in the dual-layer organic metal (tTTF-I)2ClO4 with unsymmet-rical I***O halogen bond interactions.. Dalton Transactions, Royal Society of Chemistry, 2014, 43 (14), pp.5280-91. �10.1039/c3dt52801d�. �hal-01061352�
Inter-Layer Charge Disproportionation in the Dual-Layer Organic Metal
(tTTF–I)
2ClO
4with Unsymmetrical I•••O Halogen Bond Interactions
Kyoung-Soon Shin,a Olivier Jeannin,a Mariya Brezgunova,b Slimane Dahaoui,b Emmanuel Aubert,b Enrique Espinosa,*,b Pascale Auban-Senzier,c Roman Świetlik,*,d Arkadiusz Frąckowiakd
and Marc Fourmigué*,a
a
Institut des Sciences Chimiques de Rennes, Université Rennes 1, UMR CNRS 6226, Campus de Beaulieu 35042, Rennes, France. E mail: marc.fourmigue@univ-rennes1.fr
b
Laboratoire CRM2, UMR CNRS 7036, Institut Jean Barriol, Université de Lorraine, BP 70239, 54506 Vandoeuvre-les-Nancy, France
c
Laboratoire de Physique des Solides, Université Paris-Sud, UMR CNRS 8502, Bât. 510, 91405 Orsay, France
d
Institute of Molecular Physics, Polish Academy of Science, ul. M. Smoluchowskiego 17, 60-179 Poznań, Poland.
Abstract
A mixed-valence salt of tTTF-I with ClO4–, formulated as (tTTF-I)2ClO4, is characterized by the presence of two crystallographically independent donor molecules, segregated in different layers, and linked together through I•••O interactions with the ClO4– anion disordered at room temperature. The tTTF-I donor molecule was prepared by metallation of tTTF (trimethylene tetrathiafulvalene) followed by reaction with iodine to afford the mono and diiodo derivatives tTTF-I and tTTFI2, respectively. Crystal structure of the latter neutral tTTFI2 shows the occurrence of strong, type II, I•••I halogen bond interactions. Band structure calculations of the dual-layer structure of the 2:1 salt (tTTF-I)2ClO4 show co-existence of both 1D open, and 2D closed Fermi surfaces. The salt undergoes a metal-insulator phase transition at TMI = 90 K, associated by an electronic dimensionality decrease, since already at 100 K, the 2D part of the Fermi surface transforms into 1D corrugated planes. High resolution X-ray investigations performed at 100 K, combined with multipolar refinements, indicate an approximately equivalent +0.5e charge in both donor molecules, as also deduced from the intramolecular bond distances. On the other hand, Raman spectroscopic investigations show that at ambient temperature the charge is actually distributed non-uniformly in conducting layers of tTTF-I molecules, with the identification of molecules with charges +1, +0.5, 0e, while at low
temperature the charge distribution becomes essentially uniform (+0.5e), as confirmed from the X-ray high resolution data. These apparent contradictory behaviors are actually a consequence of a partial electron transfer between the two independent slabs to reach a common Fermi level in the metallic phase.
Introduction
Prototypical molecular conductors1 are composed of conducting slabs of partially oxidized tetrathiafulvalene molecules, intercalated with layers of counter ions, eventually associated with neutral molecules.2 Since the metallic properties of such salts are intimately related to the details of the overlap interactions within the conducting slabs, many efforts have been reported to control the organic/inorganic interface, essentially dominated in the historical salts (derived from TTF,3 TMTTF, TMTSF or BEDT-TTF4 and analogs) by weak and uncontrolled C–H•••X interactions. In order to introduce a stronger element of supramolecular control over this interface, the purposely introduction of "normal" hydrogen bonds using TTFs with alcohol, amide or acid functionalities was investigated, soon followed by the introduction of halogen bonding interactions.5 Indeed, besides the C–Hal•••Hal–C interactions extensively investigated in the recent years6 and characterized with various structural motifs7 (type I, type II, triangular motifs),8,9 the electrophilic part of an halogen atom which is located in the extension of the C–Hal bond,10 can also interact with any Lewis base.11 In a more general perspective toward anion coordination for selective binding, extraction or separation,12 these halogen bonding interactions have also recently emerged as a powerful tool, but again mostly with halides,13 thiocyanates,14 polyhalides, halometallates15 and cyanometallates.16 Recent investigations of ClO4– coordination17 with halocarbons and 1,4-diiodotetrafluorobenzene have also shown its propensity to act as halogen bond acceptor through simultaneously three different oxygen atoms.
Tetrathiafulvalenes directly substituted with halogen atoms proved to be particularly useful as their oxidation to the cationic state activates the hole on the halogen atom and favors a strong, short and directional interaction with the counter ion acting as Lewis base, mainly with halides,18 and polyhalo anions, with polyhalo–, polycyano– or polythiocyanatometallates, through C–Hal•••Hal, C–Hal•••N or C–Hal•••S interactions. By comparison, CTTF–Hal•••O interactions with oxygen atoms are limited to a few examples, inorganic ClO4–,19,20 or HSO4– anions,21 and recently a series of organic sulfonate anions.20
We have prepared novel iodinated TTFs derived from the unsymmetrical trimethylenetetrathiafulvalene (tTTF),22 namely the mono and diiodo derivatives tTTF–I 1 and tTTF–I2 2. The trimethylene electron-releasing substitution was introduced here to favor a low oxidation potential, by counterbalancing the electron withdrawing effect of the halogen functionalization. The cyclic motif was also chosen rather than two methyl groups in order to suppress any possible rotational disorder that could limit the accuracy of results coming from high resolution X-ray diffraction experiments which we intended to perform with 1 or 2, in order to characterize the electron density involved in the halogen bonding (See below). The electrocrystallization of tTTF–I (1) in the presence of the ClO4– anion afforded two different salts, a 1:1 fully oxidized salt, (1)ClO4•(CH2Cl2) and a 2:1 salt with metallic conductivity, (1)2ClO4, whose structural and electronic properties will be described and analyzed in details. Indeed, in the latter salt, the donor molecules organize into two crystallographically independent layers, with very different structural and electronic properties, a rare example of so-called dual layer conductors.
S S S S X X I I S S S S I S S S S I I 1 2 X = O : X = S : EDO-TTF-I2 EDT-TTF-I2
Results and discussion
Syntheses and electrocrystallizations. The preparation of 1 and 2 is based on the direct
metallation of tTTF with LDA (Scheme 1) as described for the preparation of EDO-TTF-I2.19 Using a slight excess of LDA followed by reaction with perfluorohexyl iodide afforded 1 in 60% yield together with traces (5%) of 2. With a large excess of LDA (6 equiv), the diodo derivative 2 was obtained as the sole product in 44% yield.
S S S S I S S S S I I 1 2 S S S S i 1.4 LDA/THF/ -78°C ii I-C6F13 i excess LDA/ THF/-78°C ii I-C6F13
Investigation of the electrochemical properties (Table 1) shows the anticipated trend, with a more anodic oxidation associated with a larger number of electron-withdrawing halogen atoms on the TTF core, as already observed for example on the first oxidation wave in the EDT-TTF/EDT-TTF-I/EDT-TTF-I2 (0.06/0.15/0.21 V vs. Ag/Ag+)18a or EDO-TTF/EDO-TTF-I/EDO-TTF-I2 (0.39/0.45/0.51 V vs. SCE) series.19
Table 1. Electrochemical properties of the different TTF derivatives. Electrolyte:
(n-Bu)4NPF6 0.1 M in CH2Cl2, Pt working electrodes and counter electrodes, SCE reference electrode, scan rate 100 mV s–1.
Compound 1/2 1 E (V) E21/2(V) tTTF 0.35 0.91 tTTF-I (1) 0.435 0.93 tTTF-I2 (2) 0.515 0.985
While the monoiodo TTF derivative 1 could not be properly crystallized, single crystals of the diiodo derivative 2 were analyzed by X-ray diffraction. 2 crystallizes in the monoclinic system, space group P21/n with one molecule in the asymmetric unit (Figure 1). The TTF molecules are associated into face-to-face dyads, as found for example in o-Me2TTF-I2,23 or EDO-TTF-I2,19 while I•••I contacts are found between molecules along the axis. The I•••I intermolecular distance, 3.994(1) Å, is close to the sum of van der Waals radii but it exhibits geometrical features characteristic of a type II interaction with C(3)–I(2)•••I(1) angle at 147.2(1)° and I(2)•••I(1)–C(2) angle at 89.4(1)°.
Figure 1. (a) Projection of the unit cell of 2 along the crystallographic a axis, showing the
face-to-face dimeric arrangements. (b) The type II I•••I halogen bonding interaction, leading to chains along the a axis.
Electrocrystallization experiments were performed with 1 in the presence of the ClO4– anion. When an hydrated (n-Bu)4NClO4 electrolyte was used, a 1:1 salt formulated as (1)ClO4•CH2Cl2 has been isolated as large plates. In the strict absence of water, the mixed-valence 2:1 salt (1)2ClO4 was obtained as smaller, thicker plates. The solvated 1:1 salt crystallizes in the triclinic system, space group P–1 with two cations, one anion and one CH2Cl2 molecule in the asymmetric unit (Figure 2). Intramolecular bond lengths within the TTF core (Table 2) confirm the +1e charge with the central Ci=Ci bond lengthening and concomitant Ci–S bond shortening upon oxidation, when compared for example with the structure of neutral 2. The oxidized cationic molecules are associated two-by-two into face-to-face eclipsed dyads with very short S•••S intermolecular distances, 3.277(4) and 3.461(7) Å, corresponding to a strong overlap interaction between cation radicals, with the two electrons in the bonding combination of the two SOMOs. One single halogen bonding interaction takes place between the iodine atom of 1+• cation and one oxygen atom of the ClO4– anion. The contact is close to a linear conformation, with C(2)–I(1)•••O(4) angle of 172.2(2)°. The I•••O distance, 2.997(9) Å, is notably shorter than the van der Waals contact distance (1.98 + 1.52 = 3.50 Å). For comparison purposes with literature data,17 a contact distance involving the ionic
radius of oxygen (1.76 Å) has been also defined as rvdw(I) + rionic(O) = 1.98 + 1.76 = 3.74 Å, giving a reduction ratio, dI••O/[rvdw(I) + rionic(O)] of 0.80.
Figure 2. Dyadic association of (1)+• cation radicals in the 1:1 salt (1)ClO4•CH2Cl2, together with halogen bonding interaction with the ClO4– anion.
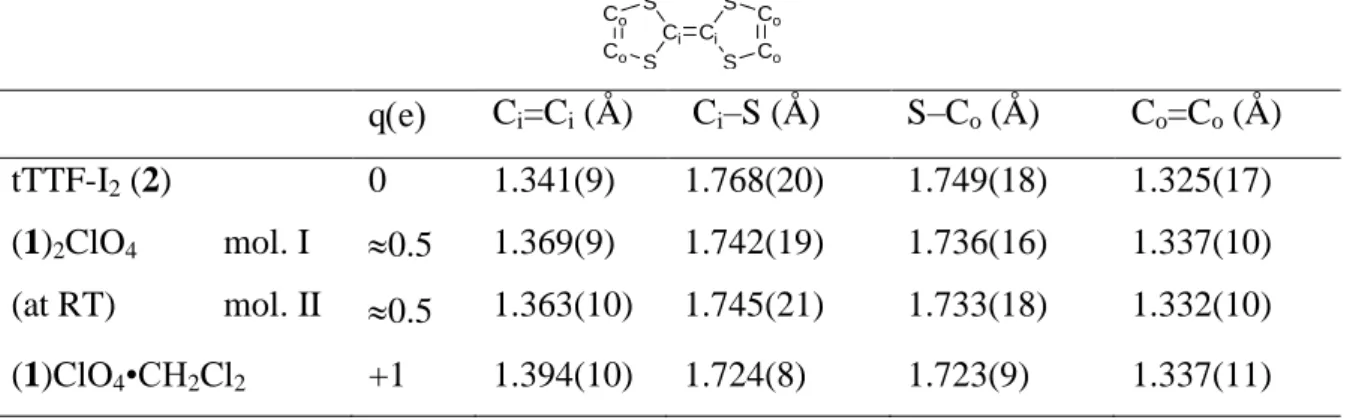
Table 2. Averaged intramolecular bond distances (in Å) in the TTF core in neutral 2, and
oxidized 1 molecules, along with their net charge q(e) estimated from the intramolecular distances Co Co S Ci S Ci S Co Co S qe Ci=Ci (Å) Ci–S (Å) S–Co (Å) Co=Co (Å) tTTF-I2 (2) 0 1.341(9) 1.768(20) 1.749(18) 1.325(17) (1)2ClO4 mol. I (at RT) mol. II 0.5 0.5 1.369(9) 1.363(10) 1.742(19) 1.745(21) 1.736(16) 1.733(18) 1.337(10) 1.332(10) (1)ClO4•CH2Cl2 +1 1.394(10) 1.724(8) 1.723(9) 1.337(11)
The metallic, halogen bonded, 2:1 salt. As detailed above, anhydrous electrocrystallization
conditions afforded systematically the 2:1 salt, formulated as (1)2ClO4. It crystallizes in the triclinic system, space group P–1 with one ClO4– and two donor molecules in the asymmetric unit. The ClO4– anion exhibits positional disorder at room temperature. X-ray data collected at 150 and 100 K were properly refined with one single anion position. The X-ray data collection at 100 K was performed in high resolution conditions using Mo-K radiation ( = 0.71073 Å) with max diffraction angle up to 45.9°. Indeed, charge density analysis based on experimental high-resolution low-temperature X-ray diffraction data permits nowadays to characterize the features associated to chemical bonding and intermolecular interactions such as hydrogen bonding.24 Very few high-resolution structural investigations of halogen bonding
have been reported to date to characterize the electron density between the halogen bond donor and acceptor atoms.25,26 Furthermore, the possible evolution of the charge of the tetrathiafulvalene molecule 1 with temperature offers an attractive playground to evaluate the effect of charge on the halogen bond strength.27,28
Intramolecular bond distances within the TTF core are collected in Table 2 and confirm the mixed valence character, with C=C and C–S bond distances intermediate between those of neutral TTF and those of the 1+• cation radical described above. Note that the two crystallographically independent TTFs bear apparently a comparable charge ( +0.5e) at room temperature. The halogen bonding interaction takes place between the iodine atoms of the partially oxidized 1 molecules and the oxygen atoms of the ClO4– anion. As shown in Figure 3, short and linear interactions take place with C(2)–I(1)•••O(2) and C(2A)–I(1A)•••O(1) angles at 169.0(4) and 168.8(3)°, while the I•••O distances correspond to a very small reduction ratio of 0.77 with respect to the addition of the van der Waals radii, confirming that the negative tetrahedral ClO4– anion acts here as a strong halogen bond acceptor.
Figure 3. Halogen bond motif in (1)2ClO4, at 150 K.
Note also that its non-centrosymmetric character combined with the 2:1 stoichiometry leads to the presence of two crystallographically independent TTF molecules, noted Mol. I and Mol. II in Figure 3, at variance with most halogen bonded salts where the symmetric anion [Br–, Ag(CN)2–, Ni(CN)42–, ... ] is most often located on an inversion centre.
Attempts to perform the electron density (r) analysis of crystalline (1)2ClO4 were made at 100 K, by using the Hansen-Coppens29 multipolar model of (r), which is implemented in the MoPro suite of programs.30,31 At convergence, the residual density maps show only random noise appearing around the light atoms of the structure, but due to strong absorption effects caused by the heaviest atom in the structure – iodine ((Mo-Kα) = 5.74 mm-1) the noise level around the halogen atom in both tTTF-I molecules of the asymmetric unit is still high (see Figure S1 in supporting information). In addition, looking at the ORTEP plot of the ClO4 anion (see Figure S2 in supporting information) and comparing the Uiso
magnitudes of the four oxygen atoms with respect to the average magnitude in the crystal structure (<Uiso> = 0.01367 Å2), three of them exhibit quite high magnitudes. This feature
seems to be related to a small disorder effect that could not be solved. In the case of the O(2) atom, the established I(1')∙∙∙O(2) halogen bonding interaction (2.877 Å), avoids the disorder and leads to an isotropic atomic displacement Uiso(O(2)) almost twice smaller than for the
other three oxygens with Uiso = 0.0264(3) Å2 for O(2), and 0.0453(4), 0.0421(4) and
0.0480(3) Å2 for O(1), O(3) and O(4), respectively. It should be however pointed out that the intermolecular interaction I(1)∙∙∙O(3) (2.870 Å) is not able to reduce the important displacement of O(3), supporting an involved static disorder. Accordingly, problems related to unsolved disorder features and absorption effects seem to be at the origin of a bad multipolar charge density description. As a consequence, the experimental model of (r) is not of enough quality to carry out a precise charge density analysis.
Nevertheless, providing the net charge of the ClO4 moiety equal to –1e, the information about the redistribution of the +1e net charge between the two t-TTF-I molecules belonging to the asymmetric unit could be extracted. For this purpose, we have firstly undertaken a standard X-XHO refinement,32 where the atomic multipoles were experimentally determined by refinement against the X-ray structure factors, except for iodine atoms, for which multipoles were transferred from the (r) model obtained from periodic theoretical calculations on the crystal phase of 4-iodo-1,3-dithiol-2-one33 (even if the atomic environment of iodine differs, the transferred multipolar model is methodologically better than the spherical one used in classical structure determination). This procedure permits to improve the deconvolution of the deformation electron density from the thermal smearing effect, minimizing the influence of the valence electron-shells to obtain a more precise modeling of the structural and thermal atomic displacement parameters (x, y, z and Uij). This is needed to
undertake a Kappa refinement,34 which permits to derive a good estimation of the partial charge transfer and the spherical expansion/contraction of the atoms. Accordingly, after convergence of the X-XHO model and the subsequent Kappa refinement, the partial charge transfer between atoms in cations indicates that, at 100 K, the +1e distributes almost equally between the two tTTF-I molecules (+0.52/+0.48 e), supporting the assumptions made above from the intramolecular bond distances.
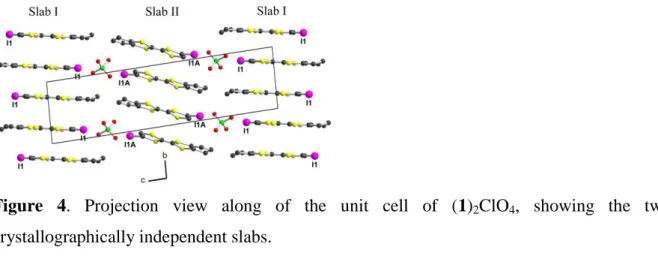
Solid state properties. A projection view along the a axis of the unit cell of (1)2ClO4 (Figure 4) shows that the two crystallographically independent molecules organize into two crystallographically independent slabs, with different intermolecular overlap within each slab (See below).
Figure 4. Projection view along of the unit cell of (1)2ClO4, showing the two crystallographically independent slabs.
Such a dual-layer situation has been only encountered in a few cases, either in BEDT-TTF salts such as (BEDT-TTF)2PtCl6(PhCN),35 -κ-(BEDT-TTF)2[Hg(SCN)3],36 ′-θ-(BEDT-TTF)2[C(SO2CF3)3],37 -′′-(BEDT-TTF)4[(NH4)M(C2O4)3]•(solvent),38 or κ- '-(BEDT-TTF)2[Ag(CF3)4]•(TCE),39 and in other donor salts as (EDO-TTF)2X (EDO-TTF = ethylenedioxotetrathiafulvalene, X = GaCl4 and ReO4),40 (TMET-STF)2X (TMET-STF = trimethylene(ethylenedithio)diselenadithiafulvalene; X = ClO4 and BF4),41 or H -(DMEDOTSeF)2[Au(CN)4]•THF where DMEDOTSeF is dimethyl(ethylenedioxy)-tetraselenafulvalene.42 In many instances, the presence of two crystallographically independent molecules, which then further segregate into crystallographically independent slabs, can be attributed to an asymmetry in the anion layer, eventually enhanced by directional intermolecular interactions at the interface. For example, as shown in scheme 2a-b, an hydrogen bond interaction of a TTF primary amide derivative with the tetrahedral ReO4
–
anion (Scheme 2a),43 or a S•••Te interaction in a [Ni(dmit)2] salt with Me3Te+ cation (Scheme 2b),44 favor similar organization with two crystallographically independent molecules, which may then eventually, but not automatically, segregate into different conducting slabs. Similarly, halogen bond interactions of [Ni(dmit)2]– with N-Me-2,5-dihalopyridinium,45 N-Et-3,5-dihalopyridinium (Scheme 2c),46 or N-Et-4-halothiazolium cations,47 also give rise to bilayer formation. We will discuss below the specificities of such dual-layer structures for the understanding of their physical properties.
S S S S S S N O H S S S S S S N O H Re O O O O H H H H Slab I Slab II S Ni S S S S S S S S S (a) (b) S Ni S S S S S S S S S Te Slab I Slab II S Ni S S S S S S S S S (c) S Ni S S S S S S S S S Slab I Slab II N I I
Scheme 2. Three examples of conducting salts with crystallographically independent
conducting slabs with distinct intermolecular interactions.
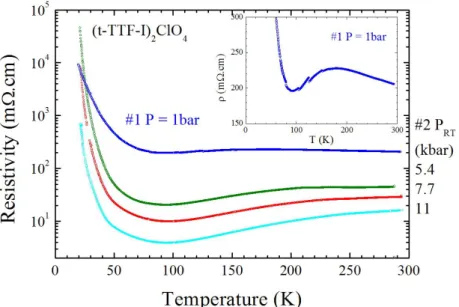
The temperature dependence of the resistivity of (1)2ClO4 at ambient pressure (Figure 5 insert) shows a slightly localized behavior with a smooth maximum around 180 K and a conducting regime down to 90 K. Then a broad metal to insulator (MI) transition takes place below this temperature. Under pressure, the room temperature conductivity (5 (cm)-1) increases only slightly (Figure S3 in SI). This behavior is a the signature of an essentially metallic character (an exponential increase is expected for insulating compounds), which is clearly observed on the temperature dependence of the resistivity at higher pressures (the broad maximum of resistivity is shifted above room temperature). However, the temperature of the MI transition is found to be pressure-independent around 90 K. The magnetic susceptibility (Figure S4 in SI) exhibits an essentially temperature independent paramagnetism with 0 = 2 10–5 cm3 mol–1, also in accordance with a Pauli-type susceptibility of a good metal. The MI transition has a limited effect, with the contribution of a Curie tail which corresponds to 0.36% S = ½ species, indicating that this transition is not associated with a magnetic ground state.
Figure 5. Temperature dependence of the resistivity (in log scale) of (1)2ClO4, at ambient pressure and under hydrostatic pressure: 5.4, 7.7 and 11 kbar. The insert shows the ambient pressure data in a linear scale for resistivity.
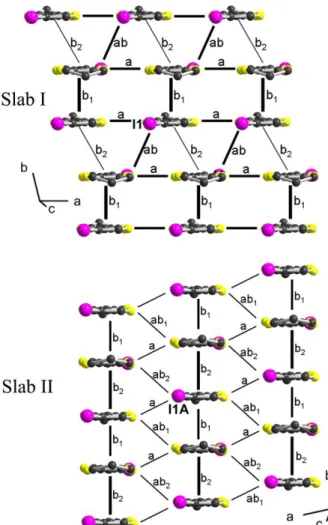
The origin of the metallic behaviour of this two-slab system can be found in the intermolecular interactions within the two crystallographically independent slabs. For that purpose, HOMO-HOMO interactions energies were calculated within the two slabs. As shown in Figure 6, slab I is characterized by a strong dimerization (interaction b1), with large interactions of the mixed-valence dyad both along crystallographic a and a+b directions. On the other hand, slab II exhibits a typical one-dimensional structure, with large b1 and b2 interactions along the staking b-axis, while lateral interactions between stacks are negligible.
Figure 6. Side view of the two crystallographically independent slabs, with calculated
intermolecular interactions. In slab I: b1 = 0.333, b2 = 0.038, a = 0.166, ab = 0.169 eV. In slab II: b1 = 0.354, b2 = 0.494, a = 0.024, ab1 = 0.106, ab2 = 0.076 eV.
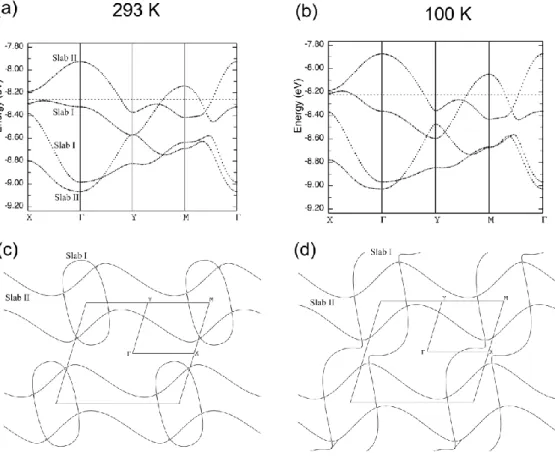
Band structure calculations were performed, based on the X-ray crystal structures determined at room temperature and at 100 K (Figure 7). Two molecular orientations are found within each slab, hence four bands are considered for the whole salt. Since no overlap interactions exist between slabs, two bands are associated with Slab I, the two other with Slab II. At room temperature, the Fermi surface is composed of closed ellipses associated with 2D interactions within Slab I, together with parallel wrapped lines associated with dominant 1D interactions within Slab II, in agreement with the calculated HOMO-HOMO interaction energies mentioned above.
When lowering the temperature to 100 K, the band structure is not significantly modified, except around the X point. This has important consequences on the Fermi surface. Indeed, as shown in Figure 7c-d, the closed ellipses of Slab I transform into open planes, revealing a more one-dimensional character with strongest interactions along the a-axis while
the parallel wrapped lines associated with dominant 1D interactions along the b-axis within Slab II are kept unchanged. In other words, the cell contraction observed upon cooling tends to destroy the two-dimensional character associated with Slab I, leading to an original electronic structure made of two different conducting slabs with orthogonal one-dimensional electronic structures, as observed for example in (Me3Te)[Ni(dmit)2]2.44 This evolution is most probably at the origin of the metal- insulator transition occurring at lower temperatures, through a charge localization within the most strongly associated dyads identified in each of the two slabs in Figure 6 (interaction b1 in slab I, interaction b2 in slab II).
Figure 7. Top: calculated band structure for (1)2ClO4, at (a): room temperature and (b): 100 K. Bottom: calculated Fermi surfaces for the two slabs at (c): room temperature and (d): 100 K.
Raman studies. In order to complement the transport and magnetic measurements and to gain
some further insight on the nature of the metal-insulator transition, Raman studies have been performed. This technique is also particularly useful to investigate the possibility for charge ordering as a possible origin of the metal-insulator transition.48 Indeed, because of the halogen bonding interaction with the tetrahedral, non-centrosymmetric ClO4– anion, we are already in
presence of two crystallographically independent donor molecules. Analysis of bond distances, and high resolution X-ray data (see above) suggest that the two molecules bear the same charge (+0.5e) above the metal-insulator transition down to about 90 K. Spectroscopic data available down to 10 K can help us to understand the low-temperature regime. It is well known that for TTF derivatives the vibrational modes related to C=C stretching vibrations are especially sensitive for the ionization degree, and hence particularly useful for studies of charge ordering in organic conductors.49 Raman spectra of fully ionized tTTF-I+ in the 1:1 salt (1)ClO4•CH2Cl2 as well as of neutral tTTF-I0 molecule were additionally measured for comparison purposes.
Room temperature spectrum of the 1:1 salt (1)ClO4•CH2Cl2 is shown in Figure 8. The electrical vector of the laser beam was parallel to the direction of maximum band intensity, i.e. nearly parallel to the a-axis. In the region of C=C stretching vibrations, we observe three bands at 1415, 1478, and 1454 cm–1 which are related to the tTTF-I+ cations, i.e. the central C=C, anti-phase ring C=C and in-phase ring C=C stretching, respectively. In the case of symmetrical TTF derivatives, the anti-phase ring C=C stretching vibration is only IR active but tTTF-I has no centre of symmetry, therefore all C=C modes show both IR and Raman activity. The cations of other TTF derivatives (also unsymmetrical) possess analogous C=C stretching modes, respectively at: 1420, 1478, 1505 cm–1 for TTF+;50 1418, 1547, 1567 cm–1 for TMTTF+;51 1417, 1483, 1556 cm–1 for o-DMTTF+.52 The strong bands at 503 and 511 cm -1
are to be attributed to in-phase ring breathing mode and the band at 462 cm–1 to anti-phase ring breathing mode. In our Raman spectra of neutral tTTF-I, the C=C stretching bands have been found at 1510 cm–1 (central C=C), 1546 cm–1 (anti-phase ring C=C) and 1610 cm–1 (in-phase ring C=C).
Figure 8. Room temperature Raman spectrum of the 1:1 salt (1)ClO4•CH2Cl2 (excitation λ = 632.6 Å)
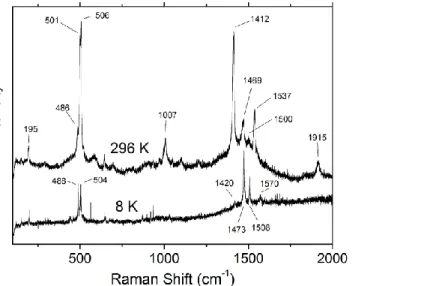
In Raman spectra of the 2:1 salt (1)2ClO4 at T = 296 K, we observe the C=C stretching bands at 1412, 1469, 1500, 1510, 1537 and 1610 cm–1 (Figure 9). These bands are clearly related to molecules with different degree of ionization. The strongest lines at 1412, 1469 and 1537 cm–1 are attributed to the three C=C modes of the fully ionized tTTF-I+. Additionally, the band at 1510 cm–1 can be assigned to the anti-phase C=C ring stretching of tTTF-I+0.5 and the band at 1610 cm–1 to the in-phase C=C ring stretching of tTTF-I0. This spectrum clearly indicates that at ambient temperature, the charge in conducting layers is not distributed uniformly, in contradiction with structural properties detailed above. However, it should be emphasized that the ratio of intensities of bands attributed to molecules with various ionization degrees was different for different crystals. For example, in some samples, the spectral feature at 1469 cm–1 (Figure 9) consisted of two lines at about 1458 and 1467 cm–1, which can be assigned to the central C=C mode of tTTF-I+0.5 and anti-phase ring C=C mode of tTTF-I+ (or vice versa). This observation demonstrates that the charge distribution undergoes strong fluctuations whose amplitude is slightly different in different crystals. On decreasing the temperature, the spectrum undergoes considerable modifications. At T = 8 K, the strongest bands at 1473, 1508 and 1570 cm–1 are related to the three C=C modes of tTTF-I+0.5, though one can also find a much weaker broad feature at about 1420 cm–1 attributed to tTTF-I+1 (Figure 9).
Figure 9. Raman spectrum of the 2:1 salt (1)2ClO4 at T = 296 K and 8 K (excitation λ = 632.6 Å)
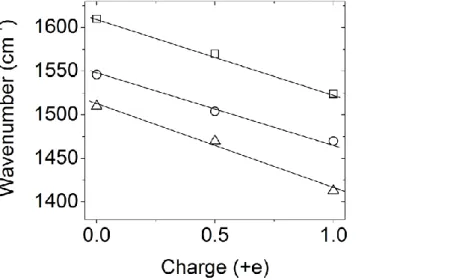
As for other TTF derivatives, the three C=C stretching modes of tTTF-I are very sensitive to the degree of ionization. We have verified that they obey an approximately linear dependence against charge (Figure 10). Such linear dependence is often observed for TTF derivatives, nevertheless in many charge-transfer salts, the central C=C stretching mode shows a deviation from linear behavior because of strong coupling with electrons.49
Figure 10. Frequency of C=C stretching modes of tTTF-I against the ionization degree.
As already mentioned above, the room temperature spectra of the 2:1 (1)2ClO4 salt were slightly different for various samples, particularly with different intensity ratio for the C=C bands assigned to molecules with charge +0.5e and +1e (bands of neutral molecules were not well seen because of much weaker intensity). Similarly, the temperature dependence of the spectra also differs from one crystal to the other (Figure S5 in SI). However, a general feature observed for all the studied samples was that on temperature decreasing, the intensity of bands corresponding to tTTF-I+0.5 molecules increased, while the intensity of tTTF-I+1 bands was either constant or strongly decreased.
Discussion
Our Raman studies provide an unambiguous evidence of a non-uniform charge distribution at room temperature (+1e, +0.5e, 0e), while at low temperature the distribution becomes almost uniform (+0.5e). This type of charge disproportionation is very surprising as in most organic conductors it is just opposite: the charge distribution is uniform at high temperatures and becomes non-uniform at low temperatures. In these salts, the charge
ordering effect is usually related with strong electron correlations, especially inter-site Coulomb repulsion.53 However, it was recently suggested that coupling between anions and cations also plays an important role in the charge-ordering transitions, both in one- and two-dimensional systems.54 These anion-cation interactions can lead to a cooperative displacement wave of anions accompanied by a modulation of charge density on donors.55 In the 2:1 salt (1)2ClO4, the anion exhibits a positional disorder in the metallic phase at room temperature (see above). Its freezing at lower temperatures is expected to strengthen the I•••O interactions, with an evolution to an ordered state of the anion at low temperatures. Within this frame, in the high temperature phase, the fluctuating ClO4– positions and the associated varying I•••O interactions could favor charge fluctuations on the donor molecules.
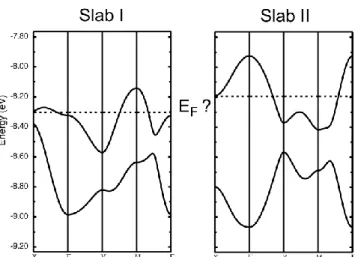
Another rationale for this behavior can be found in the very specific structure of this dual-layer salt, with two crystallographically independent slabs. We have seen above (Figure 7) the evolution of the Fermi surface calculated for both slabs together. It is interesting however to perform these calculations separately for each slab. As shown in Figure 11, if we assume a ¾-filling of the bands in each slab, that is, an average +0.5e charge for each crystallographically independent donor molecule, the calculated Fermi level in the two slabs is found to differ by 0.11 eV (In slab I, EF = –8.3044 eV; in slab II, EF = –8.1944 eV). Since there is one single Fermi level for the real crystal, it implies that a small electron transfer from Slab II to Slab I has necessarily to occur, in order to recover a common Fermi level, found indeed at the intermediate –8.259 eV value, as shown in Figure 7a. This fractional electron transfer has been evaluated here from the fraction of the first Brillouin zone (FBZ) defined by the 1D system of Slab II, where the upper partially filled band (Figure 11) does not overlap with the lower occupied band. For an exact +0.5e charge, the occupied and empty states are expected to be in equal number. In the real system (Figure 6), the occupied states of the 1D Fermi surface of Slab II represent 43% of the whole FBZ, indicating a +0.07e transfer from slab II to slab I to reach a common Fermi level. This small electron transfer between the two slabs can be at the origin of the charge disproportionation observed at room temperature and below by Raman spectroscopy, as detailed above.
Figure 11. Calculated band structure for each of the two slabs in (1)2ClO4, based on the RT crystal structure, and assuming a ¾-filling of the bands in each case, that is, an average +0.5 charge for each crystallographically independent donor molecule.
This striking charge-transfer possibility should be actually potentially observed in every dual-layer systems mentioned above,35–46 provided that charge is delocalized in both layers. This has been indeed suggested and/or calculated in (TMET-STF)2BF4,41b with a proposed +0.40/+0.60e charge distribution, in --(BEDT-TTF)2[CH(SO2CF3)2], with +0.56/+0.42e distribution between the two different layers,37 or in - ''-(BEDT-TTF)4[(NH4)Ga(C2O4)3]•(PhCH2CN) where calculations suggested donor charges of +0.57e ('') and +0.43e ().38 A definitive demonstration was recently provided with angular-dependent magnetoresistance in H-(DMEDOTSeF)2[Au(CN)4]•THF,42 where SdH oscillations showed two closed orbits, associated to the two crystallographically independent donor layers with different charges [ = 0.051(5) e].
An opposite situation is found for example in the two isomorphous -(N-Me-3,5-diiodopyridinium)[Ni(dmit)2]2, and (N-Me-3-bromo-5-iodopyridinium)[Ni(dmit)2]2 salts,46 where one observes an alternation of Mott insulating (Layer I), and 2D conducting (Layer II) layers. Under those circumstances, the strong on-site Coulomb repulsion in Layer I excludes an addition of excess electrons from Layer II and the band filling for both Layer I and II is the same. A similar situation has been also mentioned in κ-'-(BEDT-TTF)2[Ag(CF3)4]•(TCE), where the charge-order insulating state of the -layer is associated with half filling of the -layer, as confirmed within experimental error from de Haas–van Alphen (dHvA) oscillation measurements.39 In the absence of such a strong localization, that is, in situations where both layers are conducting, as here in (1)2ClO4, one should be very careful when calculating Fermi surfaces based on an exact 0.5e charge transfer.
These examples combined with our own results on (tTTF-I)2ClO4 demonstrate that the deviation of charge from a strict 0.5e value, on crystallographically independent molecules in such dual layer systems, is a key ingredient to understand their charge and spin fluctuations. While X-ray data do not allow for a precise enough determination when only a few percent charge fluctuations are involved, Raman technique provides here a very useful tool to identify them, and their evolution with temperature.
Conclusions
We have described here an original metallic, cation radical salt (tTTF-I)2ClO4 where two crystallographically independent donor molecules give rise to two independent slabs, thanks to a specific, asymmetrical, I•••O halogen bond interaction with the non-centrosymmetric ClO4
–
anion. Evolution of the band structure and Fermi surface upon cooling shows that the metal-insulator transition is attributable to the loss of the 2D character of the electronic structure of one of the two slabs. Raman spectra show evidence for charge disproportionation on the donor molecules at high temperature, disappearing below the Metal-Insulator transition, because of charge localization in both layers. Two rationales for this behavior were proposed, (i) the halogen bond interaction with disordered ClO4– anion leads to charge fluctuations on the donor molecules, through a polarization mechanism, as found in conductors with Charge-Order state, (ii) the deviation from exact +0.5e finds its origin in an inter-layer charge-transfer due to differences of electronic structures of both slabs. Both channels contribute to the observed phenomena and demonstrate that it is the asymmetry of the counter-ion sub-system which forces the formation of two different slabs, with different electronic structures. Inter-layer charge transfer is then eventually observed, if charges in both layers are delocalized.
Experimental Section
Syntheses
Iodotrimethylenetetrathiafulvalene 1. A solution of tTTF22 (170 mg, 0.7 mmol) in THF (30 mL) was treated with a THF solution of freshly prepared lithium diisopropylamide (LDA, 1.05 mmol) at –80 oC. The temperature was kept between –80 to –60 oC for 2 hours, and 1-iodoperfluorohexane (0.14 mL, 1.05 mmol) was added to this solution at –80 oC, leading to a darkening of the solution. The reaction mixture was allowed to reach room temperature overnight.
Water was added to the solution and the mixture was extracted with diethylether (3 × 50 mL). The organic layer was dried with MgSO4 and the solvent was evaporated under reduced pressure. The crude product was separated on silica gel column chromatography (CS2 – petroleum ether 1:2) and afforded first 1 as orange powder (160 mg, 60 % based on tTTF) followed by 2 as red crystals (15 mg, ~ 5 % based on tTTF).
Diiodotrimethylenetetrathiafulvalene 2. A solution of tTTF (150 mg, 0.6 mmol) in THF (50
mL) was treated with a THF solution of freshly prepared lithium diisopropylamide (LDA, 4.0 mmol) at –80 oC. The temperature was kept between –80 to –60 oC for 4 hours, and a white precipitate appeared. 1-Iodoperfluorohexane (0.46 mL, 2.4 mmol) was added to this solution at –80 oC, leading to a darkening of the solution. The cooling bath was removed and the reaction was left to warm to room temperature. Water was added to the solution and the mixture was extracted with diethylether (3 × 100 mL). The organic layer was dried with MgSO4 and the solvent was evaporated under reduced pressure. The crude product was separated on silicagel column chromatography (CS2–petroleum ether 1:2) and afforded 2 as red polycrystalline powder (130 mg, 44 % based on tTTF). Recrystallization from chloroform afforded dark red crystals.
1: m.p. 160 oC. 1H NMR (CDCl3) : 2.545 (t, 4H) 2.436 (m, 2H) ppm. 13C NMR (CDCl3) : 133.05, 124.05, 119.15, 112.06, 76.59, 30.13, 27.68 ppm. ESI-MS (m/z): 369.8478 (M+). Elem. Anal. Calcd. for C9H7IS4: C, 29.19; H, 1.91; S, 34.63. Found: C, 28.98; H, 1.88; S, 35.48.
2 : m.p. 188 oC (dec.). 1H NMR (CDCl3) : 6.414 (s, 1H), 2.543 (t, 4H) 2.442 (m, 2H) ppm. 13
C NMR (CS2/CDCl3) : 132.11, 120.91, 112.48, 75.75, 29.37, 27.14 ppm. ESI-MS (m/z): 495.7440 (M+). Elem. Anal. Calcd. for C9H6I2S4: C, 21.98; H, 1.22; S, 25.85. Found: C, 21.60; H, 1.27; S, 26.96.
Electrocrystallizations
(1)2ClO4. Electrocrystallization experiments were performed in two-compartment cells in freshly dried dichloromethane (10 mL) with (n-Bu)4NClO4 (100 mg) as electrolyte and 1 (5 mg). Single crystals of (1)2ClO4 were obtained by galvanostatic electrolysis (1 μA, 3 days at 5 o
C)
(1)ClO4•(CH2Cl2). Using hydrated (n-Bu)4NClO4 (H2O 10%) in similar conditions (0.5 A, 5 days at 10°C) afforded instead large plates of a solvated 1:1 phase.
X-ray Diffraction Studies. Single crystals were mounted on the top of a thin glass fiber. Data
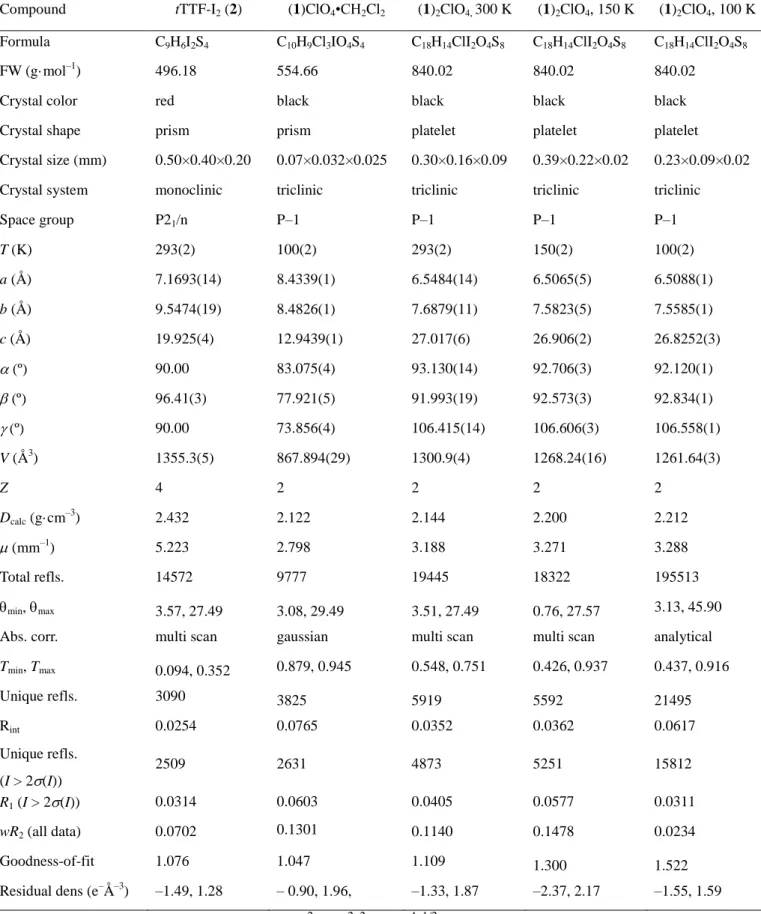
were collected on either an Enraf-Nonius KappaCCD, a Bruker-ASX APEXII, or a CCD-based Oxford-Xcalibur-Atlas diffractometer, with graphite-monochromated Mo-K radiation ( = 0.71073 Å). Structures were solved by direct methods (SHELXS-97, SIR97)56 and refined (SHELXL-97)57 by full-matrix least-squares methods, as implemented in the WinGX software package.58 Absorption corrections were applied. Hydrogen atoms were introduced at calculated positions (riding model), included in structure factor calculations, and not refined. Crystallographic data are summarized in Table 3. CCDC-964969 for tTTFI2, CCDC-964970 for (tTTF-I)ClO4•CH2Cl2 and CCDC 964971-73 for (tTTFI)2ClO4 at 293, 150 and 100 K.
Table 3. Crystallographic data
R1 = ||Fo| – |Fc||/|Fo|; wR2 = [w(Fo2 – Fc2)2/wFo4]1/2.
Compound tTTF-I2 (2) (1)ClO4•CH2Cl2 (1)2ClO4, 300 K (1)2ClO4, 150 K (1)2ClO4, 100 K
Formula C9H6I2S4 C10H9Cl3IO4S4 C18H14ClI2O4S8 C18H14ClI2O4S8 C18H14ClI2O4S8
FW (g·mol–1) 496.18 554.66 840.02 840.02 840.02 Crystal color red black black black black Crystal shape prism prism platelet platelet platelet
Crystal size (mm) 0.50×0.40×0.20 0.07×0.032×0.025 0.30×0.16×0.09 0.39×0.22×0.02 0.23×0.09×0.02 Crystal system monoclinic triclinic triclinic triclinic triclinic Space group P21/n P–1 P–1 P–1 P–1 T (K) 293(2) 100(2) 293(2) 150(2) 100(2) a (Å) 7.1693(14) 8.4339(1) 6.5484(14) 6.5065(5) 6.5088(1) b (Å) 9.5474(19) 8.4826(1) 7.6879(11) 7.5823(5) 7.5585(1) c (Å) 19.925(4) 12.9439(1) 27.017(6) 26.906(2) 26.8252(3) (º) 90.00 83.075(4) 93.130(14) 92.706(3) 92.120(1) (º) 96.41(3) 77.921(5) 91.993(19) 92.573(3) 92.834(1) (º) 90.00 73.856(4) 106.415(14) 106.606(3) 106.558(1) V (Å3) 1355.3(5) 867.894(29) 1300.9(4) 1268.24(16) 1261.64(3) Z 4 2 2 2 2 Dcalc (g·cm –3 ) 2.432 2.122 2.144 2.200 2.212 (mm–1) 5.223 2.798 3.188 3.271 3.288 Total refls. 14572 9777 19445 18322 195513 min, max 3.57, 27.49 3.08, 29.49 3.51, 27.49 0.76, 27.57 3.13, 45.90 Abs. corr. multi scan gaussian multi scan multi scan analytical
Tmin, Tmax 0.094, 0.352 0.879, 0.945 0.548, 0.751 0.426, 0.937 0.437, 0.916 Unique refls. 3090 3825 5919 5592 21495 Rint 0.0254 0.0765 0.0352 0.0362 0.0617 Unique refls. (I > 2(I)) 2509 2631 4873 5251 15812 R1 (I > 2(I)) 0.0314 0.0603 0.0405 0.0577 0.0311 wR2 (all data) 0.0702 0.1301 0.1140 0.1478 0.0234 Goodness-of-fit 1.076 1.047 1.109 1.300 1.522 Residual dens (e–Å–3) –1.49, 1.28 – 0.90, 1.96, –1.33, 1.87 –2.37, 2.17 –1.55, 1.59
Band Structure Calculations. The tight-binding band structure calculations and HOMO-HOMO interaction energies were based upon the effective one-electron Hamiltonian of the extended Hückel method,59 as implemented in the Caesar 1.0 chain of programs.60 The off-diagonal matrix elements of the Hamiltonian were calculated according to the modified Wolfsberg-Helmholz formula.61 All valence electrons were explicitly taken into account in the calculations and the basis set consisted of double- Slater-type orbitals for C, S, Br and I and single-Slater-type orbitals for H. The exponents, contraction coefficients, and atomic parameters for C, S, I, and H were taken from previous work.62
Resistivity measurements. The electrical resistivity measurements for (1)2ClO4 were performed on platelet-shaped single crystals of typical dimensions 0.6 x 0.1 x 0.01 mm3. The samples were contacted by means of the evaporation of gold contacts and 17 μm gold wires attached with silver paste A four point method was used with a low frequency (< 100 Hz) lock-in technique using a measuring current Iac = 1 A. Resistivity measurements were performed at ambient pressure and also under high hydrostatic pressure in a CuBe clamped cell up to 12 kbar with silicon oil (Daphne 7373) as the pressure transmitting medium. The pressure at room temperature was extracted from the resistance of a manganin gauge in the pressure cell and it is this value that is indicated in the figures. However, the loss of pressure during cooling is estimated to 2 kbar. A copper-constantan thermocouple inside the pressure cell was used as the thermometer. Cooling down to 8 K was achieved in a helium free cryocooler equipment.
Raman studies. Raman spectra of (1)2ClO4 within the wavenumber range 150-3100 cm-1 were measured on single crystals in a backscattering geometry. The measurements were performed on a Labram Horiba Jobbin Yvon 800 spectrometer equipped with He-Ne laser (632.8 nm) and a liquid-nitrogen cooled CCD detector. The beam of a He-Ne laser (λ=632.8 nm) was focused on the best-developed crystal face and, to avoid possible sample decomposition, its power was reduced down to about 0.1 mW. The electrical vector of the laser beam was either parallel or perpendicular to the direction of maximum band intensity. The Raman spectra of (1)2ClO4 were measured as a function of temperature in the region T = 8-300 K. The samples were mounted in a continuous flow vacuum helium cryostat with KBr or quartz windows. Typical temperature variation rate was about 2 K/min. Additionally, room temperature Raman
spectra of neutral tTTF-I and its 1:1 cation radical salt (tTTF-I)ClO4•CH2Cl2 were investigated.
Acknowledgments
This work was performed with the support from ANR (Paris, France) under contract n° ANR-08-BLAN-0091-02, from the Polish National Science Centre (Decision No. DEC-2012/04/M/ST3/00774) and the CNRS (France) through a CNRS-PAN program 2013-14 (n° 178219). We warmly thank Dr Enric Canadell (ICMAB Barcelona) for insightful comments.
References
1
P. Batail, Chem. Rev., 2004, 104, 4887. 2
H. M. Yamamoto, J.-i. Yamaura and R. Kato, J. Am. Chem. Soc., 1998, 120, 5905; H. M. Yamamoto, Y. Kosaka, R. Maeda, J.-i. Yamaura, A. Nakao, T. Nakamura and R. Kato,
ACSNano, 2008, 2, 143.
3
P. Batail, S. J. LaPlaca, J. J. Mayerle and J. B. Torrance, J. Am. Chem. Soc., 1981, 103, 951; J. B. Torrance, A. Girlando, J. J. Mayerle, J. I. Crowley, V. Y. Lee, P. Batail and S. J. LaPlaca, Phys. Rev. B, 1981, 47, 1747.
4
See for example: M.-H. Whangbo, J. M. Williams, A. J. Schultz, T. J. Emge and M. A. Beno, J. Am. Chem. Soc., 1987, 109, 90.
5
M. Fourmigué and P. Batail, Chem. Rev., 2004, 104, 5379. 6
Halogen Bonding, Fundamentals and Applications, P. Metrangolo and G. Resnati, Eds,
Struct. Bonding Vol.126, Springer Verlag Berlin Heidelberg, 2008.
7
N. Ramasubbu, R. Parthasarathy and P. Murray-Rust, J. Am. Chem. Soc., 1986, 108, 4308; V. R. Pedireddi, D. S. Reddy, B. S. Goud, D. C. Craig, A. D. Rae and G. R. Desiraju, J.
Chem. Soc. Perkin Trans. 2, 1994, 2353; T. Sakurai, M. Sundaralingam and G. A. Jeffrey, Acta Crystallogr., 1963, 16, 354; G. R. Desiraju and R. Parthasarathy, J. Am. Chem. Soc.,
1989, 111, 8725. 8
C. M. Reddy, M. T. Kirchner, R. C. Gundakaram, K. A. Padmanabhan and G. R. Desiraju,
Chem. Eur. J., 2006, 12, 2222.
9
T. T. T. Bui, S. Dahaoui, C. Lecomte, G. R. Desiraju and E. Espinosa, Angew. Chem. Int.
10
S. C. Nyburg and W.Wong-Ng, Inorg. Chem., 1979, 18, 2790; S. C. Nyburg and W. Wong-Ng, Proc. R. Soc. London Ser. A, 1979, 367, 29.
11
P. Metrangolo, H. Neukirsch, T. Pilati and G. Resnati, Acc. Chem. Res., 2006, 38, 386. 12
G. Cavallo, P. Metrangolo, T. Pilati, G. Resnati, M. Sansotera and G.Terraneo, Chem. Soc.
Rev. 2010, 39, 3772; P. Metrangolo, T. Pilati, G. Terraneo, S. Biella and G. Resnati, CrystEngComm, 2009, 11, 1187.
13
See for example: H. Bock and S.Holl, Z. Naturforsch. B, 2001, 56, 152; S. Triguero, R. Llusar, V. Polo and M. Fourmigué, Cryst. Growth Des., 2008, 8, 2241; (c) P. Metrangolo, F. Meyer, T.; Pilati, G. Resnati and G. Terraneo, Chem. Commun., 2008, 1635.
14
P. Cauliez, V. Polo, T. Roisnel, R. Llusar and M. Fourmigué, CrystEngComm, 2010, 12, 558.
15
G. M. Espallargas, L. Brammer and P. Sherwood, Angew. Chem., Int. Ed., 2006, 45, 435. 16
J. E. Ormond-Prout, P. Smart and L. Brammer, Cryst. Growth Des., 2012, 12, 205. 17
A. Abate, J. Marti-Rujas, P. Metrangolo, T. Pilati, G. Resnati and G.Terraneo, Cryst.
Growth Des., 2011, 11, 4220.
18
T. Imakubo, H. Sawa and R.Kato, Synth. Metals, 1995, 73, 117; T. Imakubo, T. Shirahata, K. Hervé and L. Ouahab, J. Mater. Chem., 2006, 16, 162.
19
Y. Kuwatani, E. Ogura, H. Nishikawa, I. Ikemoto and M. Iyoda, Chem. Lett., 1997, 817; M. Iyoda, H. Suzuki, S. Sasaki, H. Yoshino, K. Kikuchi, K. Saito, I. Ikemoto, H. Matsuyama and T. Mori, J. Mater. Chem., 1996, 6, 501; M. Iyoda, Y. Kuwatani, E. Ogura, K. Hara, H. Suzuki, T. Takano, K. Takeda, J.-I. Takano, K. Ugawa, M. Yoshida, H. Matsuyama, H. Nishikawa, I. Ikemoto, T. Kato, N. Yoneyama, J.-i. Nishijo, A. Miyazaki and T. Enoki,
Heterocycles, 2001, 54, 833.
20
K.-S. Shin, M. Brezgunova, O. Jeannin, T. Roisnel, F. Camerel, P. Auban-Senzier and M. Fourmigué, Cryst. Growth Design, 2011, 11, 5337.
21
A. S. Batsanov, A. J. Moore, N. Robertson, A. Green, M. R. Bryce, J. A. K. Howard and A. E. Underhill, J. Mater. Chem., 1997, 7, 387.
22
P. Vaca, C. Coulon, S. Ravy, J. P. Pouget and M. Fabre, J. Physique I, 1991, 1, 125; J.-M. Fabre, A. K. Gouasmia, L. Giral and J.-M. Gaultier, New J. Chem., 1988, 12, 119; J.-M. Fourmigué, E. W. Reinheimer, A. Assaf, O. Jeannin, A. Saad, P. Auban-Senzier, P. Alemany, A. Rodríguez-Fortea and E. Canadell, Inorg. Chem., 2011, 50, 4171. 23
C. Wang, J. Y. Becker, J. Bernstein, A. Ellern and V. Khodorkovsky, J. Mater. Chem., 1995, 5, 1559.
24
(a) P. Coppens, X-ray Charge Densities and Chemical Bonding; Oxford University Press: Oxford, U.K., 1997. (b) T. S. Koritsanszky and P. Coppens, Chem. Rev., 2001, 101, 1583. 25
R. Bianchi, A. Forni and T. Pilati, Chem. Eur. J., 2003, 9, 1631. 26
T. T. T. Bui, S. Dahaoui, C. Lecomte, G. R. Desiraju and E. Espinosa, Angew. Chem. Int.
Ed., 2009, 48, 3838; M. E. Brezgunova, J. Lieffrig, E. Aubert, S. Dahaoui, P. Fertey, S.
Lebègue, J. G. Ángyán, M. Fourmigué and E. Espinosa, Cryst. Growth Des., 2013, 13, 3283.
27
S. Tsuzuki, A. Wakisaka, T. Ono and T. Sonoda, Chem. Eur. J., 2012, 18, 951. 28
J. Lieffrig, O. Jeannin, A. Frackowiak, I. Olejniczak, R. Swietlik, S. Dahaoui, E. Aubert, E. Espinosa, P. Auban-Senzier and M. Fourmigué, Chem. Eur. J., 2013, in press, DOI:
10.1002/chem.201302507 29
N. K. Hansen and P. Coppens, Acta Crystallogr., Sect. A., 1978, 34, 909. 30
MoPro: C. Jelsch, B. Guillot, A. Lagoutte and C. Lecomte, J. Appl. Crystallogr., 2005, 38, 38.
31
MoProViewer: B. Guillot, Acta Crystallogr., Sect. A., 2011, 67, C511. 32
E. Espinosa, C. Lecomte, E. Molins, S. Veintemillas, A. Cousson and W. Paulus, Acta
Crystallogr., Sect. B., 1996, 52, 519.
33
M. E. Brezgunova, S. Dahaoui, E. Aubert, C. Jelsch, P. Fertey and E. Espinosa, Manuscript in preparation.
34
P. Coppens, T. N. G. Row, P. Leung, E. D. Stevens, P. J. Becker and Y. W. Yang, Acta
Crystallogr., Sect. A., 1979, 35, 63.
35
M.-L.; Doublet, E. Canadell and R. P. Shibaeva, J. Phys I France, 1994, 1, 1479; A. A. Galimzyanov, A. A. Ignatev, N. D. Kushch, V. N. Laukhin, M. K. Makova, V. A.
Merzhanov, L. P. Rozenberg, R. P. Shibaeva and E. B. Yagubskii, Synth. Met., 1989, 33, 81; V. E. Korotkov, V. N. Molchanov and R. P. Shibaeva, Sov. Phys. Crystallogr., 1992,
37, 776. 36
J. A. Schlueter, U. Geiser, M. A. Whited, N. Drichko, B. Salameh, K. Petukhov and M. Dressel, Dalton Trans., 2007, 2580.
37
J. A. Schlueter, U. Geiser, H. H. Wang, A. M. Kini, B. H. Ward, J. P. Parakka, R. G. Daugherty, M. E. Kelly, P. G. Nixon, G. L. Gard, L. K. Montgomery, H.-J. Koo and M.-H. Whangbo, J. Solid State Chem., 2002, 168, 524.
38
(a) H. Akutsu, A. Akutsu-Sato, S. S. Turner, P. Day, E. Canadell, S. Firth, R. J. H. Clark, i. Yamada and S. Nakatsuji, Chem. Commun., 2004, 18; L. Martin, P. Day, H. Akutsu,
J.-i. Yamada, S. J.-i. Nakatsuji, W. Clegg, R. W. Harrington, P. N. Horton, M. B. Hursthouse, P. McMillan and S. Firth, CrystEngComm, 2007, 9, 865.
39
J. A. Schlueter, L. Wiehl, H. Park, M. de Souza, M. Lang, H. J. Koo and M. H. Wangbo, J.
Am. Chem. Soc., 2010, 132, 16308; T. Kawamoto, T. Mori, A. Nakao, Y. Murakami, and J.
A. Schlueter, J. Phys. Soc. Jpn., 2012, 81, 023705; T. Kawamoto, T. Mori, T. Terashima, S. Uji, and J. A. Schlueter, J. Phys. Soc. Jpn., 2013, 82, 024704.
40
A. Ota, H. Yamochi and G. Saito, J. Low Temp. Phys., 2007, 142, 429. 41
Y. Okano, H. Sawa, S. Aonuma and R. Kato, Chem. Lett., 1993, 1851; R. Kato, K.
Yamamoto, Y. Okano, H. Tajima and H. Sawa, J. Chem. Soc., Chem. Commun., 1997, 947. 42
T. Kawamoto,T. Mori, D. Graf, J. S. Brooks, Y. Takahide, S. Uji, T. Shirahata and T. Imakubo, Phys. Rev. Lett., 2012, 109, 147005; T. Shirahata, M. Kibune and T. Imakubo,
Chem. Commun., 2006, 1592.
43
K. Heuzé, M. Fourmigué, P. Batail, E. Canadell and P. Auban-Senzier, Chem. Eur. J., 1999, 5, 2971.
44
M. Fujiwara and R. Kato, J. Chem. Soc., Dalton Trans., 2002, 3763; R. Kato, M. Fujiwara, Y. Kashimura and J.-i. Yamaura, Synth. Metals, 2001, 120, 675; R. Kato, T. Imakubo, H. Yamamoto, R. Maeda, M. Fujiwara, J.-i. Yamaura and H. Sawa, Mol. Cryst. Liq. Cryst., 2002, 380, 61.
45
T. Kusamoto, H. M Yamamoto, N. Tajima, Y. Oshima, S. Yamashita and R. Kato, Inorg.
Chem., 2012, 51, 11645.
46
Y. Kosaka, H. M. Yamamoto, A. Nakao, M. Tamura and R. Kato, J. Am. Chem. Soc., 2007,
129, 3054; S. Fujiyama, A. Shitade, K. Kanoda, Y. Kosaka, H. M. Yamamoto and R. Kato,
Phys. Rev. B, 2008, 77, 060403; K. Hazama, S. Uji, Y. Takahide, M. Kimata, H. Satsukawa,
A. Harada, T. Terashima, Y. Kosaka, H. Yamamoto and R. Kato, Phys. Rev. B, 2011, 83, 165129; Y. Kosaka, H. M. Yamamoto, A. Tajima, A. Nakao, H. Cui and R. Kato,
CrystEngComm, 2013, 15, 3200.
47
T. Kusamoto, H. M. Yamamoto and R. Kato, Cryst. Growth Des. 2013, 13, 4533. 48
K. Yakushi, Crystals, 2012, 2, 1291. 49
T. Yamamoto, M. Uruichi, K. Yamamoto, K. Yakushi, A. Kawamoto and H.Taniguchi, J.
Phys. Chem. B, 2005, 109, 15226.
50
R. Bozio, I. Zanon, A. Girlando and C. Pecile J. Chem. Phys., 1979, 71, 2282. 51
R. Meneghetti, R. Bozio, I. Zanon, C. Pecile, C. Ricotta and M. Zanetti, J. Chem. Phys., 1984, 80, 6210.
52
E. W. Reinheimer, D. Jankowski, R. Świetlik and M. Fourmigué, J. Chem. Crystallogr., 2013, 43, 178.
53
H. Seo, C. Hotta and H. Fukuyama, Chem. Rev., 2004, 104, 5005. 54
J.-P.; Pouget, P. Foury-Leylekian, P. Alemany and E. Canadell, Phys. Stat. Sol. B, 2012,
249, 937; E. Rose and M. Dressel, Physica B, 2012, 47, 1987; P. Alemany, J.-P. Pouget and
E. Canadell, Phys. Rev. B, 2012, 85, 195118. 55
J.-P. Pouget, Crystals, 2012, 2, 466; L. Zorina, S. Simonov, C. Mézière, E. Canadell, S. Suh, S.E. Brown, P. Foury-Leylekian, P. Fertey, J.P. Pouget and P. Batail, J. Mater. Chem., 2009, 19, 6980.
56
A. Altomare, M. C. Burla, M. Camalli, G. Cascarano, C. Giacovazzo, A. Guagliardi, A. G. G. Moliterni, G. Polidori and R. Spagna, J. Appl. Crystallogr., 1999, 32, 115.
57
SHELX97 - Programs for Crystal Structure Analysis (Release 97-2). G. M. Sheldrick, (1998).
58
L. J. Farrugia, J. Appl. Cryst., 1999, 32, 837. 59
M.-H. Whangbo and R. Hoffmann, J. Am. Chem. Soc., 1978, 100, 6093. 60
J. Ren, W. Liang and M.-H. Whangbo, Crystal and Electronic Structure Analysis Using
CAESAR, 1998.
61
J. Ammeter, H.-B. Bürgi, J. Thibeault, R. Hoffmann, J. Am. Chem. Soc., 1978, 100, 3686. 62
B. Domercq, T. Devic, M. Fourmigué, P. Auban-Senzier, E. Canadell, J. Mater. Chem., 2001, 11, 1570.
GRAPHICAL ABSTRACT
Inter-layer charge fluctuations are identified in a dual-layer metallic conductor, around the non-centrosymmetric, halogen-bonded perchlorate anion