HAL Id: hal-00278392
https://hal.archives-ouvertes.fr/hal-00278392
Submitted on 13 May 2008HAL is a multi-disciplinary open access
archive for the deposit and dissemination of sci-entific research documents, whether they are pub-lished or not. The documents may come from teaching and research institutions in France or abroad, or from public or private research centers.
L’archive ouverte pluridisciplinaire HAL, est destinée au dépôt et à la diffusion de documents scientifiques de niveau recherche, publiés ou non, émanant des établissements d’enseignement et de recherche français ou étrangers, des laboratoires publics ou privés.
Computational fluid dynamics and measurement of flow
field and wall temperature distribution in a scraped heat
exchanger crystallizer.
Marcos Rodriguez, Florent Ravelet, Rene Delfos, J. J. Derksen, Geert-Jan
Witkamp
To cite this version:
Marcos Rodriguez, Florent Ravelet, Rene Delfos, J. J. Derksen, Geert-Jan Witkamp. Computational fluid dynamics and measurement of flow field and wall temperature distribution in a scraped heat exchanger crystallizer.. Proceedings of the 17th International Symposium on Industrial Crystallization, Sep 2008, maastricht, Netherlands. pp.1889-1896. �hal-00278392�
COMPUTATIONAL FLUID DYNAMICS AND
MEASUREMENT OF FLOW FIELD AND
WALL TEMPERATURE DISTRIBUTION IN
A SCRAPED HEAT EXCHANGER CRYSTALLIZER
M. Rodriguez Pascual
1, F. Ravelet
2,3, R. Delfos
2, J.J. Derksen
4,G.J. Witkamp
11Process & Energy Dept. Delft University of Technology, the Netherlands 2Laboratory for Aero and Hydrodynamics, Delft University of Technology, the
Netherlands
3lnstitut de Mécanique des Fluides de Toulouse, France 4University of Alberta, Canada
Abstract
During crystallization the control and effective distribution of heat transfer from the solution to the heat exchanger (HE) plays an important role. Inhomogeneity in temperature on the HE-surface limits the production capacity and increases the tendency of an isolating scale layer formation. To avoid scaling, scraper blades on the HE are commonly used.
In a typical axi-symmetric geometry the scale layer formation was investigated. In a previous paper [ROD08] we studied the influence of the flow field on the actual heat transfer distribution 1) by directly measuring the surface temperature field of the HE using LCT and 2) by measuring the flow field inside the crystallizer using 3C-PIV. Due to the difficulty to measure the scraping area, in this paper we studied by computational fluid dynamics simulations the flow characteristics in this area and compare them for verification with the previous experimental results.
The large eddy simulations (LES) performed here using Lattice Boltzmann scheme confirmed the measurements results and gave accurate information of the not measurable area between scrapers just above the HE surface. We tested also the strength of LES Lattice Boltzmann simulations for complicated geometries such scraped heat exchanger crystallizers.
1. Introduction
Several crystallization processes consist of liquid solutions that by the action of heat exchangers are brought into supersaturated regions where crystals will form. In industrial continuous processes, where solution is constantly fed into the crystallizer, control and stability of the bulk solution temperature is mandatory. For this reason a degree of turbulent flow in the crystallizers is necessary to achieve good mixing of the whole solution. The heat transfer rates are directly responsible for the production rates. The residence times of the solution in the crystallizer will determine size and quality of the crystals.
To obtain the desired supersaturation the solution is cooled down (as in Eutectic Freeze crystallization) or heated up (as in Evaporative Crystallization). This action is done by Heat Exchangers (HE) in direct contact with the solution. Near the HE surface exists a thermal boundary layer that depends on the crystallizer flow characteristics. Here the supersaturation is higher that in the bulk solution. Because of the higher supersaturation on the HE surface the nucleation and growth rates of the
crystals are faster than in the bulk solution. This situation is responsible for the formation of a scaling layer of crystals on the HE surface. As a consequence produces a decrease of heat transfer, affecting the stability of the crystallization process. To avoid this scale layer formation, it is common to use mechanical actions, such as scraping.
The scraping efficiency is directly proportional to the temperature difference between the bulk solution and the heat exchanger surface temperature [VAS02] [PRO05]. Depending on our solution and the characteristics of our mechanical scraping action (velocity, shapes and applied forces), we will have a maximum temperature difference between the solution and the heat exchanger surface where scaling will appear. In order to achieve the desired production rate and avoid the scaling layer problem we will have to apply the consequent scraping characteristics. For these reasons the heat exchanger surface temperature has to be as uniform as possible to control the unwanted scaling layer.
To study the ice scaling behaviour a lab scale scraped heat exchanger crystallizer was especially designed (Figure1).Further details about this setup and functioning can be found in [ROD08][VAS02][PRO05].
Figure 1. Scheme for performing continuous crystallising experiments.
Figure 2. Outer scraper of the CDCC first raised then damaged by a thick ice layer.
During all experiments in the Ice Scaling Crystalliser (ISC), the temperature of the crystallizer liquid constant, i.e. at the freezing temperature of the water, or at the eutectic temperature for a salt water system. With this system, we have run experiments in which we gradually increase the heat flux through the HE by gradually lowering the HE temperature. Doing so, we find that ice scaling (i.e. the formation of ice that is not removed by the scraper blades) starts in two distinct areas of the HE surface: 1) near the centre of the crystallizer and 2) close to the outside wall. The net effect is the formation of two rings of ice. When one keeps the process going anyway, the scrapers gradually get lifted up, and the function of the scrapers quickly deteriorates. In experiments in the Cooled Disk Column Crystalliser (CDCC) (an industrial scaled-up crystalliser version especially designed for EFC) [GEN05], exactly the same behaviour was observed. As we can see in Figure 2, continuation of the process ended with damage to the outer scraper.
In previous studies the HE surface temperature was measured using an adhesive thermochromatic liquid crystal sheet (TLC) glued directly onto the HE-surface. Further details of the experimental procedure are explained in [ROD08]
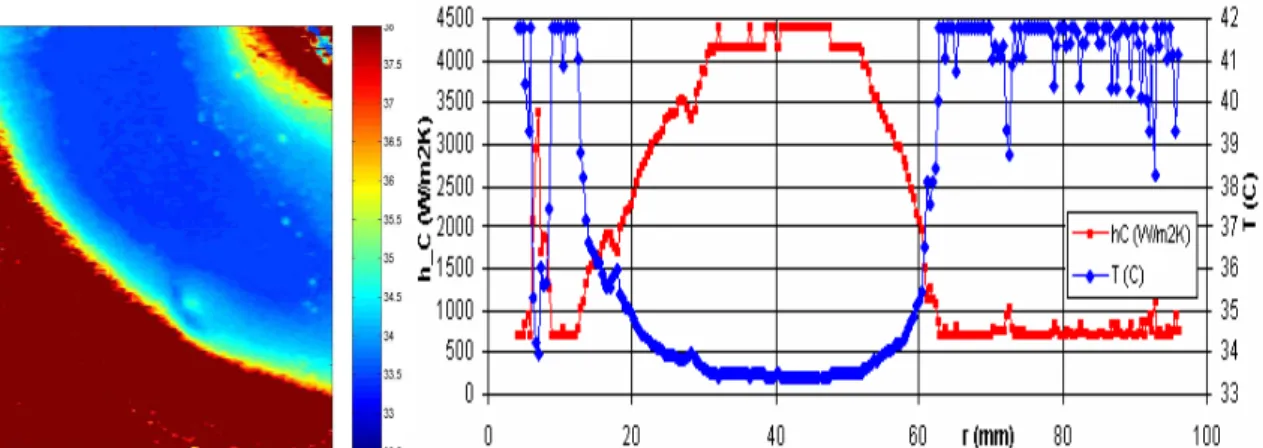
The result shows that, even though the process as a whole is stationary, the heat exchanger surface temperature is far from uniform (Figure 3). The radial profile of the temperature distribution T(r), is shown in Figure 4, together with the related local heat transfer coefficient, hC(r).
Figure 3. Post processed Temperature profile of the HE surface between scrapers. Figure 4. Radial distribution of temperature T(r) and convective heat transfer coefficient hC(r) on HE surface (between scrapers). Note: temperatures above 36oC are approximate (being outside the proper calibration range), as commented before. We saw that near the crystallizer centre and close to the outside that the heat transfer between HE and solution, hC(r), is lower than that somewhat halfway the radius by a
factor of at least five. This observation of temperature and heat transfer explains the observation of ice scaling in the ISC experiments. The remaining question was however the reason why hC varies so much over the HE plate.
To investigate the origin of the so much varying local heat transfer coefficient part of the field was investigated using Stereoscopic Particle Image Velocimetry, (3C-PIV),further details can be found in [ROD08].
Figure 5. Sketch of set-up for PIV measurements. with a PIV calibration grid-image inside/
The measuring area measures height 45 mm and width 80 mm, starting just above the scraper and at the outer wall, all as indicated in figure 5. Note that we were not able to measure the area just above the HE surface because of the scrapers.
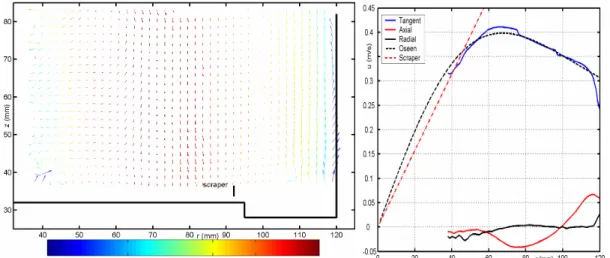
Figure 6a Average velocity field Note: the radial and tangential components are depicted as vectors, the tangential component in false colours. Figure 6b. Radial profiles of average velocity.
The average flow field is shown in figure 6a. Also, since the flow varies only little with height, we can obtain the axially averaged radial profiles, as shown in figure 6b. The measured flow field supports the picture obtained from the heat transfer distribution on the HE-surface: in the core, the heat transfer is low because of the absence of a mean flow. In the annulus, there is the secondary flow, which causes much better heat transport. Locally, the heat transfer is much increased where the solution descends onto the HE-surface; the boundary layer is thinned here by the stagnation flow. In contrast, the local heat transfer is reduced where the fluid temperature has adapted to the boundary temperature and ascends.
Although to study in detail the flow in between scrapers just above the heat exchanger surface we have to recur to other techniques such as in this case CFD simulations due to the problematic measuring access.
2. Simulation setup
To study the flow we used large eddy simulation (LES) in a lattice-Boltzmann scheme for discretizing the Navier-Stokes equations. The major reasons for employing a lattice Boltzmann discretization scheme are its almost full locality of operations, its computational efficiency (in terms of floating-point operations per lattice site and time step), and its ability to simulate flows in complex geometries. An interface model is avoided by modelling the geometry with an adaptive force field technique [DER99]. A direct simulation of stirred-tank flow at industrially relevant Reynolds numbers
Re≥104.(as in our case Re=5·104) is not feasible, as the resolution of all length and time scales in the flow would require enormous amounts of grid cells and time steps. However, the small scales in the flow can be assumed to be universal and isotropic, that is, independent of the specific flow geometry.
In a LES, the range of resolved scales is reduced by filtering out the small scales. The effect the small scales have on the larger scales is taken into account with a subgrid-scale model. In this research, a standard Smagorinsky model was used. A value of 0.12 was adopted for the Smagorinsky constant, which is within the range of values commonly used in shear-driven turbulence.
The LES methodology has proven to be a powerful tool to study and visualize stirred tank flows, because it accounts for the unsteady and periodic behavior of these flows, and can effectively be employed to explicitly resolve phenomena directly related to the unsteady boundaries. Results of the single-phase Lattice-Boltzmann LES code applied
to stirred tank flow have been extensively compared to averaged, and phase-resolved experimental data [DER99] [DER01].
The grid that is applied in the LES contained 1.2·107 nodes. As a result, the linear size of the cubic lattice cells amounted to approximately 1 mm. The time step size in the LES was such that one impeller revolution took 4200 time steps.
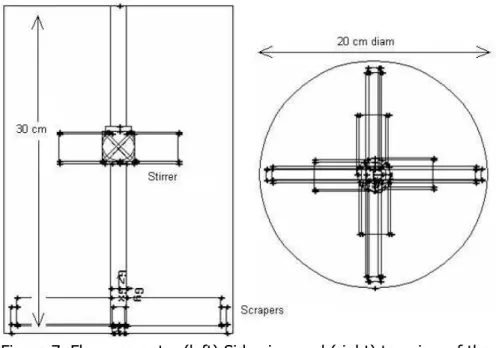
The stirred-scraped crystallizer configuration consists of a cylindrical, flat-bottomed, tank with diameter of 200 mm and 300 mm height. The crystallizer is scraped by four rotating scraper blades with a diameter of 192 mm that are driven by a vertical shaft. Halfway this shaft, a 45 pitch blade turbine with diameter of 100 mm is installed to keep the slurry homogenously mixed. The geometry is defined in Figure 7.
Figure 7. Flow geometry.(left) Side view and (right) top view of the crystalliser.
The Reynolds number that fully determines the single-phase flow is defined as Re=ND2/ν with N the impeller speed in rev/s, D the diameter of the scraper and ν the kinematic viscosity of the working fluid. The continuous phase was water with a density = 103 Kg/m3 and ν = 10-6 m2/s.
3. Results and discussion
Overall impressions of the flow field are given in Figure 8 where an instantaneous realization of the flow in the vertical plane after 14 revolutions is compared to the time averaged flow.
Figure 8. (Left) Instantaneous realization of the flow in the vertical plane after 14 revolutions versus (right) the time averaged flow after these 14 revolutions.
We can see that as in the previous results of PIV (Figure 6.a) the biggest velocity component is the tangential velocity, while it is forced directly by the rotating aerodynamically bluff scraper arms, and friction with the smooth outer wall and the free surface top is small. We can observe three distinct regions in the profile. Up to a radius of roughly 50 mm, the tangential liquid velocity matches that of the scraper-stirrer shaft. We can see in the simulations that this inner region is in solid-body rotation with the scraper-stirrer shaft, and there is no centrifugal or axial forcing at all; the latter is reflected as well in the small axial velocity. Beyond 60 mm, the velocity decreases again, and in this region the interesting transport processes take place. The axial profile shows a strong secondary flow; near the outer wall the fluid is flowing upwards, with a magnitude as much as 15% of the tangential velocity. This strong secondary flow component is driven by the rotating scraper arms, which near the bottom transport fluid outward by centrifugal forcing. Arriving at the outer wall, this flow is deflected upward as we measure it. By continuity, the fluid has to flow
somewhere radially inward and then downward; here we see a maximum downward flow occurring at 80 mm from the centre. When moving radially inward or outward, the flow tends to conserve its angular momentum [BAT67]; in a frictionless flow the result would be a potential vortex. As a simplified physical model to the flow, we fitted the measured tangential velocity profile with the Oseen vortex solution [BAT67], which gradually transits from a solid-body rotation inside region to a free vortex flow outside region, as shown in figure 6.b. Here we can see that in our case the picture matches qualitatively, but that the transition between the two regions is more abrupt than in the model.
The computational results completely support the measured flow field and the picture obtained from the heat transfer distribution on the HE-surface. In the inner part the heat transfer is low because of the absence of a mean flow. In the middle region there is the secondary flow, which causes much better heat transport. Locally, the heat transfer is much increased where the solution descends onto the HE-surface; the boundary layer is thinned here by the stagnation flow. In contrast, the local heat transfer is reduced where the fluid ascends and has adapted to the boundary temperature. This picture of heat transfer is much similar to that measured in turbulent Benard convection, where underneath stagnation regions the heat transfer is enhanced and underneath rising plumes reduced [DEL03][PET06].
Although now we can take a look in the non measurable area due the scrapers as we can see in Figure 9.
Figure 9. Vertical view of the flow field on the horizontal plane halfway the scraper height just above the HE and zoom of the right down quarter.
Here we can distinguee the turbulence created behind the scraper tip and how does affect also the middle area temperature shape distribution (Figure 3).
4. Conclusions
During experiments of Eutectic Freeze Crystallization we observed that ice scaling was formed in specific areas on the heat exchanger. Because the driving force for ice
scaling is the local supersaturation, and this is related to the solution temperature, we measured the temperature and heat transfer on the HE-surface.
The temperature results showed that indeed the temperature on the HE-surface was not uniform having temperature differences bigger than 4 oC, a difference more than sufficient to explain the local variation in scaling tendency. The temperature difference could directly be related to a variation in the local heat transfer coefficient over the HE-surface. Stereoscopic PIV measurements were carried out, which showed that the secondary fluid flow in this crystallizer geometry is responsible for the inhomogeneous heat transfer distribution.
For a more detail study of the flow just above the heat exchanger surface LES using Lattice Boltzmann scheme were performed. The simulations results agree with the PIV experimental measurements and show that is a powerful tool to investigate future designs.When designing cooling crystallizers and heat exchanger geometries, it is important to take flow-induced inhomogeneity in heat transfer into account, while this forms a strong limitation in the crystallizer performance.
5. Acknowledgment
The authors would like to acknowledge Prof. G. M. Van Rosmalen for her scientific input.
6. References
[BAT67] Batchelor, G.K.(1967) An Introduction to Fluid Dynamics. Cambridge University
[DEL03] Delfos, R. and Lagerwaard, R.,(2003)“Influence of large scale flow structures on convection at moderate Rayleigh numbers”, Eurotherm, Eindhoven, March 23-26 [DER99] Derksen, J. J., and H. E. A. Van den Akker, ‘‘Large Eddy Simulations on the Flow Driven by a Rushton Turbine,’’ AIChE J., 45(2),209(1999)
[DER01] Derksen, J., ‘‘Assessment of Large Eddy Simulations for Agitated Flows,’’ Trans. IChemE, 79A, 824Ž2001.
[MIL95] Mills, A.F., Basic Heat and Mass Transfer (2nd Edition), Prentice-Hall, 1995 [GEN05] Genceli, F.E., Gaertner, R. and Witkamp, G.J.(2005) Eutectic freeze crystallization of a 2nd generation cooled disk column crystallizer for MgSO4-H2O system. Journal of Crystal Growth , 275(1-2), pp. 1369-72.
[PET06] Petracci, A., Delfos, R. and Westerweel, J., , (2006) “Combined PIV/LIF measurements in a Rayleigh-Bénard convection cell”. 13th Int. Symp on Appl. Laser Techniques to Fluid Mechanics, Lisbon, Portugal, June 26 – 29
[PRO05] Pronk, P., Infante-Ferreira, C.A., Rodriguez Pascual, M. and Witkamp, G.J. (2005) Proc. 16th Int. Symp. on Industrial Crystallization. pp. 1141-46
[RAF98] Raffel, M., Willert, C. and Kompenhans, J., (1998)'Particle Image Velocimetry', Springer.
[RAV07] Ravelet, F., Delfos, R. and Westerweel, J.,(2007) “Experimental studies of liquid liquid dispersion in a turbulent shear flow”, paper 145 for TSFP-5, Munich, August 27-29
[ROD08] Rodriguez Pascual, M., Ravelet, F., Delfos, R., Witkamp, G.J.,(2008) Measurement of flow field and temperature distribution in a scraped heat exchanger crystallizer, Eurotherm, Eindhoven, May 18-22
[VAS02] Vaessen, R.J.C., Himawan, C. and Witkamp, G.J. (2002), Scale formation of ice from electrolyte solutions on a scraped surface heat exchanger plate. Journal of Crystal Growth, 237-239 (Pt.3), pp. 2172-77