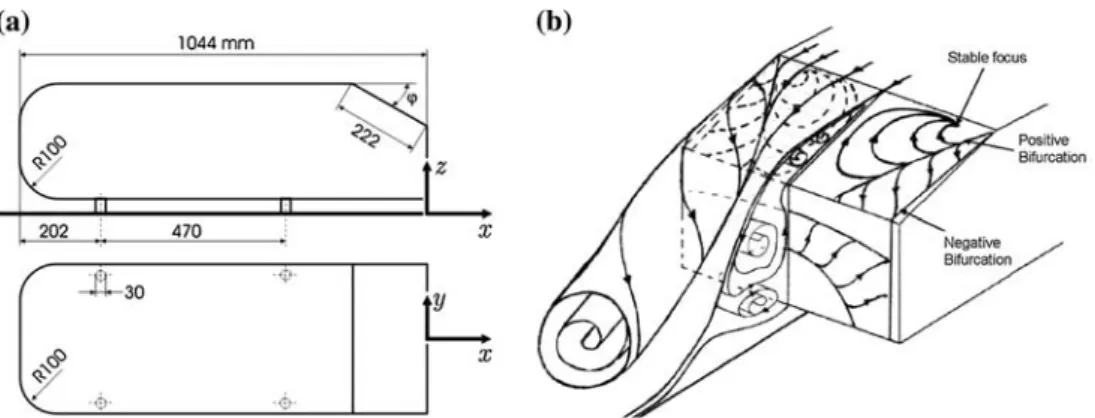
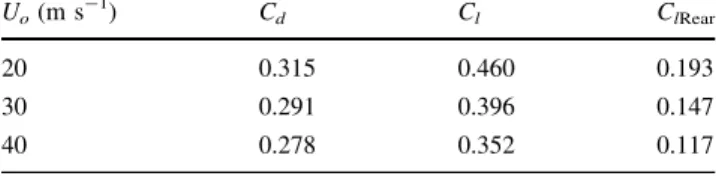
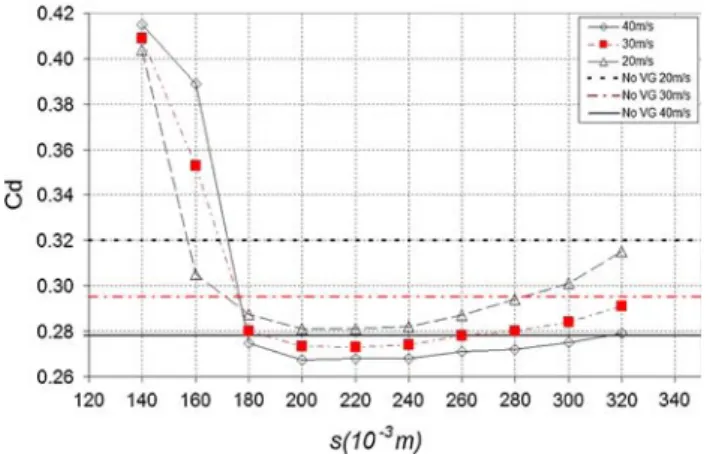
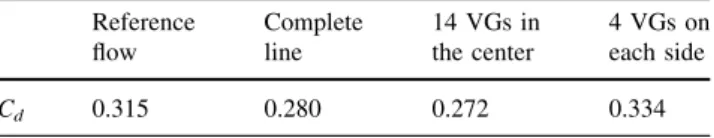
Drag and lift reduction of a 3D bluff-body using active vortex generators
Texte intégral
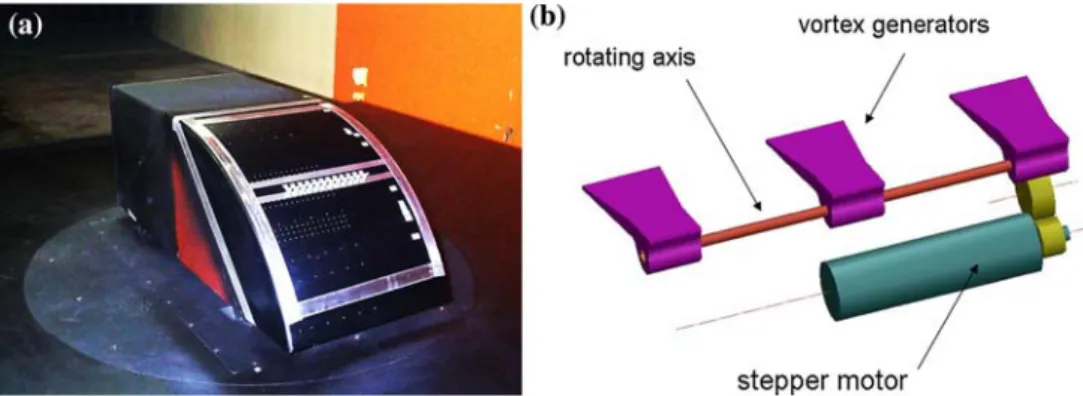
Figure


Documents relatifs
Below we derive the ac response of a graphene sample in the idealized case of perfectly transmitting edge channels and assuming that, at a given filling factor, all the chiral
En comparaison avec les corpus existants annotés discursivement (en particulier le Penn Discourse TreeBank pour l’anglais), le corpus ANNODIS présente deux carac- téristiques propres
These variations bring about a gradual change from the streamwise vortex pair, which has previously been shown to be susceptible to perturbations in the flow that result in
In order to determine the feedback control law, we consider an extended system coupling the equations governing the Navier-Stokes problem with an equation satisfied by the control
In the present study, the influence of the cylinder cross-section on the coherence length is studied experimentally in BETI wind tunnel, by hot-wire anemom- etry of the flow over
We were success- ful when we inspected data from the ROSAT All-Sky Survey database (RASS, Voges et al. In the soft band, the noise is probably too high and some of the emission might
In a sense, an adapted (best) basis Next section gives a brief review of noise removal serhisitmteyte.l(or signal en- .by thresholding and of wavepacket
method to prepare the organoclay/epoxy nanocomposites in liquid (ethanol and water solution) without any intermediate drying step of clay has been used but full exfoliation still
