Three billion years of crustal evolution in eastern Canada:
Constraints from receiver functions
L. Petrescu1, I. D. Bastow1, F. A. Darbyshire2, A. Gilligan1, T. Bodin3, W. Menke4, and V. Levin5 1Department of Earth Science and Engineering, Imperial College London, London, UK,2Centre de recherche GEOTOP,
Université du Québec à Montréal, Montreal, Quebec, Canada,3Laboratoire de Géologie de Lyon, École Normale
Supérieure de Lyon, Université de Lyon 1, Lyon, France,4Lamont-Doherty Earth Observatory, Columbia University,
Palisades, New York, USA,5Department of Earth and Planetary Sciences, State University of New Jersey Rutgers,
New Brunswick, New Jersey, USA
Abstract
The geological record of SE Canada spans more than 2.5 Ga, making it a natural laboratory for the study of crustal formation and evolution over time. We estimate the crustal thickness, Poisson’s ratio, a proxy for bulk crustal composition, and shear velocity (Vs) structure from receiver functions at anetwork of seismograph stations recently deployed across the Archean Superior Craton, the Proterozoic Grenville, and the Phanerozoic Appalachian provinces. The bulk seismic crustal properties and shear velocity structure reveal a correlation with tectonic provinces of different ages: the post-Archean crust becomes thicker, faster, more heterogeneous, and more compositionally evolved. This secular variation pattern is consistent with a growing consensus that crustal growth efficiency increased at the end of the Archean. A lack of correlation among elevation, Moho topography, and gravity anomalies within the Proterozoic belt is better explained by buoyant mantle support rather than by compositional variations driven by lower crustal metamorphic reactions. A ubiquitous ∼20 km thick high-Vslower crustal layer is imaged beneath the Proterozoic belt. The strong discontinuity at 20 km may represent the signature of extensional collapse of an orogenic plateau, accommodated by lateral crustal flow. Wide anorthosite massifs inferred to fractionate from a mafic mantle source are abundant in Proterozoic geology and are underlain by high-Vslower crust and a gradational Moho. Mafic underplating may have provided a source
for these intrusions and could have been an important post-Archean process stimulating mafic crustal growth in a vertical sense.
1. Introduction
Cratons are ancient continental remnants of Precambrian shields, commonly with Archean cores, which have survived thermal and mechanical erosion and are geologically distinct from younger continental regions. Many are underlain by seismically fast, deep (up to ∼300 km) lithospheric roots [e.g., Nettles and Dziewonski, 2008; Ritsema et al., 2011].
An early global compilation of wide-angle seismic data suggested that crustal properties in cratonic regions may be age dependent, with Archean (>2.5 Ga) crust being thinner than Proterozoic (2.5–0.5 Ga) and Phanerozoic (<550 Ma) terranes, owing to the lack of a mafic underplate layer [Durrheim and Mooney, 1991]. While some passive and active seismic surveys from cratons (e.g., the Yilgarn and Pilbara Cratons in Australia, Dharwar Craton in India, Sao Francisco in Brazil, and Rae and Hearne in Canada) support this hypothesis [e.g., Durrheim and Mooney, 1994; Thompson et al., 2010], the results from studies of others (Arabian Shield and Tanzania craton) do not [e.g., Zandt and Ammon, 1995; Abbott et al., 2000; Al-Damegh et al., 2005; Tugume et al., 2013]. However, no consensus has emerged concerning the extent to which modern tectonic processes can be extrapolated to a much younger and hotter Earth [e.g., Griffin et al., 2003]. Whether the processes that formed cratons were dominated by vertical mechanisms, like magmatic underplating [e.g., Durrheim and Mooney, 1991], deep-seated mantle plume and megaplume melt extraction [e.g., Hawkesworth et al., 2010; Wyman and Kerrich, 2002], and multistage delamination [e.g., Bédard, 2006; Zegers and Van Keken, 2001] or laterally oriented growth mechanisms analogous to modern style plate tectonics [e.g., Foley, 2008] such as Himalaya-Tibet-scale continental collisions [e.g., St-Onge et al., 2006] and multiple island arc accretion episodes [e.g., White et al., 2003; Miller and Eaton, 2010; Hammer et al., 2010] is uncertain.
RESEARCH ARTICLE
10.1002/2015JB012348 Key Points:
• We constrain the seismic crustal structure of the eastern Canadian Shield using receiver functions • Younger crustal domains show
thicker, seismically faster, and more mafic crust than Archean domains • Extensive mafic underplating played a
key role in Proterozoic crustal growth
Supporting Information:
• Text S1, Tables S1 and S2, and Data Set S1 caption • Data Set S1
Correspondence to:
L. Petrescu,
Citation:
Petrescu, L., I. D. Bastow, F. A. Darbyshire, A. Gilligan, T. Bodin, W. Menke, and V. Levin (2016), Three billion years of crustal evolution in eastern Canada: Constraints from receiver functions,
J. Geophys. Res. Solid Earth, 121,
788–811, doi:10.1002/2015JB012348.
Received 10 JUL 2015 Accepted 17 JAN 2016
Accepted article online 25 JAN 2016 Published online 9 FEB 2016
©2016. American Geophysical Union. All Rights Reserved.
Journal of Geophysical Research: Solid Earth
10.1002/2015JB012348
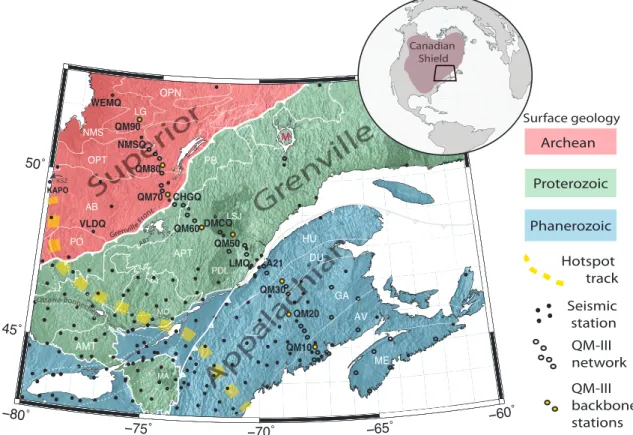
In this study, we focus on the southeastern margins of the Canadian Shield. The region includes the>2.5 Ga Superior Craton, the most extensive area of Archean crust in the world. The eastern margin of the Superior Craton is bordered by the 1.1 Ga Grenville Province (GP), an eroded Himalaya-Tibet-scale Proterozoic orogen of which a significant portion is composed of reworked rocks from the adjacent older provinces, including the Superior Craton. About 20% of the surface geology of the Grenville Province is made up of anorthosite massifs, feldspar-dominated igneous intrusions highly abundant in the Proterozoic. Much of the rest of the GP comprises rocks that formed in the roots of a large continental margin arc of late Paleoproterozoic to Mesopro-terozoic age (∼1.7–1.2 Ga). The remainder consists of the reworked margins of older orogens to the northwest and of<1.4 Ga Mesoproterozoic accreted terranes in the southeast. To the southeast of the Grenville Province is the Appalachian Province, carrying the signature of the closure of at least two oceanic tracts (Iapetus and Rheic oceans) which occurred in a series of collisions between 495 and 260 Ma. The Phanerozoic Great Meteor hot spot crossed the region from NW to SE during the Mesozoic [Sleep, 1990b], leaving a magmatic track that includes the kimberlites of the southeastern Superior Craton (165–134 Ma) and felsic plutons in the White Mountains of New Hampshire (∼109 Ma). The geological record of SE Canada spans 3 billion years of Earth’s history, making it an ideal natural laboratory to test hypotheses concerning Precambrian continental genesis, evolution and Moho resetting mechanisms, providing excellent opportunity to explore the extent to which crust of different ages is able to resist modification by hot spot tectonism.
Using teleseismic receiver function analysis, we estimate crustal seismic properties beneath the region, includ-ing crustal thickness, Poisson’s ratio (a proxy for bulk crustal composition), shear velocity structure, and the nature of the Moho. We use a Bayesian probabilistic inversion method that estimates the shear velocity and discontinuity structure of the region. Our new seismic measurements from SE Canada, together with infer-ences from other geophysical data sets (e.g., Bouguer gravity), document the signature of crust formed at different times and potentially by the change of tectonic processes through 3 billion years of geologic history and have important implications for the formation and evolution of continental crust during the building of eastern North America.
2. Tectonic Setting
The Canadian Shield forms the Precambrian core of the North American continent and is a remnant of the Laurentia paleocontinent. It comprises a mosaic of cratonic provinces that assembled through a series of Paleoproterozoic (2.5–0.5 Ga) orogens [Hoffman, 1988]. The Superior Craton preserves the largest exposed area of Archean rocks in the world (Figure 1) and formed before 2.6 Ga (the oldest rocks are reportedly older than 4 Ga) [e.g., O’Neil et al., 2011]. It comprises a set of greenstone belts (e.g., Abitibi and La Grande River), bordered by plutonic provinces (Opatica), metasedimentary sequences resembling accretionary prisms (Pontiac and Nemiscau), and high-grade gneiss complexes (Bienville and Minto) [Percival, 2007]. Structural trends vary from E-NE in the western and central Superior to N-S in northern Quebec.
The eastern margin of Laurentia was reworked during the Grenville Orogeny (GO), one of the largest tectonic episodes of Proterozoic times, a 100 Ma long Himalaya-Tibet-scale event [Hynes and Rivers, 2010] that marked the formation of the Rodinia supercontinent. Laurentia collided with Amazonia around 1.1 Ga [Li et al., 2008], strongly reworking the Laurentian cratonic margins. The Laurentian margin is thought to have been the site of a long-duration Andean-style arc that preceded the GO [Rivers, 1997]. The Grenville Province has three main tectonic domains. The Allochthonous Monocyclic Terranes (AMT) in the SW are considered to be exotic terranes accreted to Laurentia during a convergence period between 1080 and 1035 Ma [Carr et al., 2000]. The Allochthonous Polycyclic Terranes (APT) comprise rocks originally part of a Laurentian continental margin arc setting, reworked during the GO and tectonically transported in the hanging wall of a major structure known as the Allochthon Boundary Thrust (ABT) (Figure 1). Much of the Grenville Province is underlain by granulite and upper amphibolite facies rocks that are interpreted to have formed in the orogenic midcrust during the GO at ∼1080–1050 Ma [Rivers et al., 2002]. Some regions appear to have escaped Grenvillian metamorphism and are termed collectively the “orogenic lid.” The orogenic lid comprises remnants of the upper orogenic crust that was downdropped during extensional collapse and is now adjacent to the exhumed high-grade midcrust. Also, the ABT was reworked in extension, supporting the hypothesis that the Grenville was a hot long-duration plateau similar to Tibet, which experienced progressive collapse and potentially midcrustal channel flow [Rivers, 2008; Jamieson et al., 2007]. After a 20 Ma tectonic hiatus, the orogenic activity migrated toward the foreland, similar to the Himalayas’ propagating thrust system. The Parautochthonous Belt (PB)
Figure 1. Geological map of the study area showing geologic boundaries and station locations. AB: Abitibi, ABT: Allochthon Boundary Thrust, AMT:
Allochthonous Monocyclic Terranes, APT: Allochthonous Polycyclic Terranes, AV: Avalon, DU: Dunnage, GA: Gander, HU: Humber, KSZ: Kapuskasing Structural Zone, LG: La Grande, LSJ: Lac Saint-Jean anorthosite complex, M: Manicouagan crater, MA: Marcy Anorthosite, ME: Meguma, MO: Morin Anorthosite, NMS: Nemiscau, OPN: Opinaca, OPT: Opatica, PB: Parautochthonous Belt, PDL: Parc des Laurentides anorthosite complex, and PO: Pontiac; white solid lines: subprovince boundaries; white dashed lines: failed Neoproterozoic rifts (Ottawa-Bonnechere Graben and Saint Lawrence Valley); dark shading: anorthosite massifs; and thick dashed line: Great Meteor hot spot track as inferred by Heaman and Kjarsgaard [2000].
was formed between 1010 and 980 Ma, as a response to the second orogenic Grenvillian pulse which caused medium- and high-pressure metamorphism in the footwall of the ABT between the Grenville Front and the ABT [Rivers, 2008]. The Grenville Front (GF) is a low to moderately dipping thrust zone that marks the limit of the Grenvillian metamorphic signature. It was also proposed that locally, the GF is a preexisting zone of weakness, reactivated during the GO [e.g., Martignole and Calvert, 1996].
Massive magmatic intrusions comprise 20% of the surface geology in the Grenville Province. Anorthosite massifs are components of the AMCG (anorthosite-mangerite-charnockite-granite) suites and are highly felds-pathic intrusive rocks with a geochemical signature unique to Proterozoic times, although some geochemi-cally distinct anorthosites are also occasionally found in layered mafic-ultramafic Archean complexes. Their ages within the Grenville Province range from ∼1.6 Ga, 1.33–1.36 Ga, 1.16–1.13 Ga, to 1.09–1.05 Ga, which appear coeval with massive magmatic pulses and convergent tectonism [Corrigan and Hanmer, 1997]. The petrogenesis of these intrusions is highly debated [e.g., Bédard, 2010]. Anorthosites are generally accepted to have fractionated from mafic material ponded beneath the crust [e.g., Emslie, 1985; Ashwal, 1993; Corrigan and Hanmer, 1997; Musacchio and Mooney, 2002], although some geochemical evidence points to a crustal origin [e.g., Duchesne et al., 1999] or even a mixture of crust and upper mantle [e.g., Musacchio and Mooney, 2002, and references therein]. Whether this period of voluminous magmatism was triggered as a result of convec-tive thinning or delamination of the lithosphere which triggered heat influx at the base of the crust, or evolved in a back-arc system in an overall convergent setting, if plate tectonics were active at the time, is uncertain. The breakup of Rodinia led to the formation of the Iapetus Ocean [Kamo et al., 1995] in stages between circa 600 Ma and 550 Ma [Cawood and Nemchin, 2001] and the opening of the Rheic Ocean at circa 480 Ma [e.g., Cocks and Torsvik, 2002]. Two failed rifts from this Paleozoic breakup episode scar the crust of the Grenville Province in our study area: the Ottawa-Bonnechere Graben, which crosscuts the southern portion
Journal of Geophysical Research: Solid Earth
10.1002/2015JB012348
[Mereu et al., 1986], and the St. Lawrence rift system [Kumarapeli and Saull, 1966], which is located on the eastern edge of the Grenville Province (Figure 1).
Gondwana and Baltica collided with Laurentia between 480 and 260 Ma, closing the Iapetus and Rheic Oceans and forming the Pangea supercontinent by the Late Carboniferous. The Appalachian Province (Figure 1) is a remnant of this supercontinent cycle, comprising stacked terranes of Gondwanan/pan-African affinity (Meguma and Avalon terranes), Laurentian margin (Humber Zone), vestiges of the Iapetus and Rheic Oceans (Gander), and accretionary complexes (Dunnage) [van Staal and Barr, 2012, and references therein].
Between 160 and 80 Ma, the North American continent experienced hot spot tectonism [Sleep, 1990a], result-ing in a hot spot track (Figure 1) that crosscuts all the major tectonic boundaries in SE Canada. At the surface, the Great Meteor hot spot track is marked by dykes and kimberlite pipes in the Superior, igneous intrusions in the Grenville, and the Appalachians and volcanic seamounts in the Atlantic. However, the extent to which hot spot tectonism affected the deep crust of these provinces is uncertain.
2.1. Previous Geophysical Studies
The crustal structure of the southeastern Canadian Shield has been imaged by many seismic surveys employ-ing various methodologies: the AG transects of Lithoprobe [e.g., Hammer et al., 2010; Ludden and Hynes, 2000; White et al., 2000; Clowes et al., 1996], the 1988 Canadian Consortium for Crustal Reconnaissance Using Seismic Techniques surveys of the Ottawa-Bonnechere Graben [e.g., Mereu et al., 1986], the 1982 Consortium for Continental Reflection Profiles surveys [e.g., Brown et al., 1983], Great Lakes Multidisciplinary Program on Crustal Evolution surveys [e.g., Green et al., 1988], and the 1988 Grenville-Appalachian refraction experiment [e.g., Hughes and Luetgert, 1991; Musacchio and Mooney, 2002].
In the Archean Superior Craton, the seismic observations are generally interpreted as 10–20 km thick stacked terranes [White et al., 2003; Musacchio, 2004], décollement surfaces, or wedges [Hammer et al., 2010]. A north-ward dipping zone of high reflectivity, penetrating the Moho and extending ∼30 km into the upper mantle, is observed beneath the Abitibi-Opatica boundary and was interpreted to be a fossilized Archean subducted slab [Calvert et al., 1995]. A three-layered crustal structure for the Abitibi was interpreted by Calvert and Ludden [1999] as an allochthonous upper crust above a middle crust of unknown affinity above a highly reflective lower crust, interpreted as the reworked base of an accretionary wedge duplex. In a reinterpreta-tion of the seismic reflecreinterpreta-tion data [Benn, 2006] proposed that the upper and middle crusts are a contiguous autochthonous unit. Modeling of high-precision gravity data of the Superior Craton [Telmat et al., 2000] revealed, from NW to SE, an ∼40 km crust beneath La Grande, thinning in the Nemiscau (∼36 km) and a thick region (∼44 km) beneath Abitibi and Opatica (Figure 1). They also noted a decrease in upper crustal density from the older Nemiscau and La Grande subprovinces to the younger Abitibi and Opatica subprovinces. Lithoprobe seismic profiles image the GF as a gently dipping thrust system, which implies that Archean lower crust extends beneath the Grenville Province for up to ∼250 km [White et al., 2000]. This observation has been used as a rationale for interpreting any significant deep crustal features proximal to the GF as signatures of pre-Grenvillian tectonics. Seismic surveys [White et al., 2000; Winardhi and Mereu, 1997; Martignole and Calvert, 1996] noted a thin crust directly beneath the GF (34–36 km) which thickens to ∼43 km, 60 km to the SE, beneath the Parautochthonous Belt (PB). Crustal compressional wave velocity and Moho sharpness increase from the Superior Craton into the Grenville Province [Winardhi and Mereu, 1997], and subcrustal reflective lam-ination patterns are observed [Mereu, 2000]. Two teleseismic receiver function studies in the southwestern regions of the Grenville Province image a sudden ∼10 km Moho ramp ∼60 km SE of the Grenville Front [Rondenay et al., 2000; Eaton et al., 2006]. An increase in Moho depth and lower crustal P wave velocity was also imaged by Mereu et al. [1986] SE of the GF and beneath the Ottawa-Bonnechere Graben, where the Moho is poorly defined. A seismic profile farther north that parallels the Ottawa-Bonnechere Graben and the hot spot track (Figure 1), but does not cross the GF [Martignole and Calvert, 1996], reveals a thick crust SE of the front (∼44 km) that thins to ∼36 km then thickens again to about 50 km in the proximity of the Morin Anorthosite massif (Figure 1). The crustal thinning interpretation is supported by a collinear gravity model [Telmat et al., 1997]. Seismic studies farther northeast, near the Manicouagan crater, interpreted in conjunction with gravity data, describe an ∼53 km crust beneath the PB which thins to ∼43 km beneath the APT [Eaton et al., 1995; Hynes et al., 2000; Eaton and Hynes, 2000]. This thick crustal sector correlates with a long-wavelength, low Bouguer gravity anomaly that characterizes the northeast portion of the front (Figure 5) [Hynes, 1994] and with low heat flow measurements [Mareschal et al., 2000].
The Grenville to Appalachian transition has been imaged both by passive and active seismic studies. Jordan [1975] and Owens [1987] imaged a lower than average velocity lower crust (shear velocities of 3.4 and 3.6 km/s, respectively) overlain by a higher-velocity midcrust (∼4 km/s) in the southeastern Grenville Province. Taylor et al. [1980] imaged a relatively homogeneous Grenville crust and a well-defined two-layer Appalachian crust, with a 3.6 km/s upper layer overlying a 3.9–4.1 km/s lower crust. Shear wave models obtained via surface wave analyses [Taylor and Toksöz, 1982] revealed an increase in crustal thickness and shear wave velocity between the southern Grenville and Appalachians. On the other hand, refraction seismics [Hughes and Luetgert, 1991; Musacchio and Mooney, 2002; Musacchio et al., 1997] detected a lateral decrease in velocity, crustal thickness, and Poisson’s ratio from the Proterozoic to Phanerozoic. The P wave velocity of the bottom 20 km of the Grenvillian crust increases from 7.00 km/s to 7.24 km/s, while Vp/Vs decreases from 1.84 to
1.81. These gradients imply an increase in S wave velocity from 3.8 to 4 km/s, in contrast to earlier findings [Jordan, 1975]. High P wave velocities in the Grenville lower crust (>6.8 km/s) are also observed in a number of wide-angle seismic surveys across the Atlantic borderlands [Hall et al., 1998]. The lower crust beneath the Humber Zone (composed of Grenvillian basement) exhibits a Vpof 7.2 km/s [Michel et al., 1992]. Marillier and Reid [1990] find a similar (7.0 km/s) lower crustal zone beneath the Gulf of St. Lawrence, in a Carboniferous basin that lies above the ancient Iapetus eastern oceanic margin.
The electrical conductivity structure of the southeastern parts of the Superior, Grenville, and Appalachians has been imaged by a plethora of controlled and passive source electromagnetic studies, described in Boerner et al. [2000] and Adetunji et al. [2014]. These studies are useful for diagnosing the fluid content, iron oxide concentration, metamorphic grade of the rocks, and hence adding extra constraints on the type of tectonic processes that might have affected the crust and the lithosphere. The Archean rocks of the Superior Craton exhibit above average conductivity (∼100 Ω m). Conductive zones appear to crosscut seismic reflectors, sug-gesting that the electrical signature beneath the Superior is controlled by present-day processes [Boerner et al., 2000]. The GF coincides with a change in electrical resistivity, from a conductive Superior crust to the highly resistive PB (up to 50,000 Ω m) [Adetunji et al., 2014].
3. Data and Seismograph Networks
Our data come from broadband seismograph stations located across SE Canada (Figure 1). Earthquakes at epi-central distances>30∘ from the study region, with magnitudes M > 5.5, were recorded mostly between 2010 and 2013 (although some station data from as far back as 2005 are used). A number of different data sources are available in this region, including both permanent (Canadian National Seismograph Network, CNSN, 14 stations and Lamont-Doherty Cooperative Seismograph Network, LD, 2 stations) and temporary (PO: POLARIS [Eaton et al., 2005], 23 stations, and USArray Transportable Array, TA, 20 stations) seismograph networks. In addition, a new seismic network, the X8 QM-III EarthScope FlexArray (Québec-Maine Across Three Sutures), was installed in eastern Canada and the NE U.S. during the summers of 2012 and 2013. This project forms part of the EarthScope FlexArray program and is a collaboration between Rutgers University, Lamont-Doherty Earth Observatory, Université du Québec à Montréal, and Imperial College London. A quasi-linear profile stretches from central Québec to the Maine coast, and a distributed 2-D network is emplaced across the Canadian Maritime region. The eight “backbone” stations of the QM-III network were used in this study.
4. Method
4.1. Receiver Functions and H-𝜿 Stacking
Teleseismic earthquakes (epicentral distance>30∘) radiate seismic waves that propagate throughout the Earth and are recorded at seismograph stations at the surface. Incoming compressional waves (P) interact with discontinuities within the crust and the upper mantle and generate secondary shear waves (S). One of these discontinuities is the crust-mantle boundary, the Moho, where a P wave is converted to an S wave, which then reverberates several times within the crust. The amplitude and timing of these reverberations are determined by the geological structure of the crust: its composition, thickness, and intracrustal discontinuities. In order to capture and enhance these arrivals, the vertical seismogram is traditionally deconvolved from the hori-zontal trace to generate the receiver function (RF) of the crust [e.g., Vinnik, 1977; Burdick and Langston, 1977; Langston, 1979]. Classical deconvolution techniques, however, are numerically unstable and may introduce bias in interpretation or subsequent data manipulation. In this study, we estimate radial receiver functions
Journal of Geophysical Research: Solid Earth
10.1002/2015JB012348
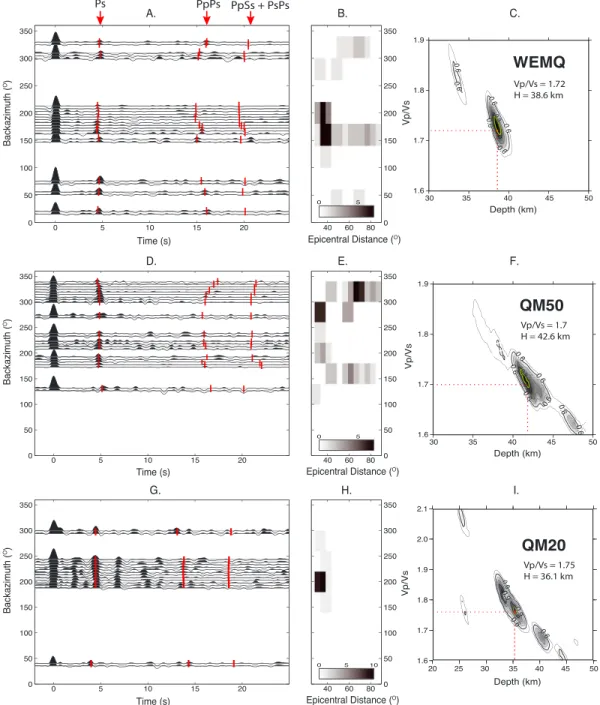
Figure 2. Receiver functions andH-𝜅results for three seismic stations: WEMQ (in the Superior Craton), QM50 (in the Grenville Province), and QM20 (in the Appalachian Province). (a, d, and g) Back azimuthal gathers of radial receiver functions binned in 10∘bins with 5∘overlap, to enhance coherency of arrivals for visual investigation. Red ticks are arrival times calculated using the best fit crustal thickness andVp/Vsratio. (b, e, and h) Back azimuthal-epicentral
distance bins of receiver functions, in which grey shading gives the number of receiver functions for each back azimuthal-epicentral distance combination. (c, f, and i) Phase-weighted stack functions for a range of Moho depths and
Vp/Vsratios, with the 95% confidence interval contours in green.
using an extended multitaper correlation procedure [Helffrich, 2006]. This method involves a division of eigenspectra of the recorded seismograms and has several advantages over traditional schemes: it minimizes spectral leakage, and it preserves phase information and amplitudes at longer time lags.
The first ∼30 s of the radial receiver function is dominated by a Moho P-to-S converted phase and subse-quent crustal reverberations PpPs and PsPs + PpSs (red ticks in Figure 2). The arrival times of the three phases depend nonlinearly on the crustal thickness (H), ray parameter (p or angle of the incoming P wave), and the ratio of compressional to shear wave velocity in the crust (Vp/Vs, which is a function of the Poisson’s ratio𝜅).
Zhu and Kanamori [2000] and Chevrot and van der Hilst [2000] developed a forward search algorithm that provides estimates of H and Vp/Vsbeneath individual seismograph stations, after correcting for variations in p. The amplitudes of all the RFs for individual stations are stacked at the estimated arrival times of the reverbera-tions for a plausible range of H and Vp/Vsvalues. The best estimate of H−Vp/Vssolution pair maximizes the 2-D
stack function (s(H, 𝜅), Figure 2). The Vp/Vsratio can then be translated into the Poisson’s ratio, which depends
on the bulk crustal mineralogy [Christensen, 1996]. H-𝜅 stacking is a widely used method in seismology to estimate crustal properties [e.g., Eaton et al., 2006; Tugume et al., 2012].
We use a phase-weighted stacking approach [Schimmel and Paulssen, 1997] to improve the coherency of stacking. In this method, the linear stack function is weighted by a time-dependent coherency measure c(H, 𝜅) at each time sample (equation (1)), which provides an amplitude-unbiased quantitative measure of the phase similarity or dissimilarity and varies between 0 and 1. This method is widely used in many areas of seismology [e.g., Deuss et al., 2000; Frassetto et al., 2010; Thompson et al., 2010].
c(H, 𝜅) = 1 3N N ∑ j=1 | 3 ∑ k=1 exp(i𝜙j(tk))|, (1)
where N is the number of earthquakes, j is the index of the receiver function, k is the index of the crustal reverberation,𝜙 is the phase of the analytic signal, and tkis the arrival time of the crustal reverberation, which are functions of H and𝜅.
A phase-weighted H-𝜅 stack function is constructed according to equation (2).
s′(H, 𝜅) = c𝜈 N ∑ j=1 3 ∑ k=1 wkrj(tk), (2)
where s′(H, 𝜅) is the phase-weighted H-𝜅 stack function; r
j(tk)is the amplitude of the kth crustal reverberation in the jth receiver function series at the specified times tk, which are functions of H and𝜅; wkis the weight
applied to the amplitude of the kth crustal reverberation; and the𝜈 exponent controls the sharpness of the filter applied to the linear stack and is set to the value of 2 throughout our analysis.
The compressional velocity Vpwas chosen to be 6.5 km/s, based on previous refraction profiles and studies of Precambrian terranes [Musacchio, 2004; Nair et al., 2006; Thompson et al., 2010]. The weights wkare 0.5, 0.3, and −0.2 (to account for the negative polarity of the PpSs + PsPs phase).
As an uncertainty measure, we use the method of Eaton et al. [2006] to compute one standard deviation contours (𝜎s) below the maximum of the phase-weighted stack function s′(H, 𝜅), according to equation (3).
𝜎s= ( 𝜎2 N )1∕2 , (3)
where𝜎 is the standard deviation of all the stacked values and N is the number of stacked receiver functions.
4.2. Probabilistic Inversion
Receiver functions are inverted for 1-D shear wave velocity models using a transdimensional Bayesian approach [Bodin et al., 2012; Sambridge et al., 2013]. Following Bayesian theory, the posterior probability of a model given observed data p(m|dobs) is proportional to the likelihood of observing the data given a particular
model p(dobs|m) multiplied by the a priori probability of the model p(m):
p(m|d) ∝ p(d|m)p(m). (4)
We approximate the posterior distribution with a large ensemble of Vsprofiles (see examples of posterior
distribution of Vsmodels in Figure 3 for a representative station in each of the three tectonic provinces),
ran-domly generated via a reversible jump Markov chain Monte Carlo scheme [Geyer and Møller, 1994; Green, 1995, 2003]. The likelihood function, p(dobs|m) for each model in the ensemble, is derived from the misfit between
the observed and the modeled data and depends on the estimated distribution for data errors.
Noise in the RF is modeled as a stationary multivariate normal distribution function with zero mean and covari-ance Ce(defined in Bodin et al. [2012]), where the noise variance and covariance are user-chosen parameters.
Journal of Geophysical Research: Solid Earth
10.1002/2015JB012348
Figure 3. Bayesian inversion results for stations WEMQ, QM50, and QM20. (a, d, and g) Posterior probability densities of
shear wave velocity distribution with depth. (b, e, and h) Probability of discontinuity functions. (c, f, and i) Observed stacked receiver function (blue line) and the best fit (red dashed line) generated from the meanVsmodel.
In a transdimensional Bayesian formulation, they directly determine the required level of data fit and hence the required complexity in the unknown model (i.e., the number of layers). In this way, the estimated level of errors in the receiver function acts as a damping parameter and the estimated rate of falloff of covariance with lag acts as a smoothing parameter.
The probability density function, p(m), is derived from a priori information, such as the minimum and max-imum shear wave velocity values, between which the model is allowed to vary, or the maxmax-imum allowed number of layers. In this study, the maximum number of layers was set to 10 and the shear velocity was allowed to vary between 2 and 5 km/s.
The inversion was performed on a phase stack of all the receiver functions recorded at a common station, a procedure that generates one trace per station. This might introduce bias in estimating the structure due to moveout and 3-D effects. However, since we are concerned only with crustal depths at which all waves have nearly vertical incidence angle, moveout effects are likely to be negligible. Back azimuthal variability and 3-D effects are always potential issues in 1-D inversions. In the Archean terranes, the assumption of 3-D homo-geneity may be more appropriate, while in younger terranes, dipping interfaces, Moho topography or other more complex structures could exist, affecting the estimated profiles. Additional errors may arise from the assumption that the medium is isotropic and that the Vp/Vsratio is constant while only allowing the number and thickness of layers and their respective shear velocities to vary.
The posterior probability density function, p(m|dobs), can be used to quantify the uncertainties on the Vs
model. Furthermore, the probability of a discontinuity (layer boundary) at each depth (see examples of dis-continuity probability functions in Figure 3) can be estimated from the distribution of discontinuities in the ensemble solution. A complete mathematical description of the inversion procedure can be found in Bodin et al. [2012].
5. Results
We computed receiver functions and obtained reliable H-𝜅 stacking results for 68 seismic stations across eastern Canada. We interpolated the H-𝜅 stacking results to obtain Moho depth and Vp/Vs ratio maps of eastern Canada. (Figure 5). Also, we estimated the shear velocity structure using transdimensional Bayesian inversion, beneath 15 seismic stations, on or close to the QM-III transect (2-D profile in Figure 5). We use this quasi-2-D crustal model to investigate differences in crustal structure properties from Archean to Proterozoic to Phanerozoic terranes in a region that is far enough from the Great Meteor hot spot not to have been significantly modified by plume-plate interaction. Figure 3 shows three shear wave velocity profiles and the associated probability of discontinuity for a representative station from each of the three main tectonic provinces.
5.1. The Superior Craton
Receiver functions from 12 seismograph stations in the eastern Superior Craton are dominated by coherent, high signal-to-noise ratio arrivals (Figure 2), where the Moho Ps converted phase and its multiples can easily be identified. Moho depths obtained via the H-𝜅 stacking method range between 34 and 38 km, with an average of 36 ± 1.41 km, while Vp/Vsratios vary between 1.70 and 1.78 with a mean value of 1.73±0.02. These means exclude one anomalous station, KAPO, located in the intracratonic Kapuskasing thrust zone (Figure 1), where a crustal thickness of ∼47 km is measured. The anomalously thick crust at this location is consistent with seismic refraction surveys [e.g., Boland and Ellis, 1989].
Bayesian inversions were compared for six neighboring stations (two QM-III and four POLARIS/CNSN; Figure 3). The probabilistic velocity-depth profiles for most of the Superior stations show a relatively consistent low-velocity upper crust (∼2.5 km/s) underlain by an ∼3.3 km/s, ∼12 km thick, midcrustal zone. Also, an ∼3.6 km/s lower crust of 15–18 km thickness overlies ∼4.4 km/s uppermost mantle (Figure 5). Posterior prob-ability distributions on discontinuities indicate a high probprob-ability of discontinuity at about 10 km beneath all stations in the Superior and most prominently beneath station QM90 (Figure 5). Station WEMQ lies within the La Grande granite-greenstone subprovince and is underlain by a roughly four-layered crust and a seismically sharp Moho, while station QM90, also located within La Grande, does not exhibit the fourth lower crustal layer (Figure 5). In the context of our results, we define a sharp Moho as a shear velocity change from typical lower crustal values (3.6–3.8 km/s) to typical upper mantle values (>4.3 km/s) over a depth range of <2 km. The sharp Moho also shows a narrow, high-amplitude peak in the probability of discontinuity function.
Journal of Geophysical Research: Solid Earth
10.1002/2015JB012348
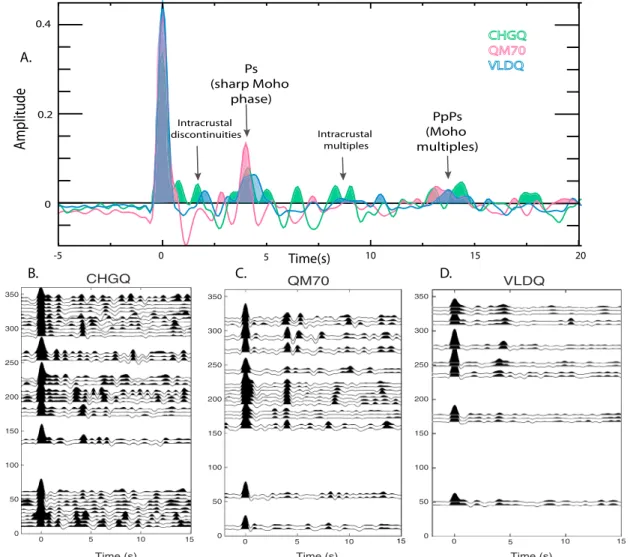
Figure 4. Receiver functions for stations CHGQ, QM70, and VLDQ (all located within the Archean granite-greenstone Abitibi subprovince). (a) stacked receiver
functions for each station. (b–d) Back azimuthal gathers of composite receiver functions binned in 10∘bins with 5∘overlap.
Receiver functions computed for stations located within the Abitibi subprovince appear to indicate very differ-ent crustal structures. Figure 4 shows the receiver functions computed for three stations within Abitibi: CHGQ, QM70, and VLDQ. Station CHGQ lies just NW of the Grenville Front, on the Archean Superior side. QM70 lies just 30 km NW of CHGQ, and VLDQ lies 300 km SW of CHGQ. All three stations are located in areas with similar surface geology, dominated by ultramafic volcanic rocks. However, it is evident from the receiver function series that the crustal structure beneath station CHGQ is more complicated than the other two. The receiver functions show multiple arrivals before and after the Ps phase, which could be an effect of the densely stacked intracrustal thrust sheets. The Vsprofile of station CHGQ (Figure 5) shows a seismically faster (3.7 km/s) lower crust in a depth range between 25 and 38 km, with little evidence for discontinuities. The upper crust (<20 km depth) seems to have a multilayered fabric, with 3–7 km thick layers. H-𝜅 stacking was unsuccessful on CHGQ due to this structural complexity. On the other hand, receiver functions for station QM70 (Figure 4) show excel-lent back azimuthal coherency and a sharp Ps phase, with no evidence of strong intracrustal multiples. Station VLDQ exhibits a much simpler structure: its receiver functions lack the ringing effect that dominates the data from CHGQ, and its Vsprofile is strikingly similar to that of WEMQ (Figure 3).
5.2. The Grenville Province
In the Grenville Province, receiver functions generally show more complexity, with less back azimuthal coherency of the Ps and multiple phases than the Superior Province (Figure 2). H-𝜅 results from 46 stations show a 35–45 km range of crustal thicknesses (mean of 40 ± 2.54 km) and a 1.70–1.88 range of Vp/Vsratios
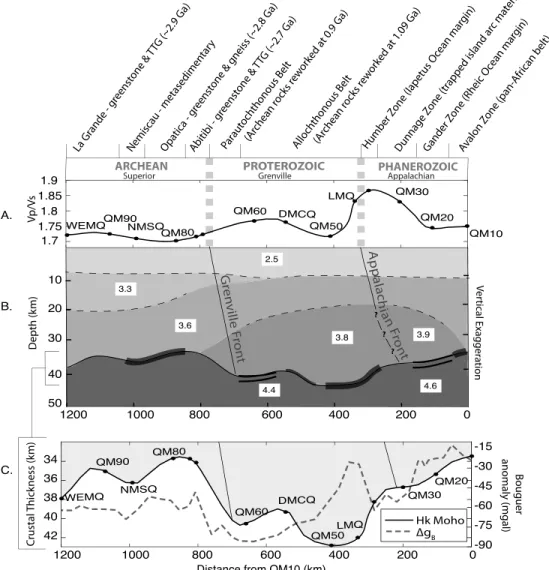
Figure 5. (a) Bayesian shear wave velocity structure (colors) overlain with probability of discontinuity functions (black
lines), Moho depth obtained viaH-𝜅stacking (dashed line), surface expression of the main tectonic boundaries (arrows), and probable location at a Moho depth of 40 km given a dip angle of 14∘(crosses). (b) Bouguer gravity map (colors) overlain with tectonic boundaries (red lines), subprovince boundaries (solid white lines), Neoproterozoic failed rifts (Ottawa-Bonnechere Graben and Saint Lawrence Valley, dashed white lines), seismic stations for which a probabilistic inversion has been computed (red stars), and hot spot-related surface features (white diamonds) including kimberlite pipes in the Superior Craton and igneous intrusions in Grenville and Appalachian provinces. (c) Crustal thickness (colors) overlain with boundaries as in Figure 5b. (d)Vp/Vsratio distribution map (colors).
the Grenville Province: Superior station QM70, ∼50 km NW of the Grenville Front, is underlain by a 34 km thick crust, while at QM60, ∼80 km SE of the front, we estimate a 41 km Moho depth (Figure 5).
Generally, the Vsprobability density functions obtained from the inversion of seven Grenville stations (QM60,
DMCQ, QM50, LMQ, A61, A64, and G53A) consistently show an ∼2.5 km/s, 10 km thick upper crust, overlying an ∼3.6 km/s midcrustal layer roughly between 10 and 20 km depth and a higher-velocity (∼3.8 km/s) ∼20 km thick lower crust (Figure 5). The Moho depth obtained from Bayesian inversion beneath station QM60 has the signature of a double discontinuity. The two probability spikes at 39 and 43 km depth might indicate the top and bottom of a 4 km subcrustal layer of velocities comparable to the upper mantle (4.2–4.5 km/s).
Journal of Geophysical Research: Solid Earth
10.1002/2015JB012348
The Moho is more gradational in the middle of the province. It is relatively sharp beneath station DMCQ (Vstransition from crustal to mantle velocities occurs over a range of ∼3 km) but is gradational beneath QM50 (the Vstransition occurs over ∼10 km and with a low probability of discontinuity: Figure 5). These stations
are located within or nearby the voluminous Lac Saint-Jean anorthosite massif (Figure 1). The Moho sharpens beneath stations A61, A64, and LMQ, located on the Proterozoic side of the St. Lawrence Valley, both in the sense that the transition from crustal Vsto mantle Vsoccurs over a smaller depth interval (1–2 km) and the
discontinuity probability has a higher and narrower peak. The Moho depth estimates of the Bayesian and H-𝜅 methods are slightly offset (2–5 km difference). Both methods, however, make assumptions about the medium that might introduce discrepancies: the H-𝜅 stacking technique is dependent on an assumed average crustal P wave velocity; the probabilistic inversion assumes the Vp/Vsratio to be fixed and the medium to be isotropic.
5.3. The Appalachian Province
Seismic recordings from the Appalachian Province are noisy and exhibit a ringing pattern that may be due to sharp intracrustal discontinuities or to oceanic noise; both reduce the reliability of the H-𝜅 stacking results. However, 10 stations clearly detect the Moho, with H in the 32–42 km depth range (mean H = 37.0 ± 3.8 km) and Vp/Vs values in the 1.71–1.87 range (mean of 1.75 ± 0.05). High Vp/Vs ratios are found across the
St. Lawrence rift system (also coincident with the Grenville-Appalachian tectonic boundary): stations A64 on the Grenville side and A21 on the Appalachian side show Vp/Vsratios of 1.78 and 1.82, respectively.
Bayesian inversion computed for stations QM20 and QM30, within the Dunnage and Gander terranes, respec-tively, reveals a three-layered crustal structure: an ∼10 km, 2.5 km/s upper crust; an ∼10 km, 3.6 km/s midcrust; and an ∼15 km 3.9 km/s lower crust. The upper mantle is relatively faster (∼4.6 km/s) than the adjacent Grenville (Figure 5). The probability of discontinuity function peaks at ∼20 km depth. This intracrustal discon-tinuity might be the source of strong, back azimuthally coherent energy observed on the receiver functions that arrives between the P and the Ps phases (for example, station QM20 in Figure 2). The Moho character beneath these stations also exhibits a double-spike probability of discontinuity.
In contrast to the adjacent Iapetus and Rheic Ocean related terranes, the Avalon Zone, sampled by sta-tion QM10, appears relatively homogeneous, with the excepsta-tion of a high probability of an interface at ∼10 km depth, dividing a 3 km/s upper crust from a middle-to-lower crust with velocities that progressively increase from 3.6 km/s to mantle-like speeds of 4.5 km/s, with a very gradational crust-mantle transition (Figures 5 and 8).
6. Discussion
6.1. Comparison With Previous Studies
In the Superior Craton, Moho depth increases from 34 to 36 km beneath Nemiscau, Opatica, and La Grande subprovinces and to ∼40 km in the southwestern Abitibi greenstone province (Figure 5). These observations are consistent with the structural interpretation of a Lithoprobe line crossing the Abitibi-Opatica border, located farther southwest [Calvert et al., 1995] and the collinear gravity modeling study of Telmat et al. [2000]. Most of our crustal Vp/Vsand Moho depth estimates agree with the H-𝜅 stacking results of Postlethwaite et al.
[2014], to within 0.3 and 3 km, respectively. However, we identify a lower Vp/Vsratio beneath stations VLDQ and KAPO and higher beneath station MALO.
Sixty kilometers SE of the GF, Moho depth increases to 41–44 km (Figure 5), consistent with wide-angle Lithoprobe surveys [e.g., White et al., 2000; Winardhi and Mereu, 1997; Martignole and Calvert, 1996]. Two receiver function profiles also image a sudden ∼10 km Moho depression ∼50 km SE of the Grenville Front [Rondenay et al., 2000; Eaton et al., 2006]. Increased thickness beneath the sections of the failed Iapetan Ottawa-Bonnechere Graben is also noted in a previous seismic survey that crosscuts the graben [Green et al., 1988]. A gradational Moho beneath the Grenville Province, near the St. Lawrence Rift System, was also detected in an ambient noise crustal model [Kao et al., 2013], in which the thickness of the crust-mantle transi-tion is prescribed by the difference in depth where the Vsincreases to 50% and 85% of typical crust to mantle
velocity. H-𝜅 results from Postlethwaite et al. [2014] also agree with our estimates, except for stations PKRO, NATG, ICQ, A21, and A64, where our estimated Vp/Vsratios differ by as much as 0.13.
In the Appalachians, an average crustal thickness of 40 km determined from seismic refraction in the Avalon Zone in Newfoundland [Marillier et al., 1994] is greater than that estimated in this study for the Avalonian crust beneath station QM10 (33 km). The average crustal thickness of Phanerozoic terranes (37 ± 3.8 km)
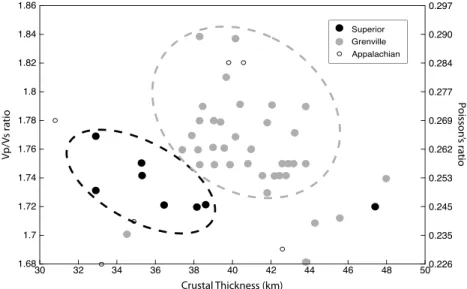
Figure 6.H-𝜅stacking results from broadband seismic stations across SE Canada. Stations are categorized on the basis of surface geology as Superior (black circles), Grenville (grey circles), and Appalachian (open circles). Most of the Superior data (dashed black ellipse) lie in a different part of theH-𝜅plane than do the Grenville and Appalachian data (dashed grey ellipse).
found in this study is slightly lower than the results of Taylor et al. [1980], although different regions exhibit strong Moho depth differences, from 32 to 42 km. Moho depth has also been reported to increase from 36 km beneath Maine to 40 km beneath Vermont in the northern U.S. [Hughes and Luetgert, 1991]. Along the QM-III transect, we observe a general trend of crustal thinning toward the Atlantic. Eastern crustal thinning beneath the Appalachians has also been noted before [e.g., Nelson, 1992; Musacchio et al., 1997], although Hall et al. [1998] pointed out that the crust beneath the mobile Appalachian belts (30–37 km) is thinner than at its margins (Newfoundland part of Avalon, up to 40 km). Other Vs models, based on P and S traveltimes and
Rayleigh wave group and phase velocity inversions [Taylor et al., 1980; Taylor and Toksöz, 1982], suggest a thicker crust beneath the Appalachians (∼40 km) than the Grenville (∼37 km). The average Vp/Vsobtained for
the Appalachian Province from H-𝜅 stacking, 1.75 ± 0.05, is similar to the global average (1.768) [Christensen, 1996] but is slightly higher than the value of 1.73 reported by Musacchio et al. [1997] based on refraction seismics in the southern Appalachian region (Vermont and Maine). The shear velocity structure has some similarities with the Appalachian crustal model of Taylor and Toksöz [1982], who also noted an increase in shear wave velocity between the southern Grenville and the Appalachians. In an ambient noise crustal model, Kao et al. [2013] detected a sharp discontinuity at ∼20 km, similar to the one in our profile (Figure 5).
6.2. Secular Variation of Present Crustal Structure
Bulk crustal properties presented in Figure 6 correlate with tectonic province age in the Precambrian (defined as the time elapsed since the last tectonothermal event). The average H-𝜅 results obtained for stations located within the Proterozoic Grenville terranes (41 ± 2.54 km and 1.76 ± 0.03, respectively) are higher than the values obtained for the Archean Superior Craton (36±1.41 km and 1.73±0.02) and slightly higher than the Phanerozoic Appalachians (37±3.8 km and 1.75±0.05). Laboratory experiments of shear and compressional wave velocities on rocks of different compositions [e.g., Christensen, 1996] suggest that increasing Poisson’s ratios reflect a decreasing content in SiO2, since the Poisson ratio of quartz is much lower than that of other major crustal minerals including feldspar and pyroxene. In view of these experiments, our bulk crustal results suggest that Archean crust is on average thinner and more felsic than either Proterozoic or Phanerozoic crust. Elevated Vp/Vsratios could reflect higher-grade metamorphic rocks, like amphibolitic rocks and high-grade
metapelites [e.g., Musacchio and Mooney, 2002, and references therein]. Metapelite undergoes partial melting at high metamorphic grade. This interpretation might be relevant if the melt was lost leaving the restite (nonmelted material). Moreover, there are age-correlated differences in the seismic structure obtained through Bayesian inversion. While Archean crust displays a three-layered to four-layered structure with shear velocity ranging from 2 to 3.6 km/s, Proterozoic terranes show a higher degree of lateral crustal hetero-geneity, and a higher shear velocity, 20 km thick lower crust (3.8–4 km/s). Sub-Moho shear velocity is in the 4.4–4.7 km/s range beneath this region (Figure 5).
Journal of Geophysical Research: Solid Earth
10.1002/2015JB012348
Patterns of secular variation of thin and predominantly felsic Archean versus thick and more mafic Proterozoic crust have been noted before by Durrheim and Mooney [1991], based on global compilations of seismic refraction data. According to their hypothesis, hotter Archean lithosphere led to pervasive komatiitic magma eruption, which left an ultradepleted buoyant lithosphere beneath a relatively thin crust (∼35 km). In contrast, more fertile mantle beneath the nascent Proterozoic crust subsequently partially melted, causing mafic underplating that increased the thickness of the crust to ∼40 km and added mafic minerals to it. Our results are generally consistent with this hypothesis. However, some global studies of Precambrian regions [Rudnick and Fountain, 1995; Zandt and Ammon, 1995] and teleseismic analysis in South African cratons [Tugume et al., 2012, 2013] and the Arabian Shield [Al-Damegh et al., 2005] argue against the Durrheim and Mooney [1991] theory, finding no significant differences in the crustal structure between Archean and Proterozoic crust. On the other hand, tectonic age correlation has been observed in the Rae and Hearne Cratons in Northern Canada [Thompson et al., 2010], the Sao Francisco Craton in Brazil [Assumpçao et al., 2002], the Dharwar Craton in India [Ravi Kumar et al., 2001], and the Yilgarn Craton and adjacent Proterozoic belts in Australia [Clitheroe et al., 2000]. The resolution of this issue may hinge on the distinction between the age of the crust and the age of the orogenic event. Furthermore, the issue is obfuscated by the likelihood that por-tions of Proterozoic crust, in northeastern North America as well as elsewhere, are underlain by Archean crust at depth.
Minor correlations between geological age and bulk crustal properties occur within the Superior Craton, along the QM-III network. Moho depth increases from 34 to 36 km beneath Nemiscau, Opatica, and La Grande sub-provinces and to ∼40 km in the southwestern Abitibi greenstone province (Figure 5), which is 100–200 Ma younger than the provinces to the N-NW. The lack of large-scale Archean Moho topography may imply a paleolithosphere too weak to support any localized thickened crustal roots at the time, if any had been generated. Nevertheless, the correlation of crustal thickness with the progressive south-to-north aging could imply a decrease in crustal growth efficiency with geologic age. Uniformitarian models of continental growth consider the Superior Craton to have been assembled via progressive accretions onto its edges [e.g., Hammer et al., 2010, and references therein]. However, many geophysical and geochemical data are inconsistent with subduction or arc accretion models and support plume or rift models [e.g., Bédard, 2006]. Bédard and Harris [2014] suggested a stagnant lid model, with continental drift but no subduction in the Archean. If these models are correct, the differences in Moho depth we observe in Figure 5 may reflect a sudden change in the mode of crustal formation toward the end of the Archean, as contrasted to a slow change in efficiency.
6.3. Precambrian Crustal Properties: Original or Reset Signatures?
The assertion that bulk crustal properties are unequivocal evidence for a change in tectonic processes over time may be too simplistic. Seismic signatures of the original crustal growth mechanism may have been reset by subsequent tectonism, such as mantle plume-plate interaction, rift-related magmatism, delamination of overthickened orogenic crustal roots, or crustal convective overturns. For example, models for Archean verti-cal crustal growth predict diapiric crustal overturns by the migration of the low-density felsic basement on top of the ultramafic volcanics initially at the surface, creating the so-called “dome-and-keel” structure [e.g., Robin and Bailey, 2009], observed in the Abitibi greenstone belt. The current crustal structure may thus represent an end product of such processes that might have obscured the signature of original formation mechanisms. Also, multiple dyke swarms of different ages pervade the Superior Craton. Dyke complexes record magmatic pulses at 2.5, 2.2, and 2.1 Ga that are linked with many episodes of extension at the paleocratonic margins of Laurentia [Ernst and Bleeker, 2010]. However, no indication of recent tectonism has been detected within the subprovinces La Grande, Nemiscau, and the metaplutonic Opatica. For example, Clowes et al. [1998] postulate that the lower crust of the Opatica has been preserved since its juxtaposition with Abitibi ∼2.7 Ga ago. The contemporary Moho beneath these regions (stations WEMQ, QM90, NMSQ, QM80, and QM70) may be the original undisturbed Archean Moho and therefore a product of Archean tectonics.
The receiver functions and crustal structure at station VLDQ in the Abitibi subprovince are very similar to those at station WEMQ in the La Grande subprovince (Figure 3). Both Abitibi and La Grande are typical granite-greenstone subprovinces and may have been formed in similar tectonic settings. Bédard and Harris [2014] suggested that Superior subprovinces are not exotic but once belonged to the same continent that broke into smaller “continental ribbons,” subsequently reaccreted to the Superior protocraton. The obser-vation of similar crustal structure between parts of Abitibi and La Grande may be evidence that these subprovinces once belonged to the same supercraton.
Crustal structure within the granite-greenstone Abitibi subprovince is highly variable. The striking change in character of the receiver functions between CHGQ and QM70 (Figure 4) occurs over a distance of<30 km. The seismic structure beneath CHGQ is also significantly different from station VLDQ, located 300 km SW, also within Abitibi. A vertically heterogeneous, 20 km thick upper crust, with many internal interfaces, overlies a fast homogeneous lower crust beneath CHGQ. It could represent stacked volcanic sequences, erupted on top of a now buried homogeneous Archean basement. The CHGQ structure might be evidence for intense magmatic activity at the cratonic margin, which is the locus for several attempted rifting episodes [Ernst and Bleeker, 2010] and preexisting zones of weakness, reactivated during multiple Wilson cycles [e.g., Martignole and Calvert, 1996].
The Moho beneath stations in the metasedimentary Nemiscau and metaplutonic Opatica domains is a grada-tional boundary, in contrast to the sharp Moho of the Abitibi and Opatica domains. Low impedance contrast at the base of the crust could be caused by magmatic underplating or lower crustal metamorphic reactions, arising from crustal formation and/or modification. Both plate boundary processes [e.g., Calvert et al., 1995] and plume activity [e.g., Benn and Moyen, 2008] could give rise to a gradational crust-mantle transition. Some intracratonic regions may have experienced modification, providing unreliable links with early Archean mechanisms. The Kapuskasing Structural Zone, a 1.9 Ga intracratonic uplift region in southwestern Abitibi (Figure 1), is underlain by exceptionally thick crust (47 km at station KAPO—not shown on crustal thickness map), compared to the surrounding Archean terranes. This estimate is consistent with results from wide-angle seismics (45–59 km) [Boland and Ellis, 1989] and inferences based on metamorphic grade [Percival and West, 1994]. Studies performed on the deep crust exposed in the Kapuskasing uplift zone indicate a lower crust that was subject to complex deformation and recrystallization during 2.7–2.4 Ga [Percival et al., 1994]. Lower crustal xenoliths exposed in kimberlite pipes in Abitibi indicate zircon overgrowths during a 2.5 Ga period of widespread extensional magmatism associated with the Matachewan ocean opening [Moser and Heaman, 1997], but no evidence of lower crustal modification is found due to subsequent tectonic events such as the 1.1 Ga midcontinental rift. This local increase in crustal thickness within the Archean could be supported by a lithosphere that had already been stabilized, acquiring sufficient strength by 1.9 Ga to withstand tectonic modification.
The North American continent also drifted over the Great Meteor hot spot 160–90 Ma. The track appears to follow the strike of the Ottawa-Bonnechere Graben, a failed rift associated with the opening of the Iapetus Ocean. The crust is up to 44 km thick beneath the graben, and Vp/Vsexceeds the high value of 1.8 (green to black color scale in Figure 5), indicating a high mafic content. Receiver functions at stations near the graben are complex, possibly due to reverberations within a thick sedimentary layer or from multiple Ps arrivals from a complex Moho. The high Vp/Vsvalues and complex Moho are consistent with the injection of mafic material
at the base of the crust during lithosphere-hot spot interaction. Weakened lithosphere associated with the failed Iapetan rift may have provided a path for hot spot magmatism in this region. Tomographic studies of the eastern Canadian lithosphere [e.g., Frederiksen et al., 2007; Villemaire et al., 2012] image a low-velocity corridor in the upper mantle that correlates spatially with the Great Meteor hot spot track at the surface, also consis-tent with the injection of hot spot magmatic material into the lithosphere. The crustal thickness variations observed in this region may represent a reset tectonic signature rather than an original crustal feature. The Grenville Province is also a site of complex tectonic history. Current interpretations [Rivers, 2012] suggest that the Grenville Orogen underwent orogenic collapse, and possibly also delamination of part of the under-lying continental lithosphere, after attaining peak crustal thickness. Our measurements most probably relate to the thinned crust that remained after those processes had taken place.
6.4. Moho Topography at the Cratonic Margin—Relict Archean Subduction?
Moho depth increases to 41–44 km, 60 km SE of the GF (Figure 5). Lithoprobe seismic profiles image the GF as a low dip thrust system, implying that Archean basement extends beneath the Grenville Province for up to ∼250 km [White et al., 2000] and that structures beneath the GF would be Archean.
The significant and sudden Moho depth increase SE away from the GF was interpreted by Rondenay et al. [2000] as a relict continental-type subduction zone of Archean age. This frozen-in feature was assumed to have provided a preexisting lithospheric-scale zone of weakness, reactivated during the GO. Our data (Figure 5) show that the increase in Moho depth is not systematic along the full extent of the Grenville Province: in the southwest, in the region crossed by the Ottawa-Bonnechere Graben and the Great Meteor hot spot track,
Journal of Geophysical Research: Solid Earth
10.1002/2015JB012348
crustal thickness increases from 34 to 44 km. Farther northeast, along the QM-III transect, it only increases to 41 km. The Bouguer gravity anomaly does not appear to have a consistent subduction-like signature along the PB (Figure 5). Rondenay et al. [2000] also point out that there is an absence of foreland arc magmatism along the full extent of the PB, although active magmatism does not occur along the full length of the modern Andes either. The lack of continuity of along-strike Moho character, foreland arc magmatism, and subduction-like gravity signatures points to a nonplate tectonic origin for this feature. Locally, the crust could have thickened, and its Vp/Vs ratio raised, by the accumulation of magmatic material associated with the Great Meteor hot
spot at the cratonic edge.
6.5. Fossil Mountain Roots and Isostatic Mantle Support
Neither the Bouguer gravity anomaly nor the surface elevation correlates with the Moho topography along the Parautochthonous Belt (Figure 5). Thick crust (∼44 km) in the SW PB (∼47∘W, 79∘N) coincides with a neg-ative Bouguer anomaly of about −60 mGal and Vp/Vsbetween 1.71 and 1.73. The thinner (41 km) and more mafic (Vp∕Vs∼1.76) crust beneath the QM70-QM60-DMCQ section of the QM-III transect coincides with the
more negative Bouguer anomaly of −84 mGal, whereas isostasy would predict a more positive anomaly (Figure 8).
Metamorphic reactions that cause the crustal root to lose buoyancy have been proposed to explain the contrast between low surface elevation (≤350 m height) and thick crust [e.g., Fischer, 2002]. Partial eclogi-tization has been invoked as a mechanism of preserving the mountain root of the Ural Mountains and the Trans-Hudson Orogen, arresting orogenic collapse [Leech, 2001]. This process requires a fluid-deficient regime to prevent the full eclogitization and delamination of the lower crust. Eclogites are seismically indistinguish-able from upper mantle material [Manghnani et al., 1974] and can decrease the sharpness of the seismological Moho [Leech, 2001]. Our seismic models, however, show a relatively sharp Moho beneath station DMCQ and a double Moho beneath station QM60 (both located in the Grenville Province, Figure 8), which argues against the role of eclogitization in this part of the orogen.
The crust beneath QM60 has a higher-velocity (3.8–4.0 km/s) lower crust than adjacent Archean terranes. To the SW of the QM-III transect, the Vsand Vpof the lower crust derived from refraction seismics [Winardhi and Mereu, 1997] are in the range of 3.75–4.0 km/s and 6.8–7.2 km/s, respectively. SE of the GF White et al. [2000] found a slightly higher P wave velocity lower crust (6.9–7.4 km/s) between 30 and 44 km. Lower crustal Vpvelocities beneath orogens putatively affected by delamination are typically in the range of 6.2–6.4 km/s
[e.g., Ruppert et al., 1998]. This dissimilarity might indicate that this part of the Proterozoic lithosphere did not experience delamination. However, evidence for postthickening extensional collapse in some segments of the Grenville Province [Martignole and Calvert, 1996] has been used to argue that the interior portion of the Grenville Province was part of a large, hot, and long-lived high plateau, like modern Tibet, which progressively collapsed, before the second orogenic pulse in which the orogen advanced into its former foreland [Rivers, 2009]. Heat flow values are low on average, ranging between 25 and 40 mW/m2[Lévy et al., 2010; Jaupart et al.,
2014]. In the partial eclogitization model of Leech [2001], low heat flow values and nondelaminated crust are characteristics of arrested orogens with partially eclogitized roots.
In the southwest section of the GF, subcrustal reflectivity patterns from a reflection seismic profile [Mereu, 2000] have been associated with eclogitized lower crust that preserves lamination patterns beneath the Moho [Eaton, 2006]. The existence of a partially eclogitized layer would decrease the magnitude of the gravity anomaly, since mafic material is dense. A 35 km thick crust of average density 2800 kg/m3with a 5–10 km
thick basal layer of density 3100 kg/m3above 3300 kg/m3mantle would yield a Bouguer anomaly of −49 to
−55 mGal: 30–35 mGal higher than the observed beneath the QM-III transect (−85 mGal), in the PB and parts of the APT (Figure 5).
Overall, the crustal seismic structure beneath the Grenville along this section of the QM-III transect, sharp to double Moho, high-velocity thick lower crust (∼20 km) correlated with a region of highly negative Bouguer gravity anomaly, is not consistent with an eclogitic lower crust, implying that mantle structure is the pri-mary buoyant support for isostatically imbalanced crustal roots. The extent and age of cratonic lithosphere beneath the Grenville Province is not yet established, although some studies point toward an Archean sub-continental mantle beneath parts of the Grenville crust, particularly in the northwest. Tomographic models of North America [e.g., Schaeffer and Lebedev, 2014; Bedle and van der Lee, 2009] image a fast cratonic root up to the Grenville-Appalachian boundary, implying that the lithosphere beneath parts of the Grenville is likely
of Precambrian age. A strong cratonic subcontinental mantle is a better candidate for support of crustal roots beneath the Proterozoic domains.
6.6. Precambrian Gravitational Collapse
Geological evidence points to a complex tectonic history of collision and orogenic collapse within the Grenville Province. Rivers [2008, 2009] proposed that part of the GP was a high-elevation long-duration oro-genic plateau, similar to modern Tibet. The collapse model represents the final stages of a cyclic orooro-genic process in which lithospheric delamination triggers an abrupt increase in topography and hence gravita-tional potential. This uplift is followed by thermal weakening of the middle and lower crustal segments and subsequent plateau collapse by outward radial flow over a timescale of tens of million years. In the collapse model of Rivers [2012] the final rheological structure of the collapsed orogen comprises an uppermost crust that escaped the effects of metamorphism, with radially distributed normal-sense shear zones, an upper crustal region with subvertical structures, and a decoupled weak middle-lower crust that experienced sub-horizontal extension in a channel flow regime. Moreover, orogenic collapse results in juxtaposition of dry (granulite facies) middle to lower crust with hydrous (amphibolite facies and locally greenschist facies) upper crust [Rivers, 2012]. These processes could leave a distinct seismic signature in the impedance structure of the midcrust.
Our inferred shear velocity structures beneath stations across the Grenville Province (Figure 5) are consistent with this layered structure (10 km uppermost crust, 5–10 km upper crust, and high-speed 20 km middle-lower crust). The probability of discontinuity is high at 10 and 20 km depths, perhaps representing the petrologi-cal and rheologipetrologi-cal decoupling between the low-grade metamorphic uppermost, hydrous amphibolite facies upper, and potentially dry granulitic middle-lower crust. Channel flow of middle-lower crust may have a smoothing effect on the crust-mantle boundary, increasing its seismic sharpness. Shear velocity structures within the Grenville Province (Figures 5 and 7) indicate strong impedance contrasts at 20 and 40 km depths, with relatively high probability of discontinuity at the Moho (except for stations located within anorthosite massif areas), suggesting sharp interfaces that could be interpreted as the sheared top and bottom of an extensional middle-lower crustal channel. Midcrustal channels are bounded by thrust-sense lower bound-aries and normal-sense upper boundbound-aries, although the smoothing effect may be overprinted by extensional faults. Previous magnetotelluric studies in the southwestern Grenville Province [Adetunji et al., 2014] observed an increase in conductivity in the lower crust beneath an area considered part of the orogenic lid [Rivers, 2012]. Seismic profiles collinear with the MT studies [White et al., 2000] indicate the presence of southeast dipping features rooting into a lower crustal décollement, supporting the lower crustal channel flow hypothesis.
6.7. Phanerozoic Structure: The Role of Wilson Cycles
We also note variations in crustal thickness along the Appalachian orogenic strike as well as toward the Atlantic borderlands. On the basis of seismic studies, the Moho beneath the orogenic core has been pro-posed to be shallower than that of the margins of the Appalachian Province [van Staal and Barr, 2012, and references therein]. Our data, however, do not show such a trend, although Moho depths exhibit local varia-tions on the order of ∼8 km. The velocity model and discontinuity structure described in section 5.3 indicate a strong discontinuity at 20 km depth and a double-discontinuity Moho character (hereafter referred to as a double Moho) within Dunnage and Gander, domains related to the Iapetus and Rheic Oceans. The strong difference in seismic structure between adjacent Phanerozoic domains is consistent with the diverse nature of the tectonic domains that assembled the Appalachian Province.
Nelson [1992] argued that the crust of the Appalachian Province was thin prior to the onset of Atlantic Ocean opening and that lithospheric-scale delamination was responsible for the thinning of the central orogen. Other models envisaged lower crustal eclogitization of the mafic material and large-scale partial melting with a restite layer posing as upper mantle material, rather than lithospheric reworking [van der Velden et al., 2004; Cook et al., 2010]. However, this process would decrease the impedance contrast between the lower crust and upper mantle. In contrast, the double Moho character and high Vp/Vsratios (Figure 5) indicate a predominantly
mafic crust underlain by a layer with sharp top and bottom interfaces. This geophysical signature could be associated with structural emplacement of oceanic rocks beneath older continental crust [Cook et al., 2010]. The Appalachians record events from the closure of two oceanic tracts, the collision with Avalonia and Africa and the opening of the Atlantic Ocean on the same general axial trend. These important tectonic events likely had an impact on the internal architecture of this now eroded orogenic province.
Journal of Geophysical Research: Solid Earth
10.1002/2015JB012348
Figure 7. Probability of discontinuity functions for stations across the (a) Archean Superior, (b) Proterozoic Grenville, and
(c) Phanerozoic Appalachian provinces. Grey shaded area represents the mean probability of discontinuity function for each province.
6.8. Mafic Underplating, Anorthosites, and Their Implications for Crustal Growth
The principal issues surfacing in petrological and geochemical discussions of the origin of AMCG (anorthosite-mangerite-charnockite-granite) complexes involve the amount of crustal material in the fractionating mafic magmas that give rise to the anorthosite [Duchesne et al., 1999]. Two schools favor different amounts of crustal involvement based on geochemical and isotopic constraints and the time taken for fractionation and emplacement [Emslie, 1985; Ashwal, 1993; Bédard, 2010; Bybee et al., 2014]. The generation mechanism of AMCG complexes is still debated. Early theories of generation for such widespread geochemically unique magmatism focused on anorogenic sources, such as rifting, mantle plumes [Morse et al., 1988], and thermally insulated mantle superswells [e.g., Hoffman, 1989; Vigneresse, 2005]. Later work invoked plate tectonic pro-cesses such as lithospheric delamination [e.g., Corrigan and Hanmer, 1997] and crustal imbrication [Duchesne et al., 1999]. Durrheim and Mooney [1991] suggested that massive partial melts, derived from a Proterozoic mantle that was more fertile and cooler than the hot Archean mantle, ponded beneath the lower crust, pro-viding the mantle source for Proterozoic anorthosites. Mafic underplating would result in a gradational Moho and a high-velocity lower crust, consistent with the Moho character estimated beneath station QM50. Bybee et al. [2014] suggested that the emplacement of the anorthosite components of AMCG complexes at mid-crustal levels may have occurred ∼100 Ma after fractionation at the base of the crust and have associated this event with Andean-style tectonics, which dominated the Laurentian margin for a period of ∼500 Ma, from 1.71 to 1.23 Ga [Rivers, 1997]. However, AMCG complexes younger than this age are known in the GP (see section 2) and the global distribution and restriction to the Proterozoic (absence of anorthosites from the Phanerozoic or Archean geological records) points toward a less conventional tectonic process [e.g., Bédard, 2010]. The widest anorthosite massif in the Grenville Province, Lac Saint-Jean, is traversed by the QM-III network and sampled by stations QM50 and DMCQ. A large part of the Lac Saint-Jean anorthosite massif occurs within a highly negative Bouguer anomaly (about −70 mGal) whose strength decreases abruptly to −30 mGal to the SE (Figures 5 and 8). The anomaly was tentatively interpreted to reflect the presence of intrusive igneous rocks, an undefined lower crustal batholith or the continuation of Archean rocks beneath Grenville allochthons [Dufréchou and Harris, 2013]. Lithoprobe seismic profiles in the southwest [White et al., 2000] indicate that Archean basement extends as far as 250 km eastward beneath the southwest Grenville Province, although its extent is more restricted farther northeast (∼100 km) [Martignole et al., 2000]. Thus, lower crust extension of Archean rocks as far as the location of station QM50 (∼350 km SE of the front) is improbable. The grada-tional Moho can be explained by Proterozoic mafic underplating, which subsequently fractionated to form the feldspar-rich anorthosite massifs that rose to shallow crustal levels. Evidence for ultramafic cumulates may