HAL Id: hal-01456782
https://hal.univ-reunion.fr/hal-01456782
Submitted on 12 Feb 2017
HAL is a multi-disciplinary open access
archive for the deposit and dissemination of
sci-entific research documents, whether they are
pub-lished or not. The documents may come from
teaching and research institutions in France or
abroad, or from public or private research centers.
L’archive ouverte pluridisciplinaire HAL, est
destinée au dépôt et à la diffusion de documents
scientifiques de niveau recherche, publiés ou non,
émanant des établissements d’enseignement et de
recherche français ou étrangers, des laboratoires
publics ou privés.
crustal evolution
Elisa Rindraharisaona, F Tilmann, X Yuan, G Rümpker, J Giese, G
Rambolamanana, Guilhem Barruol
To cite this version:
Elisa Rindraharisaona, F Tilmann, X Yuan, G Rümpker, J Giese, et al.. Crustal structure of southern
Madagascar from receiver functions and ambient noise correlation: Implications for crustal evolution.
Journal of Geophysical Research : Solid Earth, American Geophysical Union, 2017, 112, pp.1-19.
�10.1002/2016JB013565�. �hal-01456782�
Crustal structure of southern Madagascar from receiver
functions and ambient noise correlation: Implications
for crustal evolution
E. J. Rindraharisaona1,2 , F. Tilmann1,3 , X. Yuan1 , G. Rümpker4, J. Giese3 ,
G. Rambolamanana2, and G. Barruol5
1Deutsches GeoForschungsZentrum GFZ, Potsdam, Germany,2Institut et Observatoire de Géophysique Antananarivo,
Université d’ Antananarivo, Antananarivo, Madagascar,3Department of Earth Sciences, Freie Universitat Berlin, Berlin, Germany,4Institute of Geosciences, Goethe University Frankfurt, Frankfurt, Germany,5Laboratoire GéoSciences Réunion,
Université de La Réunion, Institut de Physique du Globe de Paris, Sorbonne Paris Cité, UMR CNRS, Paris, France
Abstract
The Precambrian rocks of Madagascar were formed and/or modified during continental collision known as the Pan-African orogeny. Aborted Permo-Triassic Karoo rifting and the subsequent separation from Africa and India resulted in the formation of sedimentary basins in the west and volcanic activity predominantly along the margins. Many geological studies have documented the imprint of these processes, but little was known about the deeper structure. We therefore deployed seismic stations along an SE-NW trending profile spanning nearly all geological domains of southern Madagascar. Here we focus on the crustal structure, which we determined based on joint analysis of receiver functions and surface waves derived from ambient noise measurements. For the sedimentary basin we document a thinning of the underlying crystalline basement by up to ∼60% to 13 km. The crustal velocity structure demonstrates that the thinning was accomplished by removal or exhumation of the lower crust. Both the Proterozoic and Archean crust have a 10 km thick upper crust and 10–12 km thick midcrust. However, in contrast to the typical structure of Proterozoic and Archean aged crust, the Archean lower crust is thicker and faster than the Proterozoic one, indicating possible magmatic intrusions; an underplated layer of 2–8 km thickness is present only below the Archean crust. The Proterozoic mafic lower crust might have been lost during continental collision by delamination or subduction or thinned as a result of extensional collapse. Finally, the Cretaceous volcanics along the east coast are characterized by thin crust (30 km) and very large VP∕VSratios.1. Introduction
The characteristic structure of Archean and Proterozoic crust has been debated. However, many observa-tions have shown that it is not the same everywhere because of the different tectonic history experienced by the lithosphere in different places. Reviewing the seismic wave velocity structure under Precambrian terranes, Durrheim and Mooney [1991, 1994] suggested that Proterozoic crust is generally thicker (40–55 km) than Archean crust (27–40 km), whereas Rudnick and Fountain [1995] found that both have a similar crustal thickness. Durrheim and Mooney [1991, 1994] proposed that the Archean crust was formed above a hotter mantle, depleted in FeO and volatiles by previous komatiite eruptions, while the Proterozoic crust was formed above fertile mantle, which is prone to partial melting and capable of producing basaltic material for crustal underplating. They concluded that the Proterozoic crust was thickened by underplating of mafic material (P wave velocity>7.0 km/s) at the base of the crust, which is absent in the Archean crust. However, mafic underplating could be observed in Archean crust that had been affected by post-Archean magmatic events (e.g., Karelian Province of the Baltic Shield) [Durrheim and Mooney, 1994]. More recent studies pointed out the similarity between Archean and Proterozoic crust in East Africa, India, and southeastern Australia [e.g., Julià
et al., 2005, 2009; Fontaine et al., 2013]. Artemieva and Thybo [2013] show seismic evidence for mafic
litholo-gies in the lower part of the Archean crust in Europe. Furthermore, they found that European crust younger than 1.7 Ga is on average thinner (35–38 km) than Archean-Paleoproterozoic crust (42–44 km) [Artemieva
and Thybo, 2013], i.e., the opposite pattern of that inferred in the earlier study by Durrheim and Mooney [1994].
By investigating the characteristics of Archean crust, Abbott et al. [2013] found that more than 60% of the Archean crust undisturbed after 2.5 Ga has a flat and sharp Moho discontinuity and a crustal thickness from 32 to 39 km.
RESEARCH ARTICLE
10.1002/2016JB013565
Key Points:
• The crustal structure is strongly correlated with the different geological units
• The Archean crust is thicker than the Proterozoic and a mafic layer forms the bottom of the Archean crust but is absent in the Proterozoic
• The lower crust has been removed or thinned below the western Morondava basin Supporting Information: • Supporting Information S1 Correspondence to: E. J. Rindraharisaona, [email protected] Citation: Rindraharisaona, E. J., F. Tilmann, X. Yuan, G. Rümpker, J. Giese, G. Rambolamanana, and G. Barruol (2017), Crustal structure of southern Madagascar from receiver functions and ambient noise correlation: Implications for crustal evolution, J. Geophys. Res. Solid Earth, 122, doi:10.1002/2016JB013565.
Received 21 SEP 2016 Accepted 9 JAN 2017
Accepted article online 30 JAN 2017
©2017. American Geophysical Union. All Rights Reserved.
Figure 1. Simplified geological map of southern Madagascar [after Boger et al., 2008a, 2008b, 2008c; Martelat et al.,
2000; Roberts et al., 2012; Tucker et al., 2011] and distribution of the seismic stations used in this work. Cn: Cenozoic sediments, Cr: Cretaceous sediments, Cb-Jr: Carboniferous-Jurassic sediments, Vb: Vohibory Domain, Ad: Androyen domain, An: Anosyen domain, Ik: Ikalamavony domain, It: Itremo Sheet, At: Antananarivo domain, Ms: Masora domain, Cr-Vl: Cretaceous volcanics, Ad-Vl: Androy volcanic, Bg-Rn: Bongolava-Ranotsara shear zone, Am: Ampanihy shear zone, Br: Beraketa shear zone, Ej: Ejeda shear zone, Zz: Zazafotsy shear zone, and If: Ifanadiana shear zone (shear zones after Martelat et al. [2000]). Triangles and diamonds show broadband and short period stations, respectively. Lines AB and BC show locations of the cross sections in Figures 4, 5, 7, S2, and S8.
In Madagascar rocks of Archean and Proterozoic age are exposed in close proximity, but the continental crust has also been subjected to dramatic geodynamic events. At the end of the Proterozoic Madagascar was in the central part of Gondwana, sandwiched between India and Africa. The assembly during the Pan-African orogeny in the Neoproterozoic has left its mark in the Malagasy basement in the form of metamorphic belts or tectonic domains that occupy the eastern two thirds of the island, separated by ductile high-strain or shear zones [e.g., Andriamarofahatra et al., 1990; Paquette et al., 1994; Paquette and Nédélec, 1998; Shackleton, 1996; Tucker et al., 2014]. In southern Madagascar, the western third is an extended Carboniferous to Cenozoic sedimentary basin, whose formation is related to incipient rifting and which is closely related to the forma-tion of the Karoo in southern Africa [e.g., Geiger et al., 2004; Piqué et al., 1999]. The final separaforma-tion between Africa and the Gondwanaland fragment formed by India, Seychelles, and Madagascar started in the Jurassic with the locus of rifting shifting from the Karoo rift axis in the eastern Morondava basin to close to the present-day western coastline [Geiger et al., 2004]. In the Late Cretaceous (∼90 Ma), India and Seychelles were
separated from Madagascar [Storey et al., 1995]. Volcanic activity related to the final phase of this stepwise breakup of Gondwana from the Jurassic to Cretaceous has left a thin rim of Cretaceous volcanic formations, particularly along the eastern coast (Figure 1) [see Storey et al., 1995]. Finally, Neogene to Quaternary tec-tonic reactivation resulted in renewed volcanic activity and uplift in several places [e.g., Bardintzeff et al., 2010;
Roberts et al., 2012].
Numerous geological studies have been carried out to analyze the different tectono-metamorphic units in Madagascar [e.g., Lardeaux et al., 1999; Tucker et al., 2011, 2014]. However, the deep structure is so far less known due to the lack of seismological data. From 2012 to 2014 we operated a seismic array consisting of about 50 stations, which traversed southern Madagascar from the west to the east coast (SELASOMA experiment—SEismological signatures in the Lithosphere/Asthenosphere system of SOuthern MAdagascar). The array crossed the sedimentary Morondava basin in the west and the different tectono-metamorphic units in the east (Figure 1). Here we investigate the crustal structure by joint inversion of receiver functions and surface wave dispersion curves derived from ambient noise correlation in order to gain further insight into the evolution of Precambrian crust and to identify the imprint of the major tectonic events experienced by Madagascar.
2. Geological and Tectonic Setting
The Morondava basin is a rift basin of Carboniferous to Cenozoic age. Based on sparse reflection data, the maximum sedimentary thickness has been estimated to be 6 km [Geiger et al., 2004; Piqué et al., 1999] or 10–11 km [Boast and Nairn, 1982; Coffin and Rabinowitz, 1988]. The formation of the Morondava basin was mainly controlled by a predominantly Permo-Triassic continental failed rift (known as Karoo rift) and the breakup of Madagascar, India, and Seychelles from Africa during the Jurassic. The separation of Madagascar from India-Seychelles in the Late Cretaceous caused further extension in the Cenozoic [Geiger et al., 2004;
Giese et al., 2012; Piqué et al., 1999; Schandelmeier et al., 2004].
The eastern coast is mainly characterized by Upper Cretaceous volcanic and intrusive rocks including basalt and rhyolite flows and dikes emplaced rapidly during a period lasting less than 6 million year [Storey et al., 1995]. The volcanism was triggered by the passage of the Marion hot spot, which might have also forced the breakup from India-Seychelles [Storey et al., 1995]. Although surface exposures of Cretaceous volcanics are mostly observed along the eastern coast, the presence of its signature in other places such as the Androy volcano in the south [Boger et al., 2008b] and layers of Cretaceous basalt in the Morondava basin [Boger et al., 2008c], suggests that it might have affected most of Madagascar (Figure 1). Also, Besairie and Collignon [1971] have suggested that the Cretaceous basalt might once have covered the entire island.
East of the Morondava basin and west of the Cretaceous volcanics along the east coast, the Precambrian rocks in southern Madagascar have generally experienced ductile deformation at high-grade metamorphic condi-tions during the Neoproterozoic-Cambrian Pan-African orogeny [e.g., Giese et al., 2011; Lardeaux et al., 1999;
Martelat et al., 2000]. At that time, these rocks were at middle-to-lower crustal levels (upper amphibolite to
granulite facies conditions) [e.g., Horton et al., 2016; Jöns and Schenk, 2011; Markl et al., 2000] that are nowadays exhumed to the surface, thus today occupying a position within the upper crust. The tectono-metamorphic units in southern Madagascar crossed by the SELASOMA array include the Androyen, Anosyen, Ikalamavony, Antananarivo, and Masora domains (Figure 1) that are each characterized by their distinct age and litholog-ical composition. The Vohibory domain in the far southwest of the Precambrian basement was not directly crossed by the SELASOMA profile at the surface, but it is likely that vast parts of the sedimentary sequence of the Morondava basin are underlain by this tectonic domain [e.g., Jöns and Schenk, 2008], and it is thus relevant to the present study. The geology for the different domains is briefly described in the following.
1. The Masora domain constitutes Paleoarchean and Mesoarchean gneisses (∼3.2 Ga) intruded by 2.5 Ga granitic rocks [e.g., Moine et al., 2014; Tucker et al., 2014]. This domain was not affected by the high-grade Neoproterozoic tectonothermal events that characterized all other basement domains of Madagascar [e.g., Collins, 2006].
2. The Antananarivo domain mainly consists of Neoarchean magmatic and metamorphic rocks and is thought either to be related to the Greater Dharwar Craton in India [e.g., Tucker et al., 1999] or to be an indi-vidual continental fragment called “Azania” [e.g., Collins and Pisarevsky, 2005] that can be traced toward Africa into Somalia and Ethiopia [e.g., Collins and Pisarevsky, 2005]. This domain was modified by dif-ferent post-Archean magmatic events, e.g., the 840–700 Ma Imorona-Itsindro magmatic suite or the
∼550–510 Ma old Maevarano intrusive [e.g., Tucker et al., 2014, and references therein]. Although most of the Antananarivo domain is characterized by predominantly felsic units, it also contains the mainly mafic Tsaratana sheet overlying the felsic units in northern Madagascar, outside our study area.
3. The Ikalamavony domain is mainly constituted of abundant Neoproterozoic volcano-clastic metasedi-ments, Neoarchean gneisses, Neoproterozoic metaclastic rocks, and quartzite of Paleoproterozoic age likely formed in an island arc setting [e.g., Boger et al., 2014]. The occurrence of the ∼1 Ga old predominantly felsic to gabbroic Dabolava intrusive suite is unique within the Ikalamavony domain [e.g., Tucker et al., 2014, and references therein]. Subsequently, the Ikalamavony domain was intruded by the Imorona-Itsindro (840–700 Ma) and Ambalavao (∼550–510 Ma) magmatic suites indicating the juxtaposition of the Antananarivo domain and the Ikalamavony domain after ∼1 Ga but before ∼840 Ma [e.g., Boger et al., 2014;
Tucker et al., 2014, and references therein].
4. The Anosyen domain, as the relict of either the Greater Indian passive margin [e.g., Tucker et al., 2014] or the western passive margin of Azania (Azania according to Collins and Pisarevsky [2005]), collided with the microcontinent of the Androyen domain during the Neoproterozic [e.g., Boger et al., 2015]. Both domains are composed of Paleoproterozoic igneous rocks and supracrustal formations (rocks deposited on top of existing basement crust) [e.g., Boger et al., 2014; Collins, 2000; de Wit et al., 2001; Tucker et al., 2011, 2014]. Both Androyen and Anosyen domains were not affected by the Neoproterozoic Imorona-Itsindro mag-matic event but are intruded by the Ambalavao magmag-matic suite between ∼550 and 510 Ma [e.g., Tucker
et al., 2014].
5. The Vohibory domain is constituted of mafic and felsic orthogneiss, pelites, marbles, amphibolites, and granitoids [e.g., Collins and Pisarevsky, 2005; Jöns and Schenk, 2008; Moine et al., 2014]. The metabasic rocks in the Vohibory domain were interpreted as back-arc and island-arc basalts dated beween 850 and 700 Ma [Jöns and Schenk, 2008].
The different domains are separated from each other by tectonic contacts, i.e., ductile high-strain or shear zones that can be traced for hundreds of kilometers [e.g., de Wit et al., 2001; Tucker et al., 2014; Windley et al., 1994]. Ductile shear zones are not only limited to the contacts between different tectonic units but have also been developed a distinct shear zone network over large areas within the basement units of southern Madagascar [e.g., Martelat et al., 2000]. One of the prominent structures within this shear zone network is the NW-SE trending Ranotsara shear zone that—in older literature—has been considered as a boundary sepa-rating distinctly different blocks [e.g., Katz and Premoli, 1979; Muller, 2011]. This structure has been used to correlate with similarly oriented shear zones in southern India and eastern Africa to reconstruct the position of Madagascar within Gondwana [e.g., Lardeaux et al., 1999; Muller, 2011; Windley et al., 1994]. The interpretation of the Ranotsara as a major shear zone and a piercing point in Gondwana reconstruction have been ques-tioned by Schreurs et al. [2010], who identify a twofold history with (1) the indentation of the Antananarivo block causing a sinistral flexure with minor offset of the shear zone network in the central part of the Ranotsara Zone and (2) a brittle overprint, reactivating parts of the NW-SE trending ductile structures and extending brittle faults toward the SE.
Only very few geophysical studies have been carried out in Madagascar. All of the four permanent stations in Madagascar are located in Precambrian basement units. Receiver functions of these stations indicate a crustal thickness between 38 and 42 km [Rai et al., 2009; Rindraharisaona et al., 2013]. Inversion of local earthquake arrival times for the national network in central Madagascar revealed a similar crustal thickness [Rambolamanana et al., 1997]. The presence of a major sedimentary basin in western Madagascar with a sed-iment thickness exceeding 10 km [Coffin and Rabinowitz, 1988] suggests a thin crust, but so far, there has been no detailed information on the crustal structure due to the lack of seismic stations. Continental-scale surface wave studies revealed an average crustal thickness of 25 km [e.g., Pasyanos and Nyblade, 2007]. A local gravity study has inferred a fairly constant crustal thickness below the igneous and metamorphic rocks of east-ern Madagascar, that decreases by 4 km over ∼60 km horizontal distance toward the east coast [Fourno and
Roussel, 1994]. Recent analysis of shear wave splitting has shown significant crustal anisotropy with a NW-SE
fast axis in the central part of the profile below the Proterozoic Ikalamavony and Anosyen domains, indicative of widespread ductile deformation and a ∼N-S fast axis along the basement bordering the Morondava basin that trends both parallel to the Neoproterozoic/Cambrian Ampanihy shear zone and the margin of the Morondava basin [Reiss et al., 2016].
3. Data and Methods
The SELASOMA seismic array consisted of a combined linear and areal array in southern Madagascar (Figure 1) [Tilmann et al., 2012]. Twenty-five broadband stations were distributed along the linear array, extending from the west coast (Toliary) to the east coast (Mananjary) with a station spacing of 15–20 km. The array crosses most of the geological provinces and the major shear zone network of southern Madagascar. The areal array consisted of 23 short period stations, covering a broader area in the east, where the seismic activity is assumed to be comparatively high [Rakotondrainibe, 1977]. In this study, we have also included two stations (LONA and MAHA) from the MACOMO (MAdagascar-COmoros-MOzambique) project that was installed in Madagascar between 2011 and 2013 [Wysession et al., 2012] and five stations (RUM1-5) from the RHUM-RUM (Réunion Hotspot and Upper Mantle-Réunions Unterer Mantel) project [Barruol et al., 2012], which were operated along the southern east coast of Madagascar between 2012 and 2014. The data from two permanent stations, VOI, operated by GEOFON since 2009 [GEOFON Data Centre, 1993], and FOMA, operated by Geoscope since 2008 [Institut de Physique du Globe de Paris (IPGP) and Ecole et Observatoire des Sciences de la Terre de Strasbourg
(EOST), 1982], have also been reanalyzed.
3.1. Receiver Functions
A total of 113 teleseismic events at epicentral distance between 30∘ and 90∘ and with a body wave magnitude of>5.5 were visually selected for the receiver function computation (Figure S1 in the supporting information). Waveform data were band-pass filtered between 2 and 50 s and rotated into vertical (Z), radial (R), and trans-verse (T) components. Finally, the radial receiver function was obtained through the iterative time domain deconvolution procedure [Ligorría and Ammon, 1999]. Events that reproduce 80% or more of the initial radial waveform after the deconvolution were retained for further analysis.
We stacked the receiver functions in different ways. First, we used the H-𝜅 (H: Moho depth, 𝜅: VP∕VSratio, VP:
seismic P wave velocity, and VS: seismic S wave velocity) stacking method [Zhu and Kanamori, 2000] to estimate
the crustal thickness and average crustal VP∕VSratio for all stations. This technique stacks the amplitudes of
the receiver functions at the predicted arrival times of the Moho converted phase and crustal reverberations (Ps, PpPs, and PpSs + PsPs) at different weights. For the correct values of H and𝜅, the three phases are stacked coherently, resulting in the largest amplitude of the stack. In this work, the weights of Ps, PpPs, and PpSs + PsPs were set to be 0.7, 0.2, and 0.1, respectively. An average VPof 6.1 km/s was assumed. The H-𝜅 stacking was
repeated 200 times to estimate errors with the bootstrapping resampling method [Efron and Tibshirani, 1990;
Julià and Mejia, 2004].
The second method used to analyze the receiver functions was Common Conversion Point (CCP) Stacking [Kind et al., 2002; Yuan et al., 2000]. This technique creates an image of the subsurface conversion strength from
Ps conversions and their multiples, respectively, assuming subhorizontal interfaces. In this method, receiver
function amplitudes were back projected along their raypaths using the IASP91 [Kennett and Engdahl, 1991] velocity model to convert time to depth.
3.2. Ambient Noise Rayleigh Wave Group Velocity Tomography
We used the continuous data recorded by the broadband stations along the W-E profile and along the east coast for ambient noise analysis. Rayleigh wave group velocities at periods of 5–25 s were obtained from the vertical component of the Green’s function, estimated from ambient noise correlation. To determine funda-mental Rayleigh wave dispersion curves, we followed the method of Bensen et al. [2007] by carrying out the following steps: downsampling to 2 Hz, removing the instrumental response, spectral whitening; high-pass filtering with 40 s corner period, and 1 bit normalization. The vertical components were cross correlated between each station pair for each shared day. Finally, the final cross-correlation-based empirical Green’s func-tion estimates were generated by stacking the daily averages. An example of a cross-correlafunc-tion funcfunc-tion between MS09 and other stations along the main profile AB and between RUM3 and other stations along BC is shown in Figure S2. We interactively measured the group velocity dispersion curves using the multiple filter analysis as implemented by Herrmann and Ammon [2002].
The maximum period for each station pair depends on the interstation distance. A minimum interstation spac-ing of three wavelengths was imposed [Bensen et al., 2007]. Assumspac-ing a group velocity of 4 km/s, for a given interstation distance Δ (in kilometer) the maximum reliable period of dispersion curves is thus Δ/12. Although the maximum interstation distance between stations allows us to determine the Rayleigh wave group veloci-ties up to ∼40 s, we only analyzed the Rayleigh wave dispersion curves at periods of 5–25 s due to the limited
data quality at longer periods. More details about how we checked the quality of our data are given in Text S1 and Figure S3.
To invert the Rayleigh wave interstation group dispersion curves into a group velocity model, we used the Fast Marching Surface wave Tomography method (FMST) [Rawlinson and Sambridge, 2004, 2005]. In this method, the fast marching method is used to predict the travel times and a subspace inversion is used for the inversion. The essentially linear distribution of stations does not permit to carry out a full 2-D tomography, for which the FMST code is set up. Therefore, the model grid nodes were set up to be very coarse in latitudinal direction (3∘) and much finer in longitudinal direction (0.5∘), along the main profile (AB). This setup essentially results in a 1-D tomographic inversion with velocities only dependent on longitude, which actually matches the approx-imately N-S orientation of most of the geological domain boundaries crossed by our linear array. A reverse configuration was assumed along profile BC, i.e., grid nodes were set up to be 0.5∘ and 3∘ in latitudinal and longitudinal directions, respectively. The forward calculation for the solution of the Eikonal tomography was carried out on a much finer computational grid with 0.03∘ × 0.03∘ spacing (for both profiles), ensuring accurate travel time calculations. The trade-off curves between the misfit and model variance using a set of damping factors are presented in Figure S4 for different set of periods.
3.3. Joint Inversion of Receiver Function and Rayleigh Wave Surface Dispersion
Receiver functions provide good constraints on shear wave velocity contrasts and depths of discontinuities but are not sensitive to absolute velocities and cannot detect gradual changes of velocities. In contrast, infor-mation on absolute velocities as a function of depth is contained in the dispersion of the surfaces wave. The two data sets are thus containing complementary information to investigate the Earth structure, such that their joint inversion can reduce the nonuniqueness inherent to each method [Julià et al., 2000].
Using a linearized least squares inversion scheme [Herrmann and Ammon, 2002], we jointly inverted the receiver functions and Rayleigh wave dispersion curves, which were extracted at each station location from the tomographic models for the different periods. To avoid one data set dominating, this method takes into account the number of data points and the variance for each data set. To control the trade-off between fit-ting the receiver functions and group velocity dispersion curves, an influence parameter p was used. In this work, equal contribution of receiver function and dispersion data was assumed, i.e., p was set to 0.5. We checked the stability of the resulting models by carrying out the inversion with several different starting mod-els and exploring various options for modeling the receiver functions (see Text S2 for details). Because both Rayleigh wave dispersion and receiver functions are more sensitive to the S velocity structure than to the P wave structure, the VP∕VSratio was fixed to the value obtained by the H-𝜅 analysis for each station during
the inversion.
3.4. VP∕VSRatio in Different Crustal Layers and Bouguer Anomaly Computation
The crust can be coarsely divided into three layers representing today’s crustal structure of Madagascar. Although we are aware that the crustal section nowadays exposed at the surface represent the middle-to -lower crustal sections during Pan-African orogeny [e.g., Giese et al., 2011; Horton et al., 2016; Jöns and
Schenk, 2011; Markl et al., 2000], in this study, we refer to the crystalline layer near the surface as the
upper crust and define middle and lower crust based on the presence of intracrustal discontinuities and velocity ranges, i.e., sediment (VS< 3.1 km/s), upper-to-middle crust (3.1≤ Vs < 3.8 km/s), and lower crust (3.8 ≤ Vs < 4.3 km/s). Using these velocity ranges, the thickness of each layer is set according to the velocities obtained in the joint inversion models. Based on the results of the H-𝜅 stacking, we further esti-mated average VP∕VSratios along the profile in each of the three layers in the following way. Assuming VP∕VS
ratios for the three crustal layers and the VSjoint inversion model, we can predict the expected arrival times of
the Moho Ps and PpPs phases at each station. These are then compared with the Ps and PpPs times predicted for the (assumed uniform) velocity, VP∕VSratio, and Moho depth from the H-𝜅 results, i.e., we are effectively
matching the averaged observed times of the Moho conversion and its first multiple at each station. We then adjust the VP∕VSratio in the three layers as well as the Moho depths below each station to match these times simultaneously at all stations. For N≥ 3 (N: number of stations), this is essentially an overconstrained inverse problem, as there are N + 3 model parameters (the Moho depth below each station plus the VP∕VSratios in the three layers) and 2N data points (observed H and𝜅 values at each station). In this analysis we excluded the stations in the volcanic areas in the far east of the profile, as these showed anomalously high VP∕VSratios
and intracrustal low-velocity zones for some stations, which does not fit the assumption of a simple crust composed of sediments, upper and lower crust.
The VP∕VSratios obtained for the different crustal layers were then used to compute the P wave velocity from the S wave velocity models. Based on the P velocities, we determined the density using two empirical relationships: Birch, ’s [1961] law for the crustal basement and the Nafe and Drake [1961] relationship for the sedimentary basin. We then computed the gravity anomaly following the method described in Blakely [1996]. In order to compute the gravity anomaly, we divided our model into a 2-D rectangular grid with a constant density within each grid cell (2 × 2 km). The resulting gravity anomaly along the profile was obtained by cal-culating the sum of the effects of all grid cells. We assume the structure at the limits of the seismic profile to extend to infinity. Of course, the real structure will transition fairly quickly to oceanic crust beyond the eastern coast and to the thinned crust of the Mozambique channel beyond the western coast, such that the predicted anomaly will be dominated by edge effects approximately 50–100 km from each end.
4. Results
4.1. Moho Depth and VP∕VSRatio
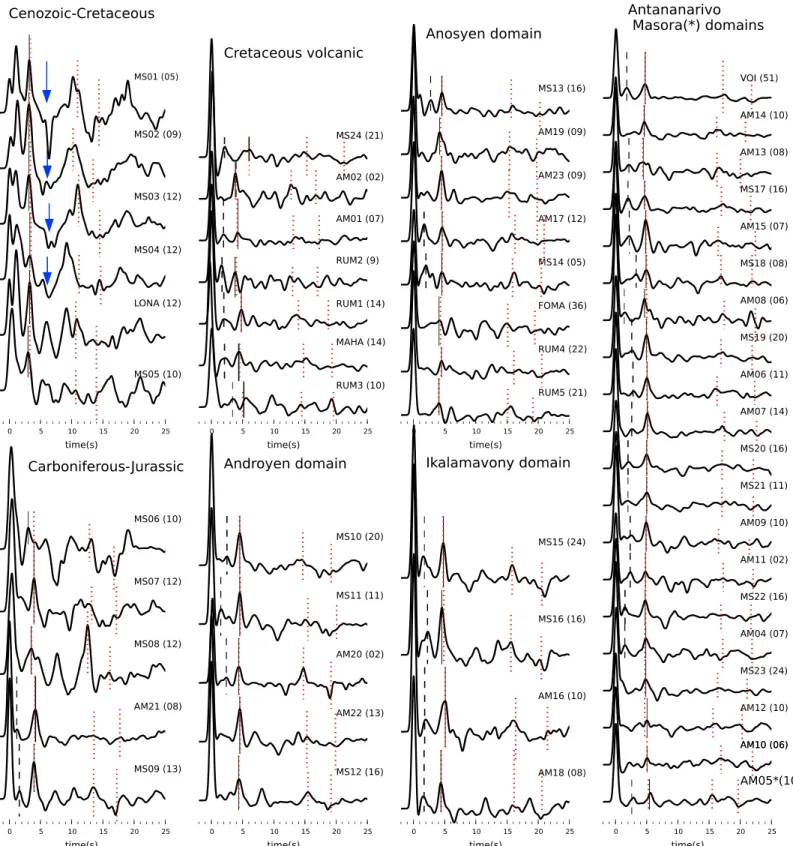
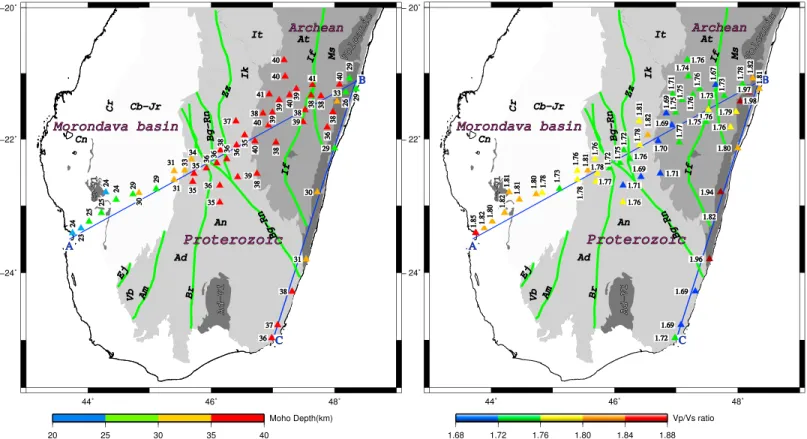
For simplicity we use the nomenclature of the crustal layers introduced in section 3.4. The retrieved receiver functions for all stations are shown in Figure 2. Apart from the stations in the sedimentary Morondava basin and Cretaceous volcanics along the east coast the Ps phases are clearly observed, indicating a sharp Moho (solid lines in Figure 2). All stations in the Precambrian shield have simple receiver functions. In addition to the Ps phase at ∼3.3–5.2 s, another clearly visible phase seen at most stations at ∼1.1–2.25 s marks the direct P-S conversion from an intracrustal interface (probably marking the boundary between the upper and middle-to-lower crust). In contrast, stations located in the Morondava basin have complicated receiver func-tions, with strong sedimentary reverberations. A strong phase at around ∼1 s corresponds to the base of the sediments. The phase between 3 and 4 s is probably the Moho Ps phase, although it might be contaminated by sedimentary multiples. For stations in the Cretaceous volcanics on the east coast, the Ps phases are not as clear as for the stations in the Precambrian shield, indicating the presence of a gradational Moho discontinuity. However, there is a clear phase at ∼2 s, indicating the boundary between the upper and lower crust. For most stations, the multiple phases are observed at ∼15–17 s and ∼19–22 s for PpPs and PpSs, respectively. Figure S5 shows the H-𝜅 stacking maps for all stations. The results of the H-𝜅 stacking are summarized in Table S1 and Figure 3. The crustal VP∕VSratio correlates quite closely with the geological domains. It decreases from
up to 1.85 in the Morondava basin to 1.67 beneath the Precambrian rocks (Figure 3). The highest VP∕VSratio
(1.98) is found in the Cretaceous volcanics along the eastern coast. The Moho depth ranges from 23 to 31 km in the sediment-covered areas and increases to 32–41 km in the Precambrian block. Along the east coast the Cretaceous volcanic province is clearly distinguished from the Proterozoic domain by its thinner crust (30 km) and high VP∕VS(1.8–1.98) (Figure S6).
The VP∕VSratios and Moho depths for each station were used as input for a more complex crustal model,
allowing the VP∕VSratio to vary in three crustal layers, as described in section 3.4. A VP∕VSratio of 1.92 ± 0.03
for the sediments, 1.75 ± 0.05 for the upper-to-middle crust and 1.72 ± 0.06 for the lower crust is obtained (Figure S7) which associates with the smallest misfit with the H-𝜅 stacking results everywhere except in the excluded volcanic formation along the east coast.
In total, 553 receiver functions were used in the CCP stacking, shown in Figure 4. The Moho imaged from the direct Ps and the two multiples phases are mostly similar in depth and amplitude except beneath the eastern end of the profile (MS24 and AM05). The Ps and the PpPs phases show the thickest crust (43 km) of the profile below these stations, whereas the Moho in the PpSs section is shallower. This apparent discrepancy can be explained by the much larger VP∕VSratio in the volcanic areas. In agreement with the H-𝜅 stacking results,
the crustal thickness increases from west to east with the thinnest crust found in the Morondava basin and the thickest crust beneath AM05 in the Masora domain (43 km). The crust in the younger, western part of the Precambrian shield (i.e., Androyen, Anosysen, and Ikalamavony domains) is relatively thinner (average 35 km) compared to that in the older, eastern part (average 39 km). There are no noticeable offsets associated with the shear zones or brittle faults (i.e., Ranotsara Zone) within the Proterozoic domains. However, the Moho is 2–3 km deeper in the Antananarivo domain than beneath the neighboring Ikalamavony domain.
Because of the much larger interstation distances, there is no overlap between the traces of neighboring stations along the eastern coast. There is thus little additional information added beyond the station stacks, and the corresponding CCP stack is only shown in Figure S8.
Figure 2. Stacked receiver functions at each station, computed using a Gaussian filter width of 2.5 s (corresponding to a 1.25 s low-pass filter). Pms phases in
receiver functions were move out corrected using a reference slowness of 0.056 km/s before the summation. Station code and the number of receiver functions are shown above each trace. The solid vertical line in each panel marks the observed Moho phase, dashed vertical line marks the phase from an intracrustal discontinuity, and dotted vertical line marks the estimated phases from theH-𝜅stacking. Blue arrows indicate a possible low seismic velocity zone in the uppermost mantle below the Morondava basin.
Figure 3. Map of the (left) Moho depth (in km) and (right)VP∕VSratio at each station from theH-𝜅stacking analysis. Lines AB and BC show the cross sections in Figures 4, 5, 7, and S8. Green lines show position of selected shear zones [after Martelat et al., 2000], nearly coincident with secondary domain boundaries (see Figure 1).
Figure 4. CCP stacking image for the receiver functions along the main profile (line AB) migrated for directly converted
phase (top) Ps and for the two multiples (middle) PpPs and (bottom) PpSs+PsPs. Positive and negative velocities contrasts are shown in red and blue, respectively. In each panel, black lines indicate the maximum Moho amplitude. The green lines show the Moho obtained from theH-𝜅stacking for comparison. Abbreviations as in Figure 1.
Figure 5. (a and b) Rayleigh wave group velocity dispersion curves measured for station pairs between MS09 and other stations along the main profile, AB
(Figure 5a), and between RUM3 and the other stations along the eastern coast, BC (Figure 5b). In the legend, the stations are ordered from west to east (Figure 5a), and from north to south (Figure 5b). Stations MS01-MS07 are located in the Morondava basin, and the remainder are in the Precambrian domains (Figure 5a). Similarly, stations RUM4, 5 and FOMA are in the Anosyen domain and the remainder in the volcanic region (Figure 5b). (c and d) Rayleigh wave group velocity along AB (Figure 5c) and BC (Figure 5d) at different periods.
4.2. Rayleigh Wave Group Velocity
Figures 5a and 5b show the Rayleigh wave group velocity dispersion curves measured between MS09 and RUM3 and the other stations along the profiles AB and BC, respectively. Station MS09 is located close to the boundary between the Precambrian domains, and the sedimentary basin and RUM3 is at the edge of the Cretaceous volcanic formation. Along AB (Figure 5a), there are two distinct groups of dispersion curves: the first group between MS09 and the stations located in the Precambrian rocks shows relatively high veloci-ties and little variation with period, indicating the presence of thick crust and absence of a sedimentary cover along the propagation path. The second group between MS09 and the stations in the sedimentary formations shows very low velocities at short periods, indicating the presence of thick sediments. The large slope of the dispersion curves in this group results from the increasing sensitivity to the basement material with increas-ing wave period. The dispersion curves along the eastern coast exhibit slow velocities for periods between 10 s and 18 s for paths to stations in the volcanic rocks, but not so for those in the Anosyen domain (Figure 5b). The same pattern is naturally also found in the 1-D tomographic models (Figures 5c and 5d). Along profile AB (Figure 5c) the crystalline rocks in the Precambrian shield extend to the near surface, resulting in high group velocities at short periods. In the west the sedimentary basins cause very low velocities. In profile BC (Figure 5d), the lowest velocities are found at periods around 15 s below the volcanic rocks along the east coast, but not in the Proterozoic Anosyen domain to the south, where the group velocity minimum appears at much longer periods.
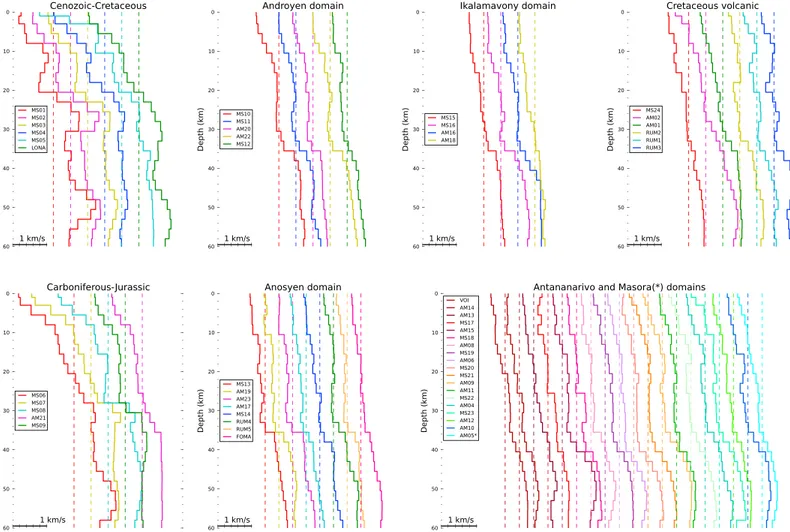
Figure 6. S wave velocity models resulting from joint inversion of receiver functions and Rayleigh wave dispersion for each station arranged by geological
domain. Dashed vertical line marks the velocity of 3.8 km/s.
4.3. Shear Wave Velocity Structure From Joint Inversion
The S wave velocity models beneath each station resulting from the joint inversion are displayed in Figure 6. At all crustal depths, the differences resulting from different starting models are less than 0.2 km/s (Figures S9 and S10), and we take this as a rough indication of the uncertainty of the S velocity models obtained by joint inversion.
The results of the different techniques are summarized in Figure 7. We also computed the Bouguer anomaly from the seismic model using the velocity-density conversion described in section 3.4 (Figure 7, top). Except around the edges of the model, which are strongly affected by unmodeled structure beyond the limits of the cross section, the agreement is very good. The visually notable anticorrelation of the Bouguer anomaly and topography is consistent with Airy isostacy.
The Morondava basin is characterized by a thin crust (23–31 km) with the presence of low S wave veloci-ties near the surface (<3.1 km/s). These low velocities belong to the sedimentary cover with a thickness of 4–10 km. In the Precambrian eastern two thirds of the island, three crustal layers can be identified below most stations. The boundaries are identified by jumps of the S wave velocity of more than 0.2 km/s between neighboring depth cells of the inversion model. In the Archean crust, our models show the presence of a fast lower crust (3.8–4.0 km/s), with a thin layer of higher velocity at the bottom of the crust (4.0–4.3 km/s). These high velocities indicate mafic lithologies in the lower part of the Archean crust. The Proterozoic crust is thinner (35–38 km) compared to the Archean crust (38–43 km), and there is no indication of a high-velocity layer at the base of the crust. For the Cretaceous volcanics, the crustal S wave velocities are lower than in the other domains (Figure 6). However, midcrustal low-velocity zones are only seen at a few stations and are not pervasive.
Figure 7. Cross section along the main profile AB. (top) Elevation (yellow), observed Bouguer anomaly [Fourno and Roussel, 1994] (green) and computed Bouguer
anomaly (cyan). Misfit at the edges is due to unknown structure beyond the limits of the profile. (middle) Moho depths andVP∕VSratios from theH-𝜅stacking
with estimated errors. The tectonic units refer to the tectonometamorphic domains in Figure 1. (bottom) S wave velocity obtained from the joint inversion of receiver functions and surface wave dispersion curves. The single station models were shifted according to station elevation such that the depths shown are with respect to sea level. Dash-dotted, dashed, dotted, and solid lines show the sediment to upper crust, upper to middle crust, middle to lower crust, and
5. Discussion
The observed crustal structure in the Precambrian shield in southern Madagascar differs from that for a typical Archean-Proterozoic crust [e.g., Durrheim and Mooney, 1991, 1994; Rudnick and Fountain, 1995]. In Madagascar, the Archean crust (Antananarivo and Masora domains) is thicker than the Proterozoic crust (Ikalamavony, Anosyen, and Androyen domains). Moreover, assuming VS= 3.9 km/s as a transition from felsic to intermediate-mafic lower crust [Rudnick and Fountain, 1995; Rudnick and Gao, 2003], our observations sug-gest that mafic component is either missing in the Proterozoic lower crust (Androyen and Anosyen domains) or has only minor contribution (Ikalamavony domain), whereas it forms the bottom layer of the Archean domains (Antananarivo and Masora domains) (Figure 7). We will structure the discussion by the geologi-cal units from west to east and then compare the crustal structure of Madagascar with that of Pan-African Orogeny in East Africa and India.
5.1. Nature and Evolution of the Crust
5.1.1. Carboniferous-to-Cenozoic Sedimentary Basin: The Morondava Basin
In the Cenozoic to Cretaceous formation in the western half of the basin, the Moho is found at a depth of 23–25 km below a 10 km sedimentary package and a crystalline crust of 12 to 14 km thick. The bulk crustal velocities are low, typical for an upper crust, implying that most of the lower crust has been removed (Figure 7). In contrast, in the Carboniferous to Jurassic formations in the eastern Morondava basin, the Moho is pro-gressively deeper toward the east (29–31 km) with a preserved lower crust of 6–10 km thick. The sediment thickness decreases gradually from 10 km to 3 km toward the east. These different crustal architectures can be attributed to the two main different stages of rifting that affected the Morondava basin [e.g., Coffin and
Rabinowitz, 1988; Geiger et al., 2004; Piqué et al., 1999; Schandelmeier et al., 2004]: (1) the continental failed rift
known as the Karoo, which was predominantly active along the eastern margin of the Morondava basin dur-ing the Permo-Triassic and resulted in moderately thinned crust and sedimentary infill and (2) the Jurassic rift and breakup from Africa, which affected the western Morondava basin and further thinned the crust already stretched in the Karoo, most likely by low-angle normal faults. This thinning could account for removal of the lower crust by exhumation along a large-scale, low-angle detachment fault. Breakup and subsequent drifting led to the deposition of thick sedimentary sequences [e.g., Coffin and Rabinowitz, 1988; Geiger et al., 2004]. The crystalline upper crust below the sedimentary formation has similar properties as the upper crust below the Precambrian shield. Jöns and Schenk [2008] have proposed that the rocks underlying the Morondava basin could be those of the northern and western continuation of the Vohibory domain. Thus, the presence of the mafic lithology in the remaining lower crust in the Morondava basin is expected. In fact, the Vohibory domain considered to be in formed in a basaltic island or back-arc arc setting [e.g., Jöns and Schenk, 2008]. In the western part of the Morondava basin crustal extension during rifting and breakup has likely removed the lower part of the crust completely, resulting in a sharp Moho discontinuity.
5.1.2. Proterozoic Crust: Androyen, Anosyen, and Ikalamavony Domains
Laboratory studies suggest that the S wave velocities larger than 3.9 km/s in the lowermost crust are an indi-cator of felsic-to-intermediate lower crust transition [Rudnick and Fountain, 1995; Rudnick and Gao, 2003].
Christensen [1996] determined a VP∕VSratio of 1.79 ± 0.13 for felsic granulite rocks. Therefore, the observed
S wave velocities in the lower crust (∼3.9 km/s) and crustal average VP∕VSratio (mostly 1.76–1.78) obtained
in the Androyen, Anosyen, and Ikalamavony domains indicate the presence of felsic-to-intermediate lower crust. It should be noted, though, that the Anosyen domain generally exhibits a slightly lower VP∕VSratios of
1.69–1.76. Moho depths in the Proterozoic domain are quite uniformly at 35–38 km.
In previous works, Proterozoic crust has been associated with a high VP∕VSratio, relatively thick crust (>40 km)
and gradational Moho discontinuity, often attributed to an underplated layer [e.g., Durrheim and Mooney, 1991, 1994; Rudnick and Fountain, 1995; Artemieva and Thybo, 2013]. None of these properties are observed for the Proterozoic crust in southern Madagascar. The question is whether the Malagasy Proterozoic domain ever had a high-velocity mafic layer in its lower crust which was removed by later events or it had an original felsic lower crustal type? If a mafic lower crust was present, when and how was it removed, and which tec-tonic event could have thinned the Proterozoic crust again in the southern part of Madagascar? The evolution of the Proterozoic crust in the south of Madagascar was marked by magmatic, deformation, and metamor-phic events between ∼580 and 510 Ma associated with the Pan-African orogeny resulting in the formation of crustal-scale high strain or shear zones and thickening of the crust to up to 60–70 km [e.g., Giese et al., 2011;
metamorphic extensional tectonics partly reactivated formerly ductile structures [e.g., Giese et al., 2011, 2016;
Schandelmeier et al., 2004; Schreurs et al., 2010] implying thinning of the overthickened crust by either
delami-nation of the lowest part of the crust, gravitational spreading or orogenic collapse, and removal of upper crust by erosion, or a combination of the aforementioned processes.
The Androyen domain is considered to represent a former microcontinent and therefore expected to have a bulk felsic composition, and the Anosyen domain is described as comprising supracrustal—thus also felsic—rocks that developed in a passive continental margin setting [e.g., Boger et al., 2014, 2015]. Therefore, those domains may have had an original felsic lower crustal type. Only the Ikalamavony domain, as the rem-nant of a former volcanic island arc [e.g., Boger et al., 2014], could be expected to involve intermediate to mafic crust, but it does not show velocities different from other Proterozoic domains (Figure 7). The mag-matic events that affected the crust during the Proterozoic (i.e., Dabolava and Imorona-Itsindro suites for the Ikalamavony and Ambalavao suites for all domains) had thickened the crust possibility by magmatic underplating. Thus, mafic lower crust might have been present within these domains (as commonly seen in the Proterozoic crust) [Durrheim and Mooney, 1994] but must have later been delaminated. In fact, the observed flat Moho discontinuity within the area combined with the high-temperature metamorphism that affected the southern part of Madagascar [e.g., Horton et al., 2016; Jöns and Schenk, 2011; Markl et al., 2000;
Martelat et al., 2000; Nédélec et al., 2000] favors the delamination or subduction of the lower part of the crust,
similarly to current processes observed for example under the Pamir-Hindukush [Kufner et al., 2016]. In any case, a thickened crust of ∼60–70 km is prone to instability: orogenic or gravitational collapse, as previously proposed by de Wit et al. [2001] for the Pan-African orogen in Madagascar, may then lead to crustal thinning [e.g., Dewey, 1988] as an alternative process to crustal delamination. In the latter scenario, however, mafic material would not be removed but could be thinned, maybe obscuring its seismic signature.
No anomaly can be unambiguously associated with the Bongolava-Ranotsara shear zone or any of the other shear zones along the profile, suggesting that the shear zones presently separate crustal blocks with similar structures: even though the thinner crust and lower velocities in the lower crust in the area of the shear zones could be related to shear zone (re)activation. In practice, this is impossible to separate from inherited differ-ences due to other processes. Similarly, Reiss et al. [2016] observed a disturbance of fast splitting directions in central Madagascar, but this cannot be associated with individual shear zones: the measurements indicate a ∼150 km wide zone of anisotropy mostly focused on the Proterozoic domains and also encroaching into the margin of the Antananarivo domain.
5.1.3. Archean Crust: Antananarivo and Masora Domains
The average crustal VP∕VSratio of 1.75 ± 0.04 in the Antananarivo domain normally indicates felsic to
interme-diate crust [Christensen, 1996]. However, the relatively high VSin the entire lower crust instead suggests the presence of mafic lithologies. In addition, a thin layer of at least 2 km thickness with very high VS(>4.0 km/s) and therefore definitely of mafic composition is observed at the bottom of the crust. The presence of mafic rocks, probably mafic granulite in the lower part of the crust, is also in agreement with the gradational Moho discontinuity within the Antananarivo domain seen in the joint inversion results (Figure 6). Therefore, we sug-gest a mafic underplating below the whole width of the Antananarivo domain. The relatively low average crustal VP∕VSratio can be explained by the fact that the mafic underplated layer of high crustal velocity at the bottom of the crust is too thin to change the average crustal VP∕VS. We note that only one station (AM05)
samples the Masora domain. The crustal thickness (41 ± 2, Figures 3, 4, and 6) and average crustal VP∕VSratio
(1.78) at this station are within the range of values observed for the Antananarivo domain. A gradational Moho discontinuity is also observed in the Masora domain and suggests the presence of mafic underplating. The mafic lower crust contrasts with the predominantly felsic gneisses and magmatites at the surface. Also,
Durrheim and Mooney [1991] considered a mafic underplate to be characteristic of Proterozoic crust, not
Archean crust where it is usually absent. This raises the question when the mafic lower crust has developed in the Antananarivo domain and which process was responsible for it. Several geological events are potential candidates to have caused the mafic underplating of Archean crust. First, several episodes of mafic volcan-ism and plutonvolcan-ism in Neoarchean and Paleoproterozoic times [e.g., Tucker et al., 2014, and references therein] affected the Antananarivo domain and may have contributed to magmatic unterplating of mafic material or deep seated voluminous mafic intrusions within the lower crust. Younger magmatic episodes during the Neoproterozoic produced predominantly felsic intrusions [i.e., Imorona-Itsindro Suite and Maevarano Suites,
Tucker et al., 2014, and references therein]. Although it cannot be ruled out that magmatism associated with
domains (i.e., Ambalavao suites: Androyen, Anosyen, and Ikalamavony and Maevarano suites: Antananarivo and Masora domains) why should an underplating be exclusive for the Antananarivo domain? Therefore, we assume that the high-velocity layer below the Antananarivo domain was underplated early during the Proterozoic period. Intrusions into the Archean lower crust could explain its higher velocity compared to the neighboring Proterozoic areas. Despite the fact that the Masora domain appears to have been relatively undis-turbed by the Proterozoic events [eg. Collins, 2006, and reference therein], the Imorona-Itsindro suite is also found there [e.g., Tucker et al., 2014]. Thus, the Imorona-Itsindro magmatism could also be responsible for the underplating in the Masoara domain.
Alternatively, the mafic underplating could have been formed or augmented by the volcanic episode near the time of breakup from India-Seychelles. Although, the Cretaceous volcanic formations are best preserved along the eastern coast [Storey et al., 1995], the presence of Cretaceous volcanic rocks in other places suggests a much wider influence [de Wit, 2003]. Although Cretaceous volcanics are mostly limited to a narrow strip along the coast [Storey et al., 1995] with no exposures in the Antananarivo and Masora domains, it is known from seismic surveys of crustal thickness variations near active hot spots that the underplating often extends well beyond the surface expression of volcanism [e.g., Watts and Ten Brink, 1995].
5.1.4. Cretaceous Volcanics: Eastern Coast
The highest VP∕VSratios are found in the Cretaceous volcanics along the Eastern coast, with VP∕VSratios of 1.80–1.98. To check the accuracy of this high value of VP∕VS, we performed several tests described in Text S3. The average VP∕VSratio for the entire crust and the upper crust are similar, suggesting that the VP∕VSratio is very high throughout the crust there. Taking into account the uncertainties of the measurement and focusing on the average, the observed VP∕VSratio indicates the pervasive presence of mafic rocks such as basalt, whose
VP∕VSratio has been measured as 1.85 ± 0.05 [Christensen, 1996]. Alternatively, the presence of anomalous temperatures could also explain the presence of high VP∕VSratios. In fact, low-velocity zones are observed in the midcrust for some of the stations in the volcanics (Figure 6). This may suggest the presence of partial melting. However, after the Cretaceous volcanic episode, no recent volcanic activity occurred in this part of Madagascar, making the presence of significant quantities of partial melt in the crust may be less plausible. The crustal thickness along the eastern coast is ∼10 km thinner than the crust in the Precambrian shield. The volcanics along the eastern coast of Madagascar relate to the separation between Madagascar Seychelle-India in the Late Cretaceous [Storey et al., 1995, 1997]. Isotopic analysis from rocks around Mananjary (near profile marker B in Figures 1 and 3) suggests that mantle plumes may have played an important role in flood basalt formations [Storey et al., 1995, 1997]. We assume that the thin crust at the eastern coast of Madagascar is related to the crustal extension that took place during the continental breakup. This would also explain the abrupt change of crustal thickness between the Precambrian shield and the volcanics along the east coast.
5.2. Comparison of the Crustal Structure in the Precambrian Shield With That of Eastern Africa and Southern India
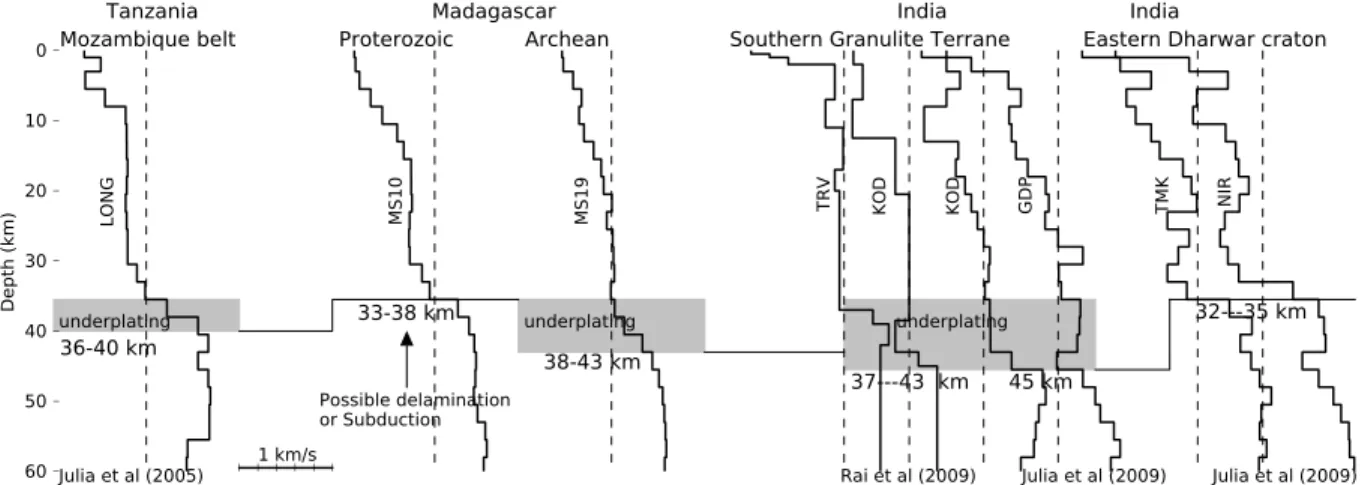
The Archean and Proterozoic domains in southern Madagascar were juxtaposed and affected by the Pan-African orogeny and Mozambique continental collision [e.g., Dissanayake and Chandrajith, 1999; Kröner, 1977; Paquette et al., 1994]. We therefore take this opportunity to compare the crustal structure in southern Madagascar with the crustal structure in eastern Africa, which also has been influenced by the Pan-African orogeny. Julià et al. [2005] studied the crustal structure in the Mozambique belt using the joint inversion of receiver function and Rayleigh surface wave dispersion. They found a crustal thickness between 36 and 40 km with shear wave velocity of 4.1 km/s at the bottom of crust and suggested a 2–4 km thick mafic lower crust beneath the Mozambique belt (Figure 8). The VP∕VSratio in the Proterozoic domains obtained in our study is comparable to that of the Mozambique belt [Tugume et al., 2012]. However, the crustal structure in Proterozoic areas in southern Madagascar differs from the Mozambique belt in that the Malagasy crust lacks a mafic lower crust. The crustal thickness (35–36 km at most stations) in the Proterozoic Androyen and Anosyen domains is at the low end of what was observed in the Mozambique belt, with the underplated layer accounting for most of the difference in crustal thickness, though (Figure 8).
The pre-Gondwana relation of the Antananarivo domain has been debated controversially in the recent literature; therefore, a comparison of its crustal structure with formerly adjacent fragments of Gondwana is of great interest. Several reconstructions of the Gondwana assembly suggest that the Antananarivo domain collided with the Indian Dharwar Craton [e.g., Agrawal et al., 1992] and was later affected by the Pan-African orogeny. This interpretation has been supported by studies that emphasized the similarity
Figure 8. Crustal structure from the joint inversion of receiver function and surface wave dispersion in Tanzania, Madagascar, and India. Dashed vertical line
marks the velocity of 4.0 km/s.
between tectonothermal history [e.g., Ghosh et al., 2004] and rock composition [e.g., Tucker et al., 1999] of the Archean crust (Antananarivo and Antongil domains) and the Precambrian Dharwar craton of India. However, others consider the Antananarivo domain as an individual terrane (named Azania by Collins and
Pisarevsky [2005]) with African affinities [e.g., Kröner, 1977; Collins, 2000; Collins and Windley, 2002]. The crustal
structure in India is well known from the joint inversion of receiver functions and Rayleigh surface wave dispersions [Julià et al., 2009]. The crust in the Antananarivo domain (38–43 km) is relatively thicker com-pared to the crust (32–35 km) (Figure 8) of the Eastern Dharwar Craton that—according to Tucker et al. [2014]—can be considered as the eastern equivalent to the Antananarivo domain rimming the former core of the Antongil-Masora-Western Dharwar craton as part of the former Greater Dharwar craton. Using H-𝜅 stack-ing and joint inversion, Rai et al. [2009] have investigated crustal structure in many places that have been affected by the Pan-African orogeny. They typically observed crustal thicknesses between 37 and 43 km and
VP∕VSratios from 1.66 to 1.75. The observed crustal structure beneath the Antananarivo domain is similar to
what has been found by Rai et al. [2009] (Figure 8). The characteristic of the lower crust, i.e., average S wave velocity ∼4.1 km/s and thicknesses ∼22 km are also comparable to their results. From the joint inversion results, Julià et al. [2009] found a crustal thickness of ∼45 km in the place that was affected by the Pan African Orogeny in southern India (Figure 8).
6. Conclusions
The crustal structure in southern Madagascar was investigated using different seismological methods. We obtained crustal thickness and VP∕VSratios by receiver functions and a more detailed crustal model by jointly
inverting the receiver functions and Rayleigh surface dispersions. The Moho depths estimated from the different methods are comparable along the main profile (Figure S11).
Our findings suggest a different crustal evolution for the different geological units in southern Madagascar. The Morondava basin has 3–10 km thick sediments at the top of the crust. Most of the lower crust has been removed below the western Morondava basin during Jurassic rifting and breakup, while there is 6–10 km of middle to lower crust left below the Carboniferous-Jurassic Karoo sediments.
The observed crustal structure in the Precambrian shield in southern Madagascar differs from typical Archean-Proterozoic crust. Here the Archean crust (Antananarivo and Masora domains) is thicker (38–43 km) than the Proterozoic crust (33–38 km, Ikalamavony, Anosyen, and Androyen domains). Assuming that
Vs> 3.9 km/s is an indicator of the transition of the felsic to intermediate-mafic lower crust [Rudnick and Fountain, 1995; Rudnick and Gao, 2003], our observations suggest the absence (Androyen and Anosyen
domains) or only minor contribution (Ikalamavony domain) of mafic lithologies in the lower crust of Proterozoic domains, which is also consistent with the sharp Moho discontinuity seen under the Proterozoic crustal domains. This is at odds with the global expectation of Durrheim and Mooney [1994]. It is not clear whether these domains were once underlain by a mafic lower crust that was delaminated postdating the Pan-African orogeny. Crustal extension postdating the Pan-African orogeny, however, can be inferred either
as the result of crustal delamination and/or orogenic/gravitational collapse leading to the relatively thin crust. In contrast, a mafic lower crust is actually present in the Antananarivo domain (Archean crust), opposite to
Durrheim and Mooney [1994]’s hypothesis. We suggest that the Malagasy Archean might have been
under-plated during the Proterozoic in the course of extensive magmatic events.
Below the Cretaceous volcanics along the east coast, the entire crust in this area appears to have a very high
VP∕VSratio. Partial melting is hinted at by the low-velocity zones in some of the models, but not all stations
show this, such that the reason for the high VP∕VSratios could not be confirmed.
References
Abbott, D. H., W. D. Mooney, and J. A. VanTongeren (2013), The character of the Moho and lower crust within Archean cratons and the tectonic implications, Tectonophysics, 609, 690–705.
Agrawal, P., O. Pandey, and J. Negi (1992), Madagascar: A continental fragment of the paleo-super Dharwar craton of India, Geology, 20(6), 543–546.
Andriamarofahatra, J., H. De La Boisse, and C. Nicollet (1990), Datation u-pb sur monazites et zircons du dernier épisode tectono-métamorphique granulitique majeur dans le Sud-Est de Madagascar, C. R. Acad. Sci. Paris, 310(2), 1643–1648.
Artemieva, I. M., and H. Thybo (2013), Eunaseis: A seismic model for Moho and crustal structure in Europe, Greenland, and the North Atlantic region, Tectonophysics, 609, 97–153.
Bardintzeff, J.-M., J.-P. Liégeois, B. Bonin, H. Bellon, and G. Rasamimanana (2010), Madagascar volcanic provinces linked to the Gondwana break-up: Geochemical and isotopic evidences for contrasting mantle sources, Gondwana Res., 18(2), 295–314.
Barruol, G., K. Sigloch, and RHUM-RUM group (2012), RHUM-RUM experiment, 2011-2015, code YV (Réunion Hotspot and Upper Mantle - Réunion’s Unterer Mantel), Seismic Network, doi:10.15778/RESIF.YV2011.
Bensen, G., M. Ritzwoller, M. Barmin, A. Levshin, F. Lin, M. Moschetti, N. Shapiro, and Y. Yang (2007), Processing seismic ambient noise data to obtain reliable broad-band surface wave dispersion measurements, Geophys. J. Int., 169(3), 1239–1260.
Besairie, H., and M. Collignon (1971), Géologie de Madagascar: Les terrains sédimentaires, Imprimerie Nationale, Antananarivo. Birch, F. (1961), The velocity of compressional waves in rocks to 10 kilobars: 2, J. Geophys. Res., 66(7), 2199–2224.
Blakely, R. J. (1996), Potential Theory in Gravity and Magnetic Applications, Cambridge Univ. Press, Cambridge, U. K.
Boast, J., and A. Nairn (1982), An outline of the geology of Madagascar, in The Ocean Basins and Margins, pp. 649–696, Springer, New York. Boger, S. D., C. Ferreira, W. Hirdes, B. Schulte, T. Jennet, and R. Dallwig (2008a), Carte geologique de Madagascar 1: 500 000, feuilles
n∘10 – Fianarantsoa, Ministère de l’Energie et des Mines, Project de Gouvernance des Ressources Minérales, Antananarivo. Boger, S. D., C. Ferreira, W. Hirdes, B. Schulte, T. Jennet, and R. Dallwig (2008b), Carte geologique de Madagascar 1: 500 000, feuilles
n∘11-Ampanihy, 12-Tôlanaro, Ministère de l’Energie et des Mines, Project de Gouvernance des Ressources Minérales, Antananarivo. Boger, S. D., C. Ferreira, W. Hirdes, B. Schulte, T. Jennet, and R. Dallwig (2008c), Carte geologique de Madagascar 1: 500 000, feuilles n∘7
–Morondava, Ministère de l’Energie et des Mines, Project de Gouvernance des Ressources Minérales, Antananarivo.
Boger, S. D., W. Hirdes, C. Ferreira, B. Schulte, T. Jenett, and C. Fanning (2014), From passive margin to volcano-sedimentary forearc: The Tonian to Cryogenian evolution of the Anosyen domain of southeastern Madagascar, Precambrian Res., 247, 159–186. Boger, S. D., W. Hirdes, C. Ferreira, T. Jenett, R. Dallwig, and C. Fanning (2015), The 580–520 Ma Gondwana suture of Madagascar and its
continuation into Antarctica and Africa, Gondwana Res., 28(3), 1048–1060.
Christensen, N. (1996), Poisson’s ration and crustal seismology, J. Geophys. Res., 101, 3139–3156.
Coffin, M. F., and P. D. Rabinowitz (1988), Evolution of the Conjugate East African-Madagascan Margins and The Western Somali Basin, 78 pp., Geol. Soc. Am. Spec. Pap. 226, Boulder, Colo.
Collins, A. (2000), The tectonic evolution of Madagascar: Its place in the East African Orogen, Gondwana Res., 3(4), 549–552. Collins, A. S. (2006), Madagascar and the amalgamation of central Gondwana, Gondwana Res., 9(1), 3–16.
Collins, A. S., and S. A. Pisarevsky (2005), Amalgamating eastern Gondwana: The evolution of the circum-Indian orogens, Earth Sci. Rev., 71(3), 229–270.
Collins, A. S., and B. F. Windley (2002), The tectonic evolution of central and northern Madagascar and its place in the final assembly of Gondwana, J. Geol., 110(3), 325–339.
Dewey, J. F. (1988), Extensional collapse of orogens, Tectonics, 7(6), 1123–1139.
de Wit, M. J. (2003), Madagascar: Heads it’s a continent, tails it’s an island, Annu. Rev. Earth Planet. Sci., 31(1), 213–248.
de Wit, M. J., S. A. Bowring, L. D. Ashwal, L. G. Randrianasolo, V. P. Morel, and R. A. Rambeloson (2001), Age and tectonic evolution of Neoproterozoic ductile shear zones in southwestern Madagascar, with implications for Gondwana studies, Tectonics, 20(1), 1–45. Dissanayake, C., and R. Chandrajith (1999), Sri Lanka-Madagascar Gondwana linkage: Evidence for a Pan-African mineral belt, J. Geol., 107(2),
223–235.
Durrheim, R. J., and W. D. Mooney (1991), Archean and Proterozoic crustal evolution: Evidence from crustal seismology, Geology, 19(6), 606–609.
Durrheim, R. J., and W. D. Mooney (1994), Evolution of the Precambrian lithosphere: Seismological and geochemical constraints, J. Geophys. Res., 99(B8), 15,359–15,374.
Dziewonski, A. M., and D. L. Anderson (1981), Preliminary reference earth model, Phys. Earth Planet. Inter., 25(4), 297–356. Efron, B., and R. Tibshirani (1990), Statistical Data Analysis in the Computer Age, Dep. of Stat., Univ. of Toronto, Toronto, Canada. Fontaine, F. R., H. Tkalˇci´c, and B. L. Kennett (2013), Imaging crustal structure variation across southeastern Australia, Tectonophysics, 582,
112–125.
Fourno, J.-P., and J. Roussel (1994), Imaging of the Moho depth in Madagascar through the inversion of gravity data: Geodynamic implications, Terra Nova, 6(5), 512–519.
Geiger, M., D. N. Clark, and W. Mette (2004), Reappraisal of the timing of the breakup of Gondwana based on sedimentological and seismic evidence from the Morondava basin, Madagascar, J. Afr. Earth Sci., 38(4), 363–381.
GEOFON Data Centre (1993), Geofon seismic network. [Available at http://dx.doi.org/10.14470/TR560404.]
Ghosh, J. G., M. J. de Wit, and R. Zartman (2004), Age and tectonic evolution of Neoproterozoic ductile shear zones in the southern granulite terrain of India, with implications for Gondwana studies, Tectonics, 23, TC3006, doi:10.1029/2002TC001444.
Giese, J., A. Berger, G. Schreurs, and E. Gnos (2011), The timing of the tectono-metamorphic evolution at the Neoproterozoic-Phanerozoic boundary in central southern Madagascar, Precambrian Res., 185(3), 131–148.
Acknowledgments
We thank Steve Boger and Stewart Fishwick for providing construc-tive comments and suggestions in their reviews and Associate Editor Martha Savage for additional careful reading of the manuscript. We would like to acknowledge the Geophysical Instrument Pool Potsdam (GIPP) for supplying the instruments for the SELASOMA project and GeoForschungsZentrum (GFZ) for supporting the field experiment. The data are archived at the GEOFON data center (http://geofon.gfz-potsdam.de) and will be opened in 2018. The five RHUM-RUM (http://www.rhum-rum. net) broadband instruments were provided by the French CNRS-INSU/ SISMOB pool, and the funding was provided by ANR (Agence Nationale de la Recherche, project ANR-11-BS56-0013). The RHUM-RUM data are hosted and served by the French RESIF data center (http://seismology.resif.fr) and will be freely available by the end of 2017. We thank Michael Wysession for let-ting us access restricted MACOMO data, which are archived at the IRIS DMC (http://www.iris.edu). We are very grateful to all fieldwork partici-pants from Institute and Observatory of Geophysics Antananarivo, GFZ, and the University of Frankfurt. E. Rindraharisaona is supported by the DAAD (Deutscher Akademischer AustauschDienst) and Alexander von Humboldt Foundation. The SELASOMA project has been funded by the DFG.
![Figure 1. Simplified geological map of southern Madagascar [after Boger et al., 2008a, 2008b, 2008c; Martelat et al., 2000; Roberts et al., 2012; Tucker et al., 2011] and distribution of the seismic stations used in this work](https://thumb-eu.123doks.com/thumbv2/123doknet/14721490.570417/3.918.257.864.131.744/simplified-geological-southern-madagascar-martelat-roberts-distribution-stations.webp)
![Figure 7. Cross section along the main profile AB. (top) Elevation (yellow), observed Bouguer anomaly [Fourno and Roussel, 1994] (green) and computed Bouguer anomaly (cyan)](https://thumb-eu.123doks.com/thumbv2/123doknet/14721490.570417/13.918.65.862.192.947/figure-profile-elevation-observed-bouguer-roussel-computed-bouguer.webp)