HAL Id: hal-00296105
https://hal.archives-ouvertes.fr/hal-00296105
Submitted on 11 Jan 2007
HAL is a multi-disciplinary open access
archive for the deposit and dissemination of
sci-entific research documents, whether they are
pub-lished or not. The documents may come from
teaching and research institutions in France or
abroad, or from public or private research centers.
L’archive ouverte pluridisciplinaire HAL, est
destinée au dépôt et à la diffusion de documents
scientifiques de niveau recherche, publiés ou non,
émanant des établissements d’enseignement et de
recherche français ou étrangers, des laboratoires
publics ou privés.
through the nocturnal boundary layer
S. S. Brown, W. P. Dubé, H. D. Osthoff, D. E. Wolfe, W. M. Angevine, A. R.
Ravishankara
To cite this version:
S. S. Brown, W. P. Dubé, H. D. Osthoff, D. E. Wolfe, W. M. Angevine, et al.. High resolution vertical
distributions of NO3 and N2O5 through the nocturnal boundary layer. Atmospheric Chemistry and
Physics, European Geosciences Union, 2007, 7 (1), pp.139-149. �hal-00296105�
www.atmos-chem-phys.net/7/139/2007/ © Author(s) 2007. This work is licensed under a Creative Commons License.
Chemistry
and Physics
High resolution vertical distributions of NO
3
and N
2
O
5
through the
nocturnal boundary layer
S. S. Brown1, W. P. Dub´e1,2, H. D. Osthoff1,2, D. E. Wolfe1, W. M. Angevine1,2, and A. R. Ravishankara1,3 1NOAA Earth System Research Laboratory, 325 Broadway, Boulder, CO 80305, USA
2Cooperative Institute for Research in Environmental Sciences, University of Colorado, Boulder, CO 80305, USA 3Department of Chemistry and Biochemistry, University of Colorado, Boulder, CO 80309, USA
Received: 30 August 2006 – Published in Atmos. Chem. Phys. Discuss.: 26 September 2006 Revised: 19 December 2006 – Accepted: 19 December 2006 – Published: 11 January 2007
Abstract. The shallow mixing depth and vertical
stratifica-tion of the lowest levels of the atmosphere at night has impli-cations for the chemistry of nitrogen oxides emitted from the surface. Here we report vertical profiles of NO3, N2O5and O3measured from in-situ instruments on a movable carriage on a 300 m tower. The study offers high-resolution (<1 m) vertical distributions of both NO3and N2O5and shows that the nocturnal mixing ratios of these compounds vary widely over short vertical distance scales (10 m or less). Further-more, there are systematic differences in the steady state life-times of NO3and N2O5and in the partitioning among nitro-gen oxides between different near-surface layers. These dif-ferences imply that NO3and N2O5occupy distinct chemical regimes as a function of altitude, potentially serving as sinks for nitrogen oxides and O3near the surface but as reservoirs of NOxand O3aloft.
1 Introduction
Atmospheric nitrogen oxide chemistry near the Earth’s sur-face is strongly linked to the dynamics of the planetary boundary layer. During the day, the typical depth of a sum-mertime convective boundary layer is on the order of 1.5 km, although the depth and the efficiency of mixing may vary (Stull, 1988). Daytime surface emission of NOx(= the sum of NO and NO2, but emitted mainly as NO) are mixed to the boundary layer depth and enter into the well-known catalytic cycle that generates photochemical ozone pollution (Chamei-des, 1978). By contrast, the nocturnal boundary layer has a depth of order 0.1 km and is less efficiently mixed. As a re-sult, nocturnal NOxemissions tend to be more concentrated and vertically stratified than daytime emissions. The strati-fication is coupled to a shift in nitrogen oxide chemistry; at
Correspondence to: S. S. Brown
(steven.s.brown@noaa.gov)
night, NOx is oxidized in the presence of excess ozone to the nocturnal nitrogen oxides, NO3(the nitrate radical) and N2O5(dinitrogen pentoxide), which may serve either as re-active intermediates that convert NOxto nitric acid and other products (Richards, 1983) or as nocturnal reservoirs of NOx and O3(Perner et al., 1985; Brown et al., 2006). Because both the sources and the sinks for NO3and N2O5can be spa-tially stratified, their mixing ratios, and their influence on ni-trogen oxide and ozone transport and loss at night, can show large variability as a function of height above the surface.
Because of this nocturnal atmospheric chemical – dy-namical coupling, the vertical distribution of nitrogen ox-ide species at night, particularly NO3, has been a topic of considerable recent interest. Modeling studies have consis-tently suggested strong vertical gradients of NO3and N2O5 within the nocturnal boundary layer (Fish et al., 1999; Gal-marini et al., 1997; Geyer and Stutz, 2004a, b; Riemer et al., 2003). Experimental studies with sufficient resolution to confirm these predictions have been sparse, however. Ver-tical profiles of NO3in the troposphere have been retrieved from the time dependence of the NO3absorption spectrum in a slant column of scattered sunlight at sunrise, as solar photolysis removes NO3radicals to progressively lower al-titudes (Aliwell and Jones, 1998; Allan et al., 2002; Coe et al., 2002; Saiz-Lopez et al., 2006; Smith and Solomon, 1990; Smith et al., 1993; von Friedeburg et al., 2002; Weaver et al., 1996). Aside from the work of von Friedeberg et al. (2002) this method has typically had insufficient resolution to deter-mine profiles within the boundary layer, although it has com-monly been used to determine total boundary layer column absorptions. Broadband lidar measurements have also been used to measure the total column abundance of NO3within the boundary layer (Povey et al., 1998). Both of these ap-proaches have shown average boundary layer concentrations of several hundred pptv of NO3, well in excess of typical surface-level NO3mixing ratios. Stutz and coworkers (Stutz et al., 2004; Wang et al., 2006) have more recently achieved
19
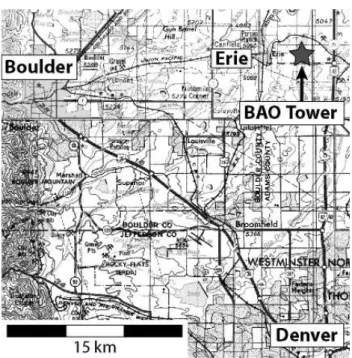
Fig. 1. Map of the Denver-Boulder area (Colorado, USA) showing
the location of the Boulder Atmospheric Observatory (BAO).
a resolution of several tens of meters within the boundary layer for continuous measurements of NO3, NO2, O3 and other trace gases throughout the night via multiple long path differential optical absorption spectrometers (DOAS) aligned over several fixed slant paths between 0–140 m. These mea-surements have shown significant gradients in NO3 within the nocturnal boundary layer.
This paper presents results from a study of the vertical dis-tribution of the nocturnal nitrogen oxides, NO3and N2O5, at high spatial resolution (<1 m) within and above the nocturnal boundary layer. Mixing ratios of both NO3and N2O5were measured in-situ from an instrument mounted on a movable carriage on a 300 m tower. Although this study is rather lim-ited in scope, encompassing only a single night in October 2004 with a limited set of ancillary data, it is unique both because of its high vertical resolution and because of the di-rect measurement of N2O5 vertical profiles. The ability to independently measure N2O5can be important, not only be-cause of its much larger mixing ratio relative to NO3in high NOxand/or cold environments, but also because of its non-linear dependence on NO2, which can make its calculation from column measurements of NO3and NO2under condi-tions of high spatial variability potentially problematic. The study shows that NO3, N2O5, NO2 and O3 are quite vari-able over short distance scales within the nocturnal boundary layer and that there are systematic and often sharp changes at the interface between the nocturnal boundary layer and the residual, daytime boundary layer above it. The results are broadly consistent with the expected behavior of NO3 and N2O5from previous experimental and theoretical studies, but
show that the detailed vertical profiles of these compounds, at least at this measurement site, can be quite complex.
2 Experimental
The measurements took place at the Boulder Atmospheric Observatory (BAO) (Hahn, 1981; Kaimal and Gaynor, 1983; Vanvalin and Ganor, 1987) located in Erie, CO, USA on the night of 4–5 October 2004. Figure 1 is a map of the Boul-der/Denver area showing the location of the observatory in relation to these cities (Boulder 25 km to the West, Denver 35 km to the South). The site is in an area of mixed ru-ral/suburban development and is impacted by anthropogenic emissions from the broad urban and suburban area of Col-orado’s front range cities. The area immediately surrounding the observatory is grassland, and the closest large local emis-sion sources include a landfill 3 km to the Southwest and a major highway (Interstate 25) 2 km to the East. The city of Erie, with its accompanying recent suburban development, is 3.5 km to the West.
The tower itself is 300 m in height, with its base at 1584 m above sea level. It has a motorized external carriage that can ascend or descend the tower at a rate of ∼0.6 m s−1. The carriage can also be positioned indefinitely at an arbitrary height. The drive on the carriage is electric and does not pro-duce emissions that we are aware of or that were detectable by the instruments during this study. There are meteorolog-ical stations at fixed heights of 10, 50, 100, 200 and 300 m, although not all of them were working properly at the time of this study.
In-situ measurements of NO3and N2O5were carried out using a instrument based on cavity ring-down spectroscopy that had been designed for deployment on the NOAA P-3 aircraft (Dub´e et al., 2006). This instrument had a time res-olution of 1 s (vertical resres-olution of 0.6 m for this study), detection sensitivity of 0.4–2 pptv, and an accuracy of 25%, limited mainly by uncertainties in the inlet transmission effi-ciency of the two compounds. The instrument measures NO3 by direct absorption at 662 nm (pulsed dye laser) in an am-bient channel and the sum of NO3and N2O5simultaneously in a second, heated channel using the same light source. The instrument was mounted directly to the carriage, with the air sample introduced through a 40 cm length of PFA Teflon tub-ing. Mixing ratios of O3were measured at lower time resolu-tion (18 s) from the same inlet using a commercial O3 moni-tor (total uncertainty = 2%±2 pbbv). A thermocouple probe located at the tip of the inlet provided a continuous ambient temperature measurement. The mixing ratio of NO2was not measured, but may be calculated from the ratio of N2O5to NO3and the ambient temperature.
[NO2]calc=
[N2O5]
Keq(T) × [NO3]
20
Fig. 2. Time series of the measured mixing ratios of NO3 (×5), N2O5 (top graph) and ozone (bottom graph). The altitude de-rived from the pressure measurements appears above the top graph against the right axis. Approximate times of local sunrise and sunset (i.e., solar zenith angle = 90◦at the surface) are marked.
Here Keq(T) is the temperature-dependent equilibrium con-stant for the reversible association of NO2with NO3to form N2O5, taken from the NASA/JPL recommendation (Sander et al., 2003). Previous field studies of this equilibrium in which all three components (i.e., NO2, NO3and N2O5) were measured showed it to be in agreement with the calculated equilibrium to within 30% (Brown et al., 2003b); therefore, this is a reasonable estimate for the uncertainty of the calcu-lated NO2, with the exception of data for which the mixing ratio of NO3was small; no calculated NO2data are reported for an arbitrary threshold of NO3smaller than 3 pptv.
3 Results
The measurement period was from 16:40 on 4 October, or approximately 2 h prior to local sunset, to 08:10 on 5 Octo-ber, approximately 1 h after local sunrise. Figure 2 shows a time series of the measured mixing ratios of NO3, N2O5 and O3, as well as the sample altitude. Peak mixing ratios of NO3and N2O5were 90 pptv and 2 ppbv, respectively, but were uniformly smaller during periods when the carriage was at the bottom of the tower. Mixing ratios were larger earlier in the night under southerly flow than early in the morning, when the flow shifted to westerly. The available meteorolog-ical data at different, fixed heights appears in Fig. 3. There were a total of 37 individual vertical profiles (8–9 min each) that spanned the entire 300 m range of the tower and multiple shorter profiles spanning smaller ranges. Of the 37, 300 m profiles, 27 were during darkness (between sunrise and sun-set). Figure 4 shows 30 of the profiles taken from just prior to
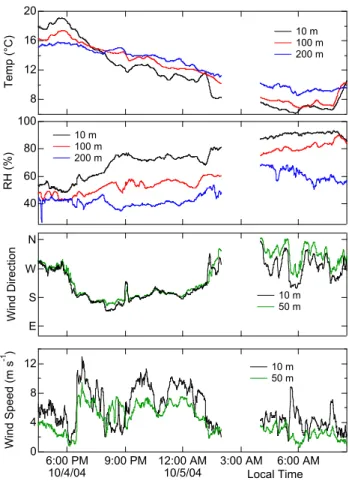
21 20 16 12 8 T e mp (° C ) 10 m 100 m 200 m 100 80 60 40 R H (% ) 10 m 100 m 200 m E S W N W in d D ire ct io n 10 m 50 m 12 8 4 0 W in d Sp e e d (m s -1 ) 6:00 PM 10/4/04 9:00 PM 12:00 AM 10/5/04 3:00 AM 6:00 AM Local Time 10 m 50 m
Fig. 3. Time series of meteorological data at fixed heights on the
tower. Temperature and relative humidity were available from 10, 100 and 200 m, while wind direction and speed were available from 10 and 50 m only.
sunset until just after sunrise. There was considerable vari-ability in both the overall concentrations of NO3and N2O5 between different profiles and in their distribution within in-dividual profiles as a function of altitude. Variations between profiles were in some cases clearly evident even on vertical profiles taken only a few minutes apart. Nevertheless, many of the profiles fell into reasonably distinct categories with similar characteristics. The primary criterion for categoriz-ing profiles was the vertical variation in potential tempera-ture, 2, which is an indicator of static stability and which was taken as a measure of the small-scale stratification and layering.
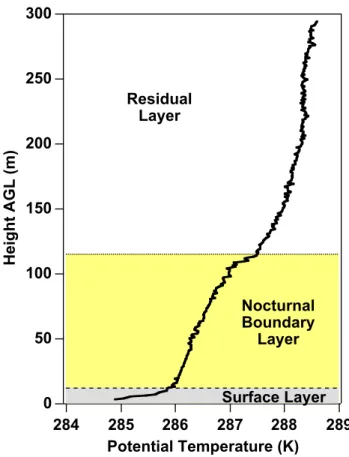
The observations frequently showed a three-layer struc-ture, as shown in more detail Fig. 5. For purposes of this paper, we will use the following terms: the strongly stable layer extending from the surface to ∼20 m will be called the “surface layer”. The statically stable layer above this, up to 100–150 m, is the “nocturnal boundary layer” (NBL). Atop this layer, we commonly observed an increase of stability over 10–20 m, which we will refer to as the “top of the noc-turnal boundary layer”. Although this could be considered
22
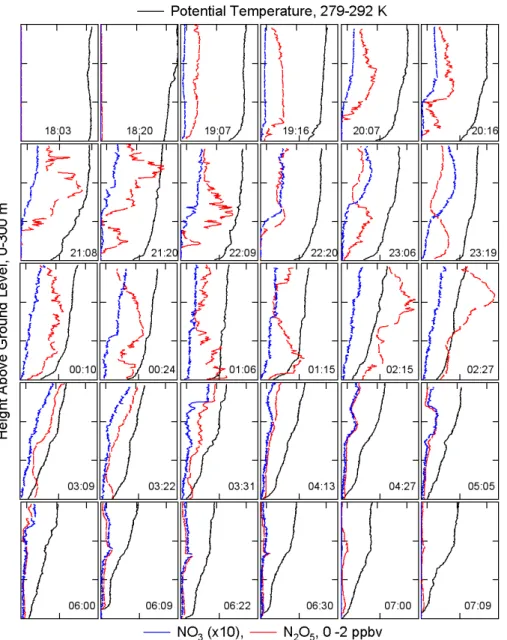
Fig. 4. Overview of 30 profiles from just prior to sunset to just after sunrise on 4–5 October. NO3(blue, multiplied by 10) and N2O5(red) are shown against the bottom axis of each plot against a uniform scale from 0–2 ppbv. Potential temperature (black) is shown against the top axis of each plot on a uniform scale from 279–292 K. The left axes are altitude from 0–300 m. The time on each plot corresponds to the approximate midpoint of the profile.
a separate layer, the chemical observations (see below) indi-cated that this structure functioned as an interface. The up-permost layer, above ∼150 m, is called the “residual layer” (i.e., the remnant of the deeper, well-mixed daytime bound-ary layer). In using this term, we presume that this layer had not been strongly affected by the surface since the previous afternoon.
Each of the sections below contains a discussion of an ex-ample profile, and the last section discusses a composite pro-file made up of several individual propro-files. The discussion here is largely qualitative; the limited set of measurements available for this pilot study does not allow for detailed
anal-ysis or modeling of the chemical sinks for NO3and N2O5or their variation with altitude.
3.1 Example 1: three layer profile
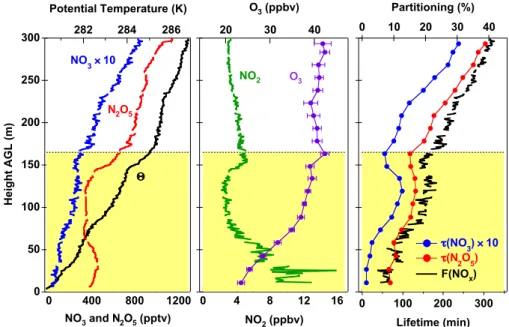
An example of a three layer profile, taken during SSW flow, is shown in Fig. 6. The chemical measurements within this particular profile exhibited a smooth variation within each layer that correlated with the temperature variation in a well-defined manner. The left hand graph shows the vertical pro-file of the NO3and N2O5mixing ratios and the potential tem-perature, 2 (top axis). The potential temperature profile and
layering is the same as that shown in Fig. 5, with a stable surface layer extending to 10–20 m and an NBL extending to 120 m. The mixing ratio of N2O5 decreased rapidly to-ward the ground within the surface layer, consistent with a sink for NO3and N2O5at the ground surface (see discussion below). Within the NBL, N2O5concentrations peaked and then declined with increasing height, while NO3 was rela-tively constant or slightly increasing. These changes imply a vertical gradient of decreasing NO2, whose calculated val-ues are shown in the center graph of Fig. 6. The vertical profiles in NO3, N2O5and calculated NO2were also consis-tent with the observed increase in O3with height within this layer, also shown in the center graph of Fig. 6. A decrease in NO2shifts the equilibrium between NO3and N2O5in favor of NO3while at the same time decreasing the production rate for NO3from the reaction of NO2with O3(i.e., k2[O3][NO2] from Reaction 2, below). By contrast, the increasing O3 con-centration increases the source strength with height.
NO2+O3→NO3+O2 (2)
k2(286 K) = 2.3 × 10⁻¹⁷cm3s−1
The rate coefficient (Sander et al., 2003) is given for the av-erage temperature during darkness on 4–5 October. The in-verse relationship between O3and NO2through the NBL is consistent with emission of NOxnear the surface and conse-quent titration of O3by reaction with NO.
NO + O3→NO2+O2 (3)
k3(286 K) = 1.6 × 10⁻¹⁴cm3s−1
The net increase in NO2 toward the surface was approxi-mately equal to the net decrease in O3, implying that the mixing through the NBL is slow enough relative to the rate of NOx emission to maintain a vertical gradient. Wang et al. (2006) have noted similar behavior in NO2and O3within the NBL.
The vertical gradients in the reactivity of NO3and N2O5 and the partitioning between the nitrogen oxide species can be seen in the right hand panel of Fig. 6. The steady state life-times of NO3and N2O5are the ratios of their observed con-centrations to their source strength (Platt et al., 1984; Heintz et al., 1996; Brown et al., 2003a).
τ (NO3)= [NO3] k2[NO2][O3] ; τ (N2O5)= [N2O5] k2[NO2][O3] (4)
Under conditions where NO3and N2O5achieve an approx-imate steady state between their source and their loss due to reactions of NO3with NO or VOC and/or heterogeneous hydrolysis of N2O5, these lifetimes are a measure of the re-activity of the sum of the two compounds. (Note that the life-times are not separable; sinks for NO3influence the lifetime of N2O5and vice versa.) On this night, the time required for the NO2-NO3-N2O5 system to achieve steady state would have been slow (several hours or more) because of the rela-tively cool temperatures and the large amount of NO2near
the surface (Brown et al., 2003a). Furthermore, Geyer and Stutz (2004a) have argued that vertical transport and mixing of N2O5in the presence of strong vertical gradients can also limit the applicability of steady-state lifetimes. The observed steady state lifetimes were therefore only approximate mea-sures of NO3and N2O5sinks, and were most likely a lower limit to the values that would have been achieved at longer times.
Qualitatively at least, the relative changes in lifetime with height in Fig. 6 are an indication that there was a distinct shift between two regimes in NO3and N2O5reactivity occurring at the top of the NBL, with much shorter steady state life-times within the NBL than in the residual layer. The change occurred over a distance scale of only a few tens of meters. Lifetimes above the boundary layer were as long as 3 h for N2O5, and even this was likely a lower limit (see above). The much smaller lifetimes within the boundary layer were con-sistent with the co-emission of NO3and N2O5sinks with the NOxthat was their source. For example, reactive VOC and aerosol emitted from surface sources are likely to be trapped below the nocturnal inversion. Based on the NO3and N2O5 lifetimes alone, it is not possible to determine which of the two possible loss pathways contributes more to the reactivity of the pair within the boundary layer. Potential loss processes for both are discussed further in Sect. 4.
The partitioning, F(NOx), among the nitrogen oxides is a measure of the proportion of nitrogen oxide stored in the nocturnal reservoir of NO3and N2O5(Brown et al., 2003b).
F(NOx)=
NO3+2 × N2O5 NO2+NO3+2 × N2O5
(5)
The variation of F(NOx) with height in Fig. 6 (right hand graph, top axis) is consistent with the trends in lifetime in the same graph. Within the NBL, where the lifetimes suggest rapid sinks for NO3and N2O5, the partitioning was less than 10%, but increased steadily with height. Similar to the ob-served trend in lifetimes, a step increase occurred at the top of the NBL, with partitioning levels above reaching 35%. Un-der the assumption that there was no mixing of NOxemission from the surface to the residual layer after sunset, numerical integration of NO3and N2O5formation at 50 ppbv of O3 in-dicates a maximum value for F(NOx) (i.e., no loss of NO3or N2O5) of approximately 55%. The observed value of 35% shows that NO3 and N2O5 aloft acted primarily as a reser-voir for NOx, and could be expected to store or transport a large fraction of the available NOxuntil sunrise. Because of the lack of ancillary measurements, determination of the fate of the NOxthat was lost aloft is not possible (see discussion). For example, HNO3formed via N2O5hydrolysis would most likely be lost to deposition after the breakup of the noctur-nal boundary layer after sunrise, while organic nitrate formed from NO3+VOC reactions would potentially be longer-lived. Within the boundary layer, the apparently faster reactivity of NO3 and N2O5 inferred from the lifetimes, and the slower oxidation of NO2by the reduced O3level prevented storage
23 300 250 200 150 100 50 0 H e ig h t A G L (m ) 289 288 287 286 285 284 Potential Temperature (K) Surface Layer Nocturnal Boundary Layer Residual Layer
Fig. 5. Representative nocturnal potential temperature profile with
labels for the most commonly observed layers, as described in the text.
of a significant fraction of NO2in the nocturnal nitrogen ox-ide reservoir. Within this layer, NO3 and N2O5 appear to have served as sinks, rather than reservoirs, for NOx.
3.2 Example 2: two layer profile
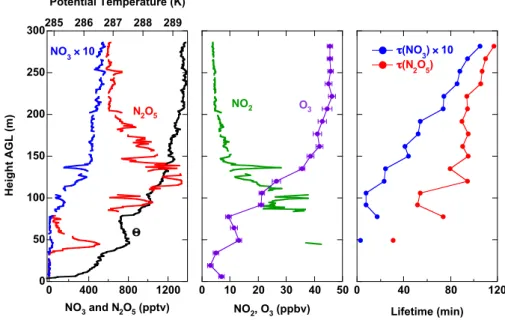
Although the surface layer was a common feature in many of the potential temperature profiles, it was absent in 6 of 12 profiles taken late in the night, between 02:30 and sunrise. In these profiles, the NBL extended continuously down to the lowest measurement height (3 m above ground). Figure 7 shows an example of one such profile. The only clear feature in the temperature profile was a layer of greater stability at 165 m, taken as the top of the NBL. Mixing ratios of NO3and N2O5were somewhat variable within this layer, but were not clearly systematic with height. Within the residual layer, by contrast, both increased systematically with height. Profiles of calculated NO2 and measured O3 were similar to those seen in Fig. 6, showing increasing NO2and decreasing O3 toward the surface within the NBL. The total amount of NOx was smaller in this profile, consistent with a wind shift to the West and Northwest that took place later in the night. The trends in the steady state lifetimes and in partitioning in the right hand graph were similar to those in Fig. 6, with larger
values in the residual layer than in the boundary layer. How-ever, the transition between the two regimes was much less abrupt. Above the boundary layer, the increase in lifetimes and partitioning was continuous, with a maximum τ (N2O5) of 5 h (likely a lower limit) and F(NOx) in excess of 40% at the maximum height of 300 m above ground. The partition-ing value is slightly more than half of the maximum possible (see preceding section), calculated in this case to have been 70–75%. The upward trend with height suggests that above the tower these values may have continued to increase.
3.3 Example 3: multiple layer profile
The profiles in Figs. 6–7 show relatively smoothly vary-ing changes in temperature and chemical composition with height. There were also several profiles in which this was not the case, as shown by the example in Fig. 8. This pro-file showed the same shallow surface layer seen in Fig. 6. In this case, however, there were at least two additional lay-ers within the first 100 m above ground. The mixing ratio of N2O5showed large spatial variability that correlated with the changes in the temperature profile. The N2O5 profile, and the NO2profile inferred from it, both indicate that there may have been additional layering correlated to some of the smaller features in the temperature profile (e.g., sharp spike near 140 m). The O3profile was also more variable below ap-proximately 150 m than in the preceding examples, although the time resolution of this measurement was not sufficient to capture fine-scale structures correlated with the variations in N2O5. The variable O3levels below 150 m and relatively constant O3levels above may indicate that this was the height to which surface emission had been recently mixed, even though the temperature profile did not show a clear stable layer at this point.
The lower time resolution of the O3measurement, and the lack of calculated NO2within the lowest part of the profile due to values of NO3below the detection limit (making the ratio of N2O5to NO3unmeasurable), made it impossible to assess the correlation of the steady state lifetimes in the right hand graph with the temperature and chemical fluctuations seen in the other profiles. However, as with all of the pre-ceding examples (and indeed, as with every profile for which lifetimes could be calculated), the lifetimes showed a clear increasing trend with height. Above 90 m in Fig. 8, the life-times appear to show a relatively smaller degree of layer-ing and/or stratification than do the levels of NO3, N2O5and NO2. This may imply that even though the NOxoccurred in relatively discrete layers, the sinks for NO3and N2O5varied more smoothly with height above the surface.
3.4 Profile averages
The averages of the 23 individual profiles recorded between 19:00 (approximately 20 min after sunset) and 06:00 (ap-proximately 1 h prior to sunrise) appear in Fig. 9. The two
24 800 600 400 200 0 NO3 and N2O5 (pptv) 300 250 200 150 100 50 0 H e ig h t A G L (m ) 287.5 285.0 Potential Temperature (K) NO3 ! 10 N2O5 " 400 300 200 100 0 Lifetime (min) 40 30 20 10 0 Partitioning (%) #(NO3) x 10 #(N2O5) F (NOx) 50 40 30 20 10 0 NO2, O3 (ppbv) O3 NO2
Fig. 6. Left: Profile of NO3and N2O5(bottom axis), and potential temperature (top axis) as a function of height above ground level (AGL) from 23:15–23:23 on 4 October 2004. Note that the NO3mixing ratio has been multiplied by a factor of 10 to display it on the same scale with N2O5. Center: Vertical profiles of O3(measured at 18 s time resolution) and NO2, calculated from the measured NO3, N2O5and temperature according to Eq. (1). Right: Profile of NO3and N2O5lifetimes (bottom axis) calculated according to Eq. (4) (with τ (NO3) multiplied by 10) and partitioning, F(NOx) (top axis) from Eq. (5). The horizontal lines and color coding indicate the layer assignments according to the scheme shown in Fig. 5.
25 1200 800 400 0 NO3 and N2O5 (pptv) 300 250 200 150 100 50 0 H e ig h t A G L (m ) 286 284 282 Potential Temperature (K) NO3 ! 10 N2O5 " 16 12 8 4 0 NO2 (ppbv) 40 30 20 O3 (ppbv) O3 NO2 300 200 100 0 Lifetime (min) 40 30 20 10 0 Partitioning (%) #(NO3) ! 10 #(N2O5) F(NOx)
Fig. 7. Same as Fig. 6, except for a profile from 03:05–03:14. Note that O3is displayed against the top axis in the center graph in this figure. The layering color scheme is the same as for Fig. 5, except that the surface layer is absent.
left hand graphs show the average measured NO3, N2O5 and O3mixing ratios and the average potential temperature. Many of the trends discussed above for the individual profiles were also apparent in the averages. The surface layer was a consistent feature and is evident as a sharp decrease in the
average 2 in the lowest few tens of meters. The top of the NBL, on the other hand, was variable between 100–250 m in individual profiles. As a result, the averaged 2 showed a continuous increase with height above the surface layer with-out a characteristic discontinuity. A clearer measurement of
25 289 288 287 286 285 Potential Temperature (K) 300 250 200 150 100 50 0 H e ig h t A G L (m ) 1200 800 400 0 NO3 and N2O5 (pptv) NO3 ! 10 N2O5 " 50 40 30 20 10 0 NO2, O3 (ppbv) O3 NO2 120 80 40 0 Lifetime (min) #(NO 3) ! 10 #(N2O5)
Fig. 8. Same as Fig. 6, except for a profile from 22:05–22:14.
800 600 400 200 0 NO3 and N2O5 (pptv) 285 280 Potential Temperature (K) NO3 ! 10 N2O5 " 30 25 20 15 10 5 0 # (%) # (NO3) # (N2O5) # (O3) 300 250 200 150 100 50 0 H e ig h t A G L (m ) 40 30 20 10 0 O3 (ppbv) O3
Fig. 9. Vertical profiles of averaged O3(left graph) NO3, N2O5and potential temperature (2) (center graph) for 27 profiles between 10 April 2004 19:00–10 May 2004 06:00. The relative standard deviation of NO3, N2O5and O3(see text) are shown in the right graph. The apparently systematic oscillations in the averages are an artifact of the frequency at which zero measurements were taken during vertical ascents and descents.
the average depth of the NBL was evident at 150 m from the O3 measurement. Below this level, average O3 decreased continuously as a result, presumably, of surface emissions of NOxand surface deposition of O3. Average mixing ratios of NO3 and N2O5showed a smoothly-varying, continuous in-crease from the ground up with no obvious signature of the NBL.
The right hand graph of Fig. 9 shows the relative standard deviation (i.e., the quotient of the standard deviation and the average within each 1 m increment from all profiles) in NO3, N2O5and O3with height. The variability in NO3and N2O5 was similar and was smaller aloft than at the surface, showing no trend with height above 150 meters but increasing steadily below 100 m. Within the surface layer, δ(NO3) and δ(N2O5) increased sharply. The trend in O3 variability was similar,
except that δ(O3) was consistently smaller and did not show a sharp increase within the surface layer (possibly as a re-sult of the lower time resolution of the measurement). The larger variability in O3, NO3and N2O5within the NBL com-pared to above it may have been due to variations in a num-ber of factors, including the amount of NOxmixed into the boundary layer, the boundary layer depth or sinks for NO3 and N2O5.
4 Discussion
The temperature profiles and the chemical composition mea-surements are consistent with reduced mixing, stratification and layering in the lowest few hundred meters of the at-mosphere at night. Although the picture was sometimes more complicated, the vertical structures could generally be grouped into the three categories shown in Fig. 5. The lay-ers were associated not only with changes in chemical com-position (i.e., NOx and O3), but also with reactivity of the nocturnal nitrogen oxides, NO3 and N2O5 as inferred from their steady state lifetimes and nitrogen oxide partitioning. Because of the lack of ancillary measurements, it is not pos-sible to definitively identify the nature of the sinks for NO3 and N2O5within the surface and boundary layers. There are several possibilities, including surface deposition, reaction with NO, reaction of NO3with surface-emitted VOC, or an increase in the rate of N2O5hydrolysis near the surface.
Deposition of NO3and N2O5would have been most im-portant within the surface layer because of its shallow mix-ing depth. Assummix-ing a moderately large deposition veloc-ity for NO3and/or N2O5of vd∼1 cm s−1, their lifetime with respect to deposition, τd, within a surface layer of height,
h=10–20 m may be estimated as τd∼hv−1d =15–30 min (We-sely and Hicks, 2000). To our knowledge, deposition veloc-ities for NO3and N2O5have not been measured, and depo-sition losses of these compounds have typically been consid-ered small in comparison to other losses (see, for example, Aldener et al., 2006; Stutz et al., 2004). However, the pres-ence of a shallow surface layer could magnify the importance of deposition. Certainly, vertical gradients in O3arising from dry deposition (e.g., Galbally and Roy, 1980) serve to reduce the production rate for NO3and N2O5from Reaction (2) as a function of height near the ground surface.
Reaction of NO3with NO is often considered to be a more important loss process than deposition near the ground at night because of the emission of NO from either soils or com-bustion sources and the large rate coefficient for this reaction.
NO + NO3→2NO2 (6)
k7(286 K) = 2.7 × 10⁻¹¹cm3s−1
In combination with Reaction (2), Reaction (6) leads only to a net increase in the rate of NO oxidation by O3(Reaction 3) and does not lead to a net loss of nitrogen oxides as do NO3 -VOC reactions or N2O5 hydrolysis. Therefore, surface NO
emissions decrease the impact of NO3and N2O5reactions in nocturnal NOxdestruction. At the BAO site, NO may have come from either soil emission or anthropogenic sources. The flux of NO from grassland in autumn in Colorado has been measured in the range 0.2–1 ng N m−2s−1(Williams et al., 1987). The resulting calculated emission rate into a 20 m surface layer is 0.02–0.1 pptv NO s−1, insufficient to titrate a significant amount of ozone. At a constant, 20 ppbv of O3, the steady state NO concentration resulting from soil emission would have been 3–15 pptv, which would limit the lifetime of NO3to 2–10 min. Emission of NO from nearby anthropogenic sources is likely a far larger NOxsource than are soils at this site, as evident from calculated NO2 concen-trations reaching several tens of ppbv. These anthropogenic NO emissions may also have limited the lifetime of NO3at the BAO site if the transport time from these sources was short enough that NO was not fully oxidized to NO2, or if the NO emission was large enough to chemically titrate all of the O3. For example, the presence of NO may explain the zero NO3 and N2O5concentrations below 30 m in Fig. 8, where the O3mixing ratio was also near zero. Periodic advection of air masses containing large amounts of NO from nearby sources would be consistent with the variability in NO3and N2O5observed below 50 m and is likely to be a large contri-bution to the observed gradients.
Like NO emission, surface emissions of reactive VOC that are trapped in the surface and/or nocturnal boundary layers may give rise to a rapid NO3loss. In contrast to reaction with NO, however, NO3reaction with VOC can lead to a net loss of ozone and/or NOxdepending on the VOC (Atkinson and Arey, 2003). In the absence of VOC measurements, how-ever, an estimate of their contribution to NO3loss within the boundary layer at the BAO site is difficult. Emission of VOC from grassland consists largely of oxygenated VOC that are not reactive toward NO3and are likely not significant at night (Kirstine et al., 1998). Anthropogenic VOC in general are not particularly reactive with NO3, except for specific classes of compounds such as alkenes (Wayne et al., 1991).
Hydrolysis of N2O5is a key reaction in the conversion of NOxto nitric acid or aerosol nitrate at night.
N2O5+H2O (het) → 2HNO3 (7)
The reaction is efficient as a heterogeneous process on aerosol particles. As with NO and VOC, aerosol particle loading (and thus available surface area) is conceivably larger in the NBL than aloft due to trapping of aerosol or aerosol precursor (e.g. ammonia) emissions. Gradients in relative humidity with height above ground may also play a role. Relative humidity at 200 m on 4–5 October ranged between 35–65%, while at 10 m it varied from 60–90%, with an av-erage difference in relative humidity of 29% between these heights during darkness (see Fig. 3). Therefore, hygroscopic particle growth and/or variation in the uptake coefficient for N2O5with relative humidity could plausibly increase its loss
rate to heterogeneous hydrolysis at lower elevations within the NBL.
The preceding discussion demonstrates that the observed variability in NO3and N2O5over short distance scales may result from the interaction between the nocturnal stratifica-tion of the atmosphere and the distribustratifica-tions of an array of potential NO3 and N2O5 sinks. Furthermore, the reactiv-ity of a compound should be directly related to it variabilreactiv-ity on both spatial and temporal scales (Junge, 1974). Previous measurements of NO3and N2O5 at a nearby measurement site (Brown et al., 2003b) showed rapid temporal variation that may have been related to the kind of spatial variability seen in this study. Such small scale variability in sinks is interesting not only from a measurement perspective; it also presents a modeling challenge. The large variability in nitro-gen oxide chemistry over small scales means that an accurate representation requires calculation on extremely fine spatial scale or an accurate parameterization of the integration of small scale variations into larger scale models (Jones et al., 2005; Ravishankara, 2005).
The contrast between nitrogen oxide chemistry in the NBL and residual layers underlines the need for more complete vertical profiling studies involving a larger array of chemical and meteorological measurements. This study has primar-ily illustrated the potential for in-situ chemical measurements from a movable carriage on a tall tower to address this prob-lem. Further measurements at the BAO site that include a larger array of chemical, aerosol and meteorological instru-mentation, carried out over longer periods in different sea-sons, will be of considerable interest.
Acknowledgements. The authors thank W. C. Kuster for the loan of an O3monitor. This work was funded by NOAA’s Air Quality and Climate Forcing Programs.
Edited by: P. Monks
References
Aldener, M., Brown, S. S., Stark, H., et al.: Reactivity and loss mechanisms of NO3and N2O5 in a marine environment: re-sults from in-situ measurements during NEAQS 2002, J. Geo-phys. Res., 111, D23S73, doi:10.1029/2006JD007252, 2006. Aliwell, S. R. and Jones, R. L.: Measurements of tropospheric NO3
at midlatitude, J. Geophys. Res., 103, 5719–5727, 1998. Allan, B. J., Plane, J. M. C., Coe, H., et al.: Observations of NO3
concentration profiles in the troposphere, J. Geophys. Res., 107, 4588, doi:10.1029/2002JD002112, 2002.
Atkinson, R. and Arey, J.: Atmospheric Degradation of Volatile Organic Compounds, Chem. Rev., 103, 4605–4638, 2003. Brown, S. S., Neuman, J. A., Ryerson, T. B., et al.:
Noc-turnal odd-oxygen budget and its implications for ozone loss in the lower troposphere, Geophys. Res. Lett., 33, L08801, doi:10.1029/2006GL025900, 2006.
Brown, S. S., Stark, H., and Ravishankara, A. R.: Applicability of the Steady-State Approximation to the Interpretation of
Atmo-spheric Observations of NO3and N2O5, J. Geophys. Res., 108, 4539, doi:10.1029/2003JD003407, 2003a.
Brown, S. S., Stark, H., Ryerson, T. B., et al.: Nitrogen oxides in the nocturnal boundary layer: Simultaneous, in-situ detection of NO3, N2O5, NO, NO2 and O3, J. Geophys. Res., 108, 4299, doi:10.1029/2002JD002917, 2003b.
Chameides, W. L.: Photo-chemical role of tropospheric nitrogen oxides, Geophys. Res. Lett., 5, 17–20, 1978.
Coe, H., Allan, B. J., and Plane, J. M. C.: Retrieval of ver-tical profiles of NO3 from zenith sky measurements using an optimal estimation method, J. Geophys. Res., 107, 4587, doi:10.1029/2002JD002111, 2002.
Dub´e, W. P., Brown, S. S., Osthoff, H. D., et al.: Aircraft instru-ment for simultaneous, in-situ measureinstru-ments of NO3and N2O5 via cavity ring-down spectroscopy, Rev. Sci. Instr., 77, 034101, 2006.
Fish, D. J., Shallcross, D. E., and Jones, R. L.: The vertical distribu-tion of NO3in the atmospheric boundary layer, Atmos. Environ., 33, 687–691, 1999.
Galbally, I. E. and Roy, C. R.: Destruction of ozone at the earth’s surface, Quart. J. Roy. Meteorol. Soc., 106, 599–620, 1980. Galmarini, S., Duynkerke, P. G., and deArellano, I. V. G.: Evolution
of nitrogen oxide chemistry in the nocturnal boundary layer, J. Appl. Meteorol., 36, 943–957, 1997.
Geyer, A. and Stutz, J.: Vertical profiles of NO3, N2O5, O3, and NOxin the nocturnal boundary layer: 2. Model studies on the altitude dependence of composition and chemistry, J. Geophys. Res., 109, D12307, doi:10.1029/2003JD004211, 2004a. Geyer, A. and Stutz, J.: The vertical structure of OH-HO2
-RO2 chemistry in the nocturnal boundary layer: A one-dimensional model study, J. Geophys. Res., 109, D16301, doi:10.1029/2003JD004425, 2004b.
Hahn, C. J.: A Study Of The Diurnal Behavior Of Boundary-Layer Winds At The Boulder Atmospheric Observatory, Boundary-Layer Meteorology, 21, 231–245, 1981.
Heintz, F., Platt, U., Flentje, J., et al.: Long-term observation of nitrate radicals at the Tor Station, Kap Arkona (R¨ugen), J. Geo-phys. Res., 101, 22 891–22 910, 1996.
Jones, R. L., Ball, S. M., and Shallcross, D. E.: Small scale structure in the atmosphere: implications for chemical composition and observational methods, Faraday Discuss., 130, 165–179, 2005. Junge, C. E.: Residence time and variability of tropospheric trace
gases, Tellus, 26, 477–488, 1974.
Kaimal, J. C. and Gaynor, J. E.: The Boulder Atmospheric Obser-vatory, J. Clim. Appl. Meteorol., 22, 863–880, 1983.
Kirstine, W., Galbally, I., Ye, Y., et al.: Emissions of volatile or-ganic compounds (primarily oxygenated species) from pasture, J. Geophys. Res., 103, 10 605–10 619, 1998.
Perner, D., Schmeltekopf, A., Winkler, R. H., et al.: A Laboratory and Field Study of the Equilibrium N2O5↔NO3+NO2, J. Geo-phys. Res., 90, 3807–3812, 1985.
Platt, U. F., Winer, A. M., Bierman, H. W., et al.: Measurement of Nitrate Radical Concentrations in Continental Air, Environ. Sci. Technol., 18, 365–369, 1984.
Povey, I. M., South, A. M., de Roodenbeke, A. t. K., et al.: A broad-band lidar for the measurement of tropospheric constituent pro-files from the ground, J. Geophys. Res., 103, 3369–3380, 1998. Ravishankara, A. R.: Chemistry-climate coupling: the importance
2005.
Richards, L. W.: Comments on the oxidation of NO2to nitrate – Day and night, Atmos. Environ., 17, 397–402, 1983.
Riemer, N., Vogel, H., Vogel, B., et al.: Impact of the heterogeneous hydrolysis of N2O5on chemistry and nitrate aerosol formation in the lower troposphere under photosmog conditions, J. Geophys. Res., 108, 4144, doi:10.1029/2002JD002436, 2003.
Saiz-Lopez, A., Shillito, J. A., Coe, H., et al.: Measurements and modeling of I2, IO, OIO, BrO and NO3in the mid-latitude ma-rine boundary layer, Atmos. Chem. Phys., 6, 1513–1528, 2006, http://www.atmos-chem-phys.net/6/1513/2006/.
Sander, S. P., Friedl, R. R., Golden, D. M., et al.: Chemical Kinetics and Photochemical Data for Use in Atmospheric Studies, JPL Publication 02-25, Pasadena, CA, 2003.
Smith, J. P. and Solomon, S.: Atmospheric NO3 3. Sunrise Dis-appearance and the Stratospheric Profile, J. Geophys. Res., 95, 13 819–13 827, 1990.
Smith, J. P., Solomon, S., Sanders, R. W., et al.: Atmospheric NO3 4. Vertical Profiles at Middle and Polar Latitudes at Sunrise, J. Geophys. Res., 98, 8983–8989, 1993.
Stull, R. B.: An Introduction to Boundary Layer Meteorology, Kluwer Academic, Dordrecht, The Netherlands, 1988.
Stutz, J., Alicke, B., Ackermann, R., et al.: Vertical profiles of NO3, N2O2, O3, and NOxin the nocturnal boundary layer: 1. Obser-vations during the Texas Air Quality Study 2000, J. Geophys. Res., 109, D12306, doi:10.1029/2003JD004209, 2004.
Vanvalin, C. C. and Ganor, E.: Air-Pollution Measurements At The Boulder-Atmospheric-Observatory, Water Air Soil Pollut., 35, 357–372, 1987.
von Friedeburg, C., Wagner, T., Geyer, A., et al.: Derivation of tropospheric NO3profiles using off-axis differential optical ab-sorption spectroscopy measurements during sunrise and com-parison with simulations, J. Geophys. Res.-Atmos., 107, 4168, doi:10.1029/2001JD000481, 2002.
Wang, S., Ackermann, R., and Stutz, J.: Vertical profiles of NOx chemistry in the polluted nocturnal boundary layer in Phoenix, AZ: I. Field observations by long-path DOAS, Atmos. Chem. Phys., 6, 2671–2693, 2006,
http://www.atmos-chem-phys.net/6/2671/2006/.
Wayne, R. P., Barnes, I., Biggs, P., et al.: The Nitrate Radical: Physics, Chemistry, and the Atmosphere, Atmos. Environ. Part A – General Topics, 25, 1–203, 1991.
Weaver, A., Solomon, S., Sanders, R. W., et al.: Atmospheric NO3 5. Off-axis measurements at sunrise: Estimates of tropospheric NO3at 40◦N, J. Geophys. Res., 101, 18 605–18 612, 1996. Wesely, M. L. and Hicks, B. B.: A review of the current status of
knowledge on dry deposition, Atmos. Environ., 34, 2261–2282, 2000.
Williams, E. J., Parrish, D. D., and Fehsenfeld, F. C.: Determina-tion of Nitrogen Oxide Emissions From Soils: Results from a Grassland Site in Colorado, United States, J. Geophys. Res., 92, 2173–2179, 1987.