Riomod. Technik
L. M. Gallo* P. Bösigcr* Chr.J. Rageth** D. Stucki**
Quantitative Inf ra-Red Thermography to Identify Varicoceles
äs the Cause of Male Infertility
Quantitative Infrarotthermographie zur Identifikation von Varikozelen als Ursache
der männlichen Infertilität
* Institut für Biomedizinische Technik, Universität und , Gloriastraße 35, CH-8092 Zürich ** Universitätsfrauenklinik des Kantonsspitals, Schanzenstraße 46, CH-4031 Basel
Key-words: Infrared thermography, Computer analysis of thermograms, varicocele, male
infertility
Varicocele is recognized äs a possible cause of male infertility. It is known that the size of varicosity does not necessarily correlate with the degree of spermiogenesis impairment; even subclinical varicoceles may reduce fertility. An examination procedure utilizing a computer-assisted thermography System with high resolution has been developed. It involves the deter-mination of quantitative parameters sensitive to characteristic abnormalities of the temperature distributions. The parameters provide a basis for an objective diagnostic classification of the thermograms. A group of 31 male patients suspected of being infertile was thermographically examined. Based on previous clinical findings no varicocele could be diagnosed on 24 patients, whereas 7 showed clinical or subclinical varicoceles. In all cases the diagnosis was confirmed by the thermographic examinations.
Schlüsselwörter: Infrarotthermographie, Computeranalyse von Thermogrammen, Varikozele,
männliche Infertilität
Die Varikozele wird als mögliche Ursache männlicher Infertilität anerkannt. Es ist bekannt, daß die Größe der Varikosität nicht streng mit dem Maß der Beeinträchtigung der Spermiogenese korreliert; auch subklinische Varikozelen können die Fertilität herabsetzen. Basierend auf einem rechnerunterstützten hoch auflösenden Thermographiesystem wurde ein neues Untersuchungs-verfahren entwickelt. Es erlaubt, aus den Thermogrammen quantitative Parameter zu bestim-men, die für Varikozelen charakteristische Unregelmäßigkeiten der Temperaturverteilungen er-fassen. In einer Pilotstudie wurde ein Kollektiv von 31 Patienten thermographisch untersucht, bei denen der Verdacht auf eine Infertilität bestand. Aufgrund der klinischen Untersuchung konnte in 24 Fällen keine Varikozele diagnostiziert werden, während 7 Patienten klinische oder subklinische Varikozelen aufwiesen. In allen Fällen konnte die Diagnose durch die thermo-graphische Untersuchung bestätigt werden.
Introduction
Varicocele can be defined äs pathological dilatation, elongation, and varice-like convolution of the testi-' cular veins that form the pampiniform plexus. In over 90 % of cases the disease is located in the left hemiscro-tum [9] and it occurs most frequently between the age of 15 and 25 [13]. Several studies show that about 10 % of male population is affected [13]. In recent years vari-cocele has been recognized äs a possible cause of sterüity or subfertility [2,10,11,12,15]. As a matter of fact, varicocele is diagnosed in 21 to 39% of the men examined in connection with couple sterility pro-blems [2].
The pampiniform plexus is formed by three vessel groups: the group of the testicular vein (or internal spermatic vein), which runs towards the vena cava beside the testicular artery; the group of the deferential duct vein, which runs parallel to the deferential duct; the group of the cremasteric vein, which is located behind the spermatic cord. These three groups are, interconnected by anastomoses. The right testicular vein enters the vena cava obliquously, below the
junction of the right renal vein and the vena cava, while the left testicular vein enters the left renal vein at a right angle.
Since the temperature of the testes plays an important role in spermiogenesis [l, 2, 8, 14, 15], the male sexual gland is equipped with a sensitive thermoregulative mechanism. The testes maintain their euthermic state in part by means of convective heat loss through the skin. The cremaster muscle regulates heat loss by contracting the scrotal bag more or less, and accordingly changing the exposed skin surface. Furthermore the pampiniform plexus takes part in the thermoregulation by way of a countercurrent heat exchange between the blood in the testicular artery and the testicular vein [15]. In this way the pampiniform plexus precools arterial blood. In fact according to several authors there is a difference of 2.0 to 2.5°C between abdominal and scrotal temperature.
As stated by Ludwig [9] some of the possible causes for the development of a left varicocele (figure 1) are: con-genital or hereditary vessel weakness; defective devel-opment of the cremaster muscle or congenital laxity of
Biomedizinische Technik
Band 30 Heft 11/1985 Quantitative Infra-Red Thermography 285
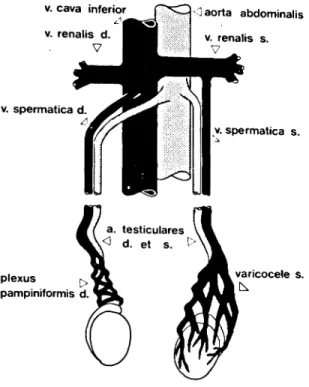
v. cava inferior v. renalis d. V v. spermatica d. plexus pampiniformis d. <] aorta abdominalis v. renalis s. v. spermatica s. varicocele s.
Figure 1. The main vascular System of the testes: only the internal spermatic veins are shown. A left varicocele is present. the scrotum; elevated hydrostatic pressure in the left testicular vein (which is on the average 42 cm long); unfavorable flow conditions at the entrance of the left testicular vein into the left renal vein (right angle), located in front of the suprarenal vein; absence or in-sufficiency of valves in the left testicular vein. In the presence of varicocele, especially in the upright Position of the body, a blood stasis or even a flow inver-sion may occur in the testicular vein, thus causing a congestion in the circulation of the testis. In such situations the venous blood is partially drained through the anastomoses of the testicular vein with the deferen-tial and the cremasteric veins.
The exact mechanism how spermiogenesis is affected by varicocele is not yet fully understood. Hyper-thermia, due to deficient cooling of the testis, seems however to be one of the main reasons [11,15). Another possible cause is that blood stasis entails an insuf f icient removal of metabolites äs well äs a poor supply of hor-mones and nutritive substances [11]. A further hypo-thesis is that a reflux into the testicular vein could transport toxic metabolites from the renal vein to the testis [2].
According to Zorgniotti [14] the temperature dif f erence between euthermic and hyperthermic states seems to be small: it lies between 0.8 and l .2°C. Elevated testis tem-perature is found in persons with poor eemen quality and no palpable varicocele, Also, in such cases there sceme to be a disturbance in the temperature retfulation gysti'm moetly due to a retrograde flow or a «tasis in the
testicular vein [6]. States of this kind are called sub-clinical varicocele. They cannot be diagnosed by con-ventional clinical examinations (e.g. by palpation) and require supplemental methods such äs phlebography [5, 7], ultrasound Doppier examination and quantita-tive telethermography. Phlebography produces de-tailed documentation of the venous vessels, however it necessitates an injection of contrast medium and an undesirable X-ray exposure of the genital region. With commercially available ultrasound Doppier Instru-ments it is difficult to establish a solid basis for a diagnosis. Due to the relationship between blood per-fusion and skin temperature, quantitative telethermo-graphy appears to be a practicable method, all the more äs it offers the advantage of a reliable and more objec-tive overall evaluation.
Thermographic examination technique
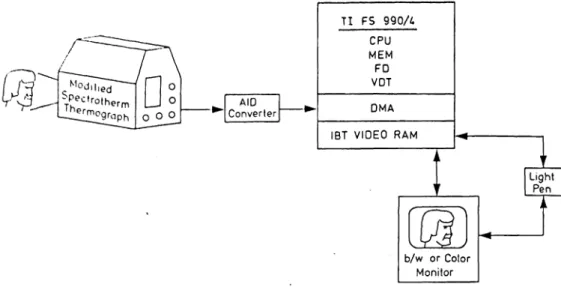
The Computer assisted thermography System used for testis examination was originally developed at the IBTZ (Institute of Biomedical Engineering, University and Federal Institute of Technology, CH-8044 Zürich, Switzerland) for quantitative breast thermography (figure 2) [3, 4]. It consists of a modified Spectrotherm 2000 infrared camera (UTI, Sunnyvale, CA 94086) with digital output and an FS 990/4 TI minicomputer (Texas Instruments, Austin, TX 78769) with a RAM video display memory, a look-up table and a floppy disk äs a recording medium. The thermograms generated have a thermal resolution of 0.1°C. They are composed of 256x256 sampling points quantified in terms of 8 bits. They are temporarily stored in the digital video memory and can be visualized in gray scale or in color on a Standard TV set. A light pen system allows the operator to define interactively regions of interest for quantitative analysis. The equipment is calibrated by means of a blackbody-type temperature reference element enabling absolute skin temperature deter-mination.
Before recording the thermogram, the patient has to adapt for 15 minutes to a standardized room tempe-rature of 21°C in upright position with genitalia exposed and legs sufficiently separatod to allow the scrotum temperature to reach an equilibrium. This procedure is indispensable because it was observed that often major changes in temperature distributions and in absolute mean temperatures of the hemiscrota occur during the adaption.
For each patient, three thermograms are reeordcd: a ventral, a dorsal and a cephalic exposure. Proper patient positioning is achieved by means of a hydraulie platform. For the dorsal view the patient has to bemi forwards and lean on a railing. The infra-tvd camera is brought äs close äs possible to the object (10 - l !> cm for the ventral view and 15-20 cm for the dorsal vicw). to permit maximal spatial resolution The penvs is
TI FS 990A CPU MEM FD VOT DMA IBT V I D E O RAM
Figure 2. Block diagram of the microprocessor-assisted thermography System. CPU - central processor unit; MEM Computer memory; FD floppy disc unit; VDT video terminal; DMA -direct memory access board; IBT VIDEO RAM - display refresh memory developed at the Institute of Biomedical Engineering. The thermograph utilized is a modified Spectrotherm unit, model 2000. It allows for the recording of absolute temperature measurements between 18° C and 56° C with a resolution down to 0.1°C. The infrared radiation emitted from the object is horizontally scanned by a rotating hexagonal mirror. A tilting mirror provides vertical deflec-tion. A Ge-lens focuses the radiation on a HgCdTe detector cooled by liquid nitrogen whose maximum sensitivity lies at wavelengths from 8 to 12 . After preprocessing, the analog detector Signals are digitized and stored in the RAM display memory (2 x 80 kB) from IBT. The scanning and digital mapping time for a füll thermogram is about l sec. Two füll thermograms described by 256x256 sampling points can be simultaneously stored in the display memory board. The temperature in each point is defined with a resolution of 8 bits. In addition the
memory board provides an overlay of 2 bits.
strapped against the abdomen with adhesive tape. Two insulating cuf fs are positioned around the upper thighs to prevent effects of heat radiation and achieve higher contrast.
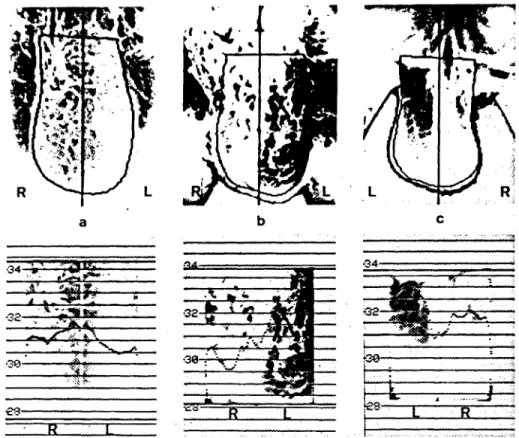
The ventral thermogram of a patient without varicocele is shown in the upper part of figure 4 a. Apart from the hairs and slightly higher temperatures along the raphe the thermal pattern is relatively flat. The raphe consti-tutes a thermal septum. Its elevated temperature is due to the Involution of the scrotal bag and is quantitatively characterized by the average horizontal profile in the lower part of figure 4 a (for an explanation of the Contents of the lower part of picture 4 a see the para-graph »Quantitative evaluation«). Hyperthermic areas can be also observed between scrotum and upper thighs. Figure 4 b illustrates the ventral thermogram of a clinical varicocele. A remarkable diffuse hyperther-mia of the left hemiscrotum, which appears much dar-ker than the right one, is to be noticed. The dorsal view of a subclinical case is shown in figure 4c. A warmer region can be observed only in the upper left quadrant of the scrotum.
Artifacts can be caused by excessive density of pubic hair and by skin folds. Hair acts äs a shield for infra-red radiation and shows other thermic properties than skin does. Accordingly it causes a falsification of the true skin temperature by simulating a lower value. Shaving
would be the best solution to obtain precise thermo-graphic results, but this is not well accepted by patients participating in a research program. Skin folds are usually recognized, so that an experienced operator excludes the corresponding region from the analysis.
Quantitative evaluation
The region to be analyzed in each set of three thermo-grams are interactively defined with the light pen. In each thermogram first a vertical line is set, separating both hemiscrota, then a contour following the edge of the scrotum is drawn (figure 3). The left and right areas are subdivided into two quadrants each. Thus we have two upper and two lower quadrants in the ventral and dorsal views and two anterior and two posterior qua-drants in the cephalic view. The use of a Computer allows not only a quantitative evaluation of the original thermograms, but also a very flexible and effective Management and processing of the picture Contents. In this first study the following parameters that do not require any previous picture processing were intro-duced:
- mean temperature of the left (TML) and of the right (TMR) hemiscrotum surface for the ventral and dorsal views; .
— difference between the left and right mean tempera-tures (TD) for all three thermograms;
Biomedizinische Technik
Band 30 Heft 11/1985 Quantitative Infra-Red Thermography 287
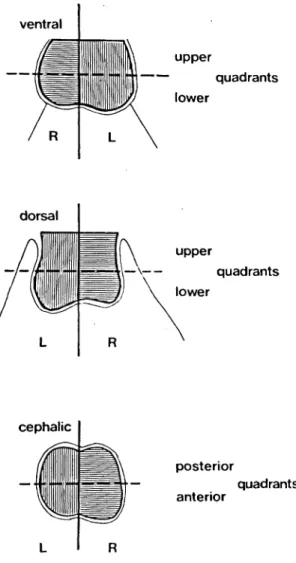
ventral upper quadrants l o wer dorsal upper v— quadrants Iower cephalic posterior anterior quadrants
Figure 3. The three thermographic views of the scrotum. Shaded areas show interactively defined regions of interest. The ventral and the dorsal views are subdivided into left (L) and right (R) upper and Iower quadrants; the cephalic view is subdivided into left and right anterior and posterior
quadrants.
— mean temperature of the upper 10% of the histo-gram of the left (T10L) and the right (T10R) hemi-scrotum for the ventral and dorsal views;
- difference (T10D) between the upper 10% of the histogram of the left and the right hemiscrotum for all three thermograms.
TML and TMR are expected to indicate hyperthermia of one side or of both sides in case of bilateral varicocele and when overall disturbances of the scrotal euthermic state are present. The two parameters are not calcu-lated for the cephalic view, because of the diff iculties in measuring absolute temperature. The additional mirror required to record the cephalic thermogram causes losses in the radiation transmitted to the HgCdTe-detector. These lossc» must be taken into account in determining the absolute temperature by way of an additional calibration procedure, which
renders the diagnostic ef fort more elaborate. TD quan-tifies a diffuse thermal asymmetry and is valuable in case of one sided varicoceles. T10L and T10R were introduced because shaving of the region was con-sistently not carried out. These two parameters are primarily affected by those skin areas which are not overshadowed by hair. As such they can be also inter-preted äs mean temperatures of hot spots that may be present. T10D quantif ies tha asymmetry of the wärmest regions.
The additional parameters introduced require image processing. As it is difficult to judge the thermal asymmetry of two areas that may diff er anatomically in size, shape and position, the two regions are mapped on two adjacent and identical rectangles, äs shown schematically in Figure 5. Examples of such norma-lized scrota are given in the Iower part of figure 4. The mapping procedure constitutes a geometric normaliza-tion in the determinanormaliza-tion of the following parameters which characterize asymmetries in the temperature distribution and certain features of the temperature profiles:
- difference between the left and right mean tempe-ratures of the upper and Iower respectively of the posterior and anterior quadrants (TDSA and TDSB);
— edge-to-edge temperature difference of the linear least square fit of the mean of the temperature pro-files across the two upper and the two Iower qua-drants for the ventral and dorsal thermograms, respectively across the two posterior and the two anterior quadrants for the cephalic thermogram (TFA and TFB) (figure 6).
TFA and TFB reflect a possible temperature gradient from the right to the left of the scrotum. The upper and the Iower parts respectively the posterior and anterior parts of the scrotum are considered separately, because hot-spots do not always occupy the entire hemiscrotum in case of a varicocele (e.g. fig. 4c).
It often happens, especially in the cephalic view, that the regions to be evaluated are rotated with respect to any of the body axes. In such cases it is necessary to rotate the thermograms back into the normal position by means of a mapping process in the form of an inter-polating aigorithm, before the parameters are com-puted.
Typical values of sonie of the parameters introduced are reviewed for the three repräsentative thermograms illustratedinfigure4:
a) The case without varicoeele has mean tempevatuivs on the left and right hemiscrotum TML « 30 8V and TMR - 31.3°C, so that thcir differenee TO is - 0 5 C The greatest temperalure diffeivnce on the aveia>;o profile between the theimal septum and the itfht
hemi-
•30-.R.
Figure 4. Thermograms of the testes with darker areas indicating higher temperatures. Above: unprocessed scrotal thermograms of three different patients; the contours drawn with the light pen are visible. Below: corresponding mapped thermal images; averages of thermal profiles are shown together with absolute temperature scales. Patient (a) has a normal scrotum (ventral view): the thermogram is rather flat, with a slight thermal septum more evident on the overall average of the temperature profiles which never exceeds 32.0°C. Patient (b) has a clinical vari-cocele (ventral view): a pronounced thermal contrast is present; the overall average of the profiles shows a Variation of 3.5°C and the temperature of the quarter farthest to the left is far above 32.0°C. (c) shows the dorsal thermogram of a patient with a subclinical varicocele with initially uncertain diagnosis: a hyperthermic area appears on the left upper quadrant; the average of the
profiles in the upper half of the scrotum is far above 32.0°C.
scrotum is about 0.5°C, whereas the maximum diffe-rence with regard to the left side is about 1.0° C. b) In the ventral thermogram of a patient with clinical varicocele a diffuse hyperthermia on the left hemiscro-tum can be observed. It exhibits a great temperature gradient from the right to the left. The mean absolute temperature on the left (TML) is 32.3°C, whereas the mean absolute temperature on the right side (TMR) is 30.1°C. Accordingly the difference TD is 2.2°C. The mean horizontal thermal profile (lower part of figure 4b) has a minimum value of 29.5°C in the right part of the scrotal bag, and a maximum value of about 33.0°C in the left. The thermal asymmetry parameters of the geometrically normalized thermogram TDSA and TDSB have both the value 2.1°C and the corresponding edge-to-edge temperature differences TFA and TFB have both the value 4.0°C. The uniform hyperthermia on the left side and the fairly uniform thermal pattern of the right side, explain why the parameters relating to
the upper and lower part of the scrotum have the same values.
c) A different pattern in the temperature distribution manifeste itself in the case of a subclinical varicocele with an ambivalent clinical diagnosis which was later surgically treated with success. The dorsal view of the scrotum shows a hyperthermia only in the upper left quadrant. This is also evident in the averaged tempe-rature profile of the upper half of the scrotum in the geometrically normalized thermogram (lower part of figure 4c). In fact, whereas the thermal asymmetry Parameter TDSB of the lower scrotal portion amounts only to 0.7°C, TDSA is 1.0°C. However the abnormal temperature distribution manifests itself in a much more pronounced manner in the edge-to-edge diffe-rences, with TFA = 1.9°C and TFB = 0.8°C. The low values in the middle of the thermal profile (figure 4c below) are due to a skin fold running vertically on the scrotum.
Biomedizinische Technik
Band 30 Heft 11/1985 Quantitative Inf ra-Red Thermography 289
original picture
length matching
SL=
ι
width matching
Figure 5. The procedure for the mapping of the scrotal thermo-gram. The unprocessed image of the shorter hemiscrotum is stretched in axial direction by the factor SL (length matching)
using a linear Interpolation procedure. Then each hemiscrotal image is stretched horizontally line by line by the factors SWi
(width matching) producing two rectangles of equal size.
Results and conclusions
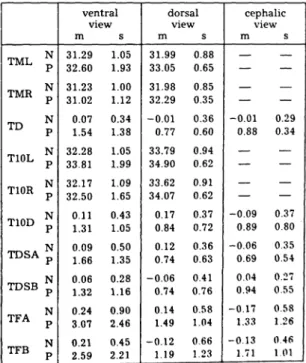
The patient group examined consists of 31 men, aged between 20 and 46 (mean age 34) and suspected of being infertile. On the basis of the clinical and Doppier sono-graphic examinations a left varicocele was detected in 7 patients. In most cases the averaged absolute tempe-ratures (parameters TML and TMR) in the dorsal thermograms are at least 0.5°C above the correspond-ing parameters of the ventral view in the same subject. The mean skin temperature of the left testis is in all but one varicocele case above 31.5°C (max. 35.3°C; mean value of normal cases 31.3°C) and on the contralateral hemiscrotum never below 30.0°C (max. 32.9°C). The difference TD of the mean temperature values of the left and the right side is in all pathological cases more than 0.75° C whereas in normal cases the mean value of TD is almost zero. Table l lists the mean values and Standard deviations of the parameters for the negative and the positive cases.
Table 1. Parameter means (m) and Standard deviations (s) for the groups of negative (N) and left varicocele (P) cases.
TF
+W
Figure 6. The edge-to-edge tempprature difference TF of the mapped thermal image. TF i§ calculatpd from the linear least «quare fit of the average of all temperalure profilee by
multi-plying the slope by 2w.
TML J TMR £ TD J T10L J T10R £ T10D p TDSA^ TDSB p
TFA ;
TFB p ventral view m s 31.29 1.05 32.60 1.93 31.23 1.00 31.02 1.12 0.07 0.34 1.54 1.38 32.28 1.05 33.81 1.99 32.17 1.09 32.50 1.65 0.11 0.43 1.31 1.05 0.09 0.50 1.66 1.35 0.06 0.28 1.32 1.16 0.24 0.90 3.07 2.46 0.21 0.45 2.59 2.21 dorsal view m s 31.99 0.88 33.05 0.65 31.98 0.85 32.29 0.35 -0.01 0.36 0.77 0.60 33.79 0.94 34.90 0.62 33.62 0.91 34.07 0.62 0.17 0.37 0.84 0.72 0.12 0.36 0.74 0.63 -0.06 0.41 0.74 0.76 0.14 0.58 1.49 1.04 -0.12 0.66 1.19 1.23 cephalic view m s — — -0.01 0.29 0.88 0.34 — — — — -0.09 0.37 0.89 0.80 -0.06 0.35 0.69 0.54 0.04 0.27 0.94 0.55 -0.17 0.58 1.33 1.26 -0.13 046 1.71 1.01The data show that not always all 3 thermograms of a patient with varicocele show positive signs. It is there-fore essential to record thermograms from all three views. Even though the patient populations with positive and negative diagnoses studied are relatively small, the corresponding differences of the mean values of the parameters TD, T10D. TDSA, TDSB, TFA, and TFB of the ventral and cephalic thermograms are signi-ficant to the degree that p is ^ 0.05 aeeordmg to a t-test. The Parameters TML, TD. T10L, TDSB. TFA, and TFB for the dorsal view also show signifieant diffeivnces.
4 I • positive coses G negative cases
U
-6 -5 -4 -3 -2 -1 ^ canonical 3 variableFigure 7. Multivariate discriminant analysis: histogram of the canonical variable. A complete Separation of the positive and negative cases is achieved.
In order to classify the thermograms by considering all Parameters simultaneously a multivariate discrimi-nant analysis is applied. Accordingly a linear com-bination of the parameters is determined, such that the difference of the mean values of the two classes of patients with and without varicocele is maximized and the variances of the distributions within each class are minimized. This linear combination, the so called canonical variable, involves in our study primarüy the Parameters TMR of the ventral view, TML, T10R, T10D, TFA of the dorsal view and TD, T10D, TDSA, TFA of the cephalic view. On the basis of this canonical variable a complete Separation of positive (clinical and subclinical varicoceles) and negative cases is achieved (histogram in f igure 7). The canonical variable obtained in this manner can be utilized to achieve a diagnostic classif ication of future cases in prospective studies or in clinical routine examinations.
Quantitative telethermography of the scrotum is a simple and objective diagnostic method, which can be implemented on any computer-assisted thermography system with sufficiently high resolution in a straight-•forward way. In our retrospective study it led to a complete Separation of the two classes without and with left varicocele. For future prospective classifica-tions the method should be improved by redef ining the canonical variable retrospectively on the basis of a larger and more representative patient group which also includes right-sided or bilateral varicoceles. The results of this study indicate that quantitative tele-thermography in combination with clinical examina-tion (palpaexamina-tion and semen analysis) and possibly with Doppier sonography may be a useful tool to detect or exclude the presence of a varicocele. A follow-up project now in progress involving 300 male patients with fertility problems is designed to provide more conclusive data on the validity of this statement. References:
[ l ] Agger, P.: Scrotal and testicular temperature: its relation to sperm count before and after Operation of varicocele. Fertil. Steril. 22 (5) (1971), 286-297
[2] Belker, A. M.: The varicocele and male infertility. Urol. Clin. North America 8 (1) (1981), 41-51
[3] Bösiger, P., F. Scaroni: A microprocessor-assisted ther-mography system for the on-line analysis of thermograms and dynamic thermogram sequences. In Biomedical Thermology. Alan R. Liss, Inc., New York (1982), pp. 329-337
[4J Bösiger, P.: Quantitative Thermographieuntersuchun-gen zur Bestimmung der Gewebedurchblutung. Thera-piewoche 32 (1982), 5076-5081
[51 Chätel, A., J. M. Bigot, C. Helenon, H. Dectot, J. Rotman, J. Salat-Baroux: Interet de la phlebographiespermatique dans le diagnostic des sterilites d'origine circulatoire (varicocele). Ann. Radiol. 21 (8) (1978), 565-570 [6] Comhaire, F., M. Vandeweghe, M. Simons: Comparison
between thermography and venous scintigraphy of the scrotum in the diagnosis of varicocele. Int. J. Andrology 4 (1981), 663-668
[7J Desmons, F., J. P. Gasnault, A. Gauthier, B. Petyt: Interet de la phlebographie par voie retrograde dans le bilan des varicoceles pelvins. Contraception Fertil. Sex. 6 (9) (1978), 568-573
[8] Lazarus, B. A., A. W. Zorgniotti: Thermoregulation of the human testis. Fertil. Steril. 26 (8) (1975), 757-759 [9] Ludwig, G.: Pathogenesis of varicocele. In Varicocele and
male infertüity, Springer, Berlin, 1982, pp. 6-12 [10] Pontonnier, F., A. Mansat, P. Plante: Varicocele et
hypo-fertilite. J. Gynecol. Obst. Biol. Reprod. 11 (1982), 607-610
[11] Stephenson, J. D., E. J. O'Shaughnessy: Hypospermia and its relationship to varicocele and intrascrotal tem-perature. Fertil. Steril. 19 (1) (1968), 110-117
[12] Tessler, A. N., H. P. Krahn: Varicocele and testicular tem-perature. Fertil. Steril. 17 (2) (1966), 201-203
[13] Wutz, J.: Epidemiology of idiopathic varicocele. In Vari-cocele and male infertility, Springer, Berlin, 1982, pp. 2-3
[14] Zorgniotti, A. W., J. Macleod: Studies in temperature, human semen quality, and varicocele. Fertil. Steril. 24 (11) (1973), 854-863
[15] Zorgniotti, A. W.: Testis temperature, infertility, and the varicocele paradox. Urology 16 (1) (1980), 7-10
267 Anschriften der Verfasser:
Luigi M. Gallo, M. E. und Peter Bösiger, Ph. D.
Institut für Biomedizinische Technik, Universität und ,
Gloriastraße 35, CH-8092 Zürich
Christoph J. Rageth, M. D. und David Stucki, M. D. Universitätsfrauenklinik des Kantonsspitals,
Schanzenstraße 46, ' . CH-4031 Basel