Summary. Two monogynous species of North African desert
ants belonging to the formicine genus Cataglyphis exhibit extremely different habitat preferences, population densities, and population structures. C. fortis is the only Cataglyphis species within the salt-pan flats of the Algerian and Tunisian chotts and sebkhas, whereas C. bicolor, alongside C.
albi-cans and C. ruber, inhabits the nutritionally richer low-shrub
semi-deserts surrounding the salt pans. We present a com-parative study of the spatio-temporal patterns of colony dis-tribution of the two monogynous species over periods of at least 5 (maximally 15) years. In C. fortis low population den-sities (0.5 kg body mass per km2) and, correspondingly, large inter-nest distances (40.6 m mean nearest neighbour nest dis-tance) are correlated with absolute intra-annual and high inter-annual nest-site stability (more than 75 % inter-annual survival rate) and a monodomous colony structure. In
C. bicolor the population density is one hundred times
high-er (42 kg body mass phigh-er km2, 9.1 m mean nearest neighbour nest distance), nest-site stability is extremely low in both intra-annual and inter-annual terms (67 % intra-annual vival rate for 13-day periods; less than 5 % inter-annual sur-vival rate), and polydomy prevails. These marked differences in population structure are discussed with respect to adapted traits such as foraging range, running speed, and relative lengths of the legs.
Key words: Ants, Cataglyphis, nest distribution, nest
reloca-tion, monodomy, polydomy.
Introduction
Competition is the hallmark of interactions among ant colonies. Whatever the behavioural traits may be that have
ultimately evolved as a consequence of competitive interac-tions between members of different colonies, the final out-come of these behaviours reflects itself in the distributional pattern of its colonies in space.
In the present account we investigate the population structure of two species of desert ants par excellence, i. e., of ants belonging to the Old World genus Cataglyphis. One of the two species, C. fortis, inhabits the most food-impover-ished areas of the North African deserts, the salt pans of Tunisia and northern Algeria. If we move into the centres of these salt flats, C. fortis is the only Cataglyphis species, actu-ally the only ant species at all. Hence the question arises whether the spacing of the colonies of this North African salt-pan endemic follows the general overdispersion pattern known for ants (see, e. g., Levings and Traniello, 1981; Lev-ings and Franks, 1982; Hölldobler and Wilson, 1990), or whether the extreme shortage of food in the habitat of this species has led to other distributional patterns.
The second species, Cataglyphis bicolor, inhabits the nutritionally richer low-shrub desert surrounding the salt pans. How, then, does population structure of this species compare with that of C. fortis? This is an intriguing question all the more as C. bicolor and C. fortis share their major for-aging characteristics such as type of food (arthropod car-casses), time of foraging (exclusively at daytime and in the summer season), or search strategy (sector fidelity even under conditions of uniformly distributed food resources). We try to answer this question not only by static surveys of colony distribution patterns but also by monitoring temporal changes of these patterns within the same test areas over peri-ods of several years. The differences found between the two species can be correlated with species-specific morphologi-cal and behavioural characteristics such as body size, run-ning speed (Wehner, 1983), and foraging range (Wehner, 1987), with the occurrence of monodomous or polydomous colony structures, and finally with the presence or absence of multi-congeneric-species associations (Wehner et al., 1983; Schmid-Hempel, 1984).
0020-1812/04/020186-11 DOI 10.1007/s00040-003-0722-0 © Birkhäuser Verlag, Basel, 2004
Insectes Sociaux
Research article
Spatio-temporal patterns of colony distribution in monodomous and
polydomous species of North African desert ants, genus Cataglyphis
F.-X. Dillier and R. Wehner*
Department of Zoology, University of Zürich, Winterthurerstrasse 190, 8057 Zürich, Switzerland, e-mail: [email protected]
Received 8 August 2003; revised 27 November 2003; accepted 2 December 2003.
3. Spatial distribution of nests and colonies
Nest sites were first localized by systematic searches, i. e. by patrolling the test area along parallel lines 5 to 10 m apart (depending on vegeta-tion density), searching for new nest sites, and checking all former (labelled) nest sites. The search was supported by feeding biscuit crumbs to foragers in the field and subsequently pursuing the biscuit-carrying workers back to the entrances of their nests. The locations of the nests were then mapped to the nearest five centimetres by using a theodolite with infrared distancer (Leica Geosystems AG, CH-9435 Heerbrugg) or by applying a right-angle measurement method employing an optical square consisting of two superimposed pentagonal prisms (Leica Geosystems AG), and three alignment rods as well as a 50-m tape-mea-sure (a standard technique in geodesy). These mappings occurred 3 to 6 times during the ants’ annual activity season from March to October over periods of at least four and maximally nine successive years.
In C. bicolor and C. fortis these exhaustive mappings of nest entrances occurred in focus areas of 3.5 · 104 m2 and 1.0 · 105 m2,
respectively. In order to account for edge effects, nests were mapped also outside these focus areas. During the sampling periods the states of activity of the nests were recorded. In the polydomous species C.
bicol-or special care was taken to monitbicol-or all ‘carrier transpbicol-orts’, i. e.
above-ground transports of brood or nest mates by experienced foragers between different nests belonging to the same colony (Wehner et al., 1972). Following transporter ants enabled us to determine the colony affiliations of satellite nests. Source and target nests as well as the trans-ported load (eggs, larvae, pupae, workers or sexuals) were noted.
The digitized coordinates of the mapped nest entrances were statis-tically and graphically evaluated by employing the SAS software pack-age (SAS of Institutes Inc., Cary, NC, USA). In order to evaluate the spatial distributions of nests and colonies we performed the nearest neighbour distance analysis as described by Clark and Evans (1954). This ‘plot-less’ or continuous method was preferred to discrete methods based on a Poisson distribution of points within a raster of plots (Hark-ness and Isham, 1983; see also Greenslade and Halliday, 1983; Johnson, 1992). As the nearest neighbour distance analysis is not very sensible to the absolute nest (or colony) density as well as to the frequency of data acquisition, it allows for comparisons between locally and temporally separated sets of data. In order to avoid edge effects, nests lying outside the test area were frequently included, and the modified formula pro-vided by Donnelly (1978) was used (Sinclair, 1985; Haefner et al., 1991; Franks and Sendova-Franks, 1992; Ryti and Case, 1992). As the uncorrected Clark and Evans (1954) formula tends to be biased, espe-cially for small values of N, towards a regular distribution (Donnelly, 1978; Sinclair, 1985), we always used the corrected version (see also Dale et al., 2002; Perry et al., 2002).
Statistical differences between nest and colony distribution patterns were examined by performing an ANOVA for differences between test periods, test areas (Clark and Evans, 1954), and species effects (orthog-onal linear contrasts: Linder and Berchtold, 1979; Sachs, 1992). A clus-ter analysis (Proc Clusclus-ter, centroid clusclus-ter analysis, SAS Institute Inc., Cary, NC, USA) helped to infer the colony affiliations of C. bicolor nests from the geometric nest distribution pattern, minimizing the dis-tance of the member nests to the geometric centre of the cluster. The resulting clusters were checked for inconsistencies with colony affilia-tions determined from the ‘carrier transport’ data. The iteration process of the cluster analysis was stopped at the cluster number with the least contradictions to the ‘carrier’ data. All ambiguities in colony affiliation have been resolved in favour of the ‘carrier transport’ data.
Results
1. Population densities and patterns of distribution
A comparison of the nest-site distributions of C. fortis and
C. bicolor (Figs. 1 A and B, respectively) reveals the obvious:
the density of nests is much higher – by a factor of about five
Materials and methods
1. Ant species
The current study focuses on two monogynous species of the formicine genus Cataglyphis (Foerster, 1850; Wehner, 1983; Agosti, 1990; Wehner et al., 1994). In Tunisia the large reddish-black polydomous Cataglyphis
bicolor (Fabricius, 1793) inhabits the steppe areas of the Tunisian Sahel
(Wehner et al., 1994; Dietrich and Wehner, 2003) as well as agricultural areas, pasturelands and settlements. The medium-sized monodomous
Cataglyphis fortis (Forel, 1902; Wehner, 1983) is restricted to the
rela-tively wet and salty soils of the chotts, sebkhas and offshore inundation areas. The North African zone of the chotts extends from southern Tunisia to the North-east of Algeria. C. fortis is endemic to this area.
The C. bicolor study site is inhabited also by two small Cataglyphis species, C. albicans (Roger, 1859) and C. ruber (Forel, 1903; Wehner, 1986), which are included in certain parts of this study. In Tunisia
C. ruber occurs south of a line combining Biskra, Feriana and Sfax, i. e.
south of approximately 35 °N latitude. C. albicans is perhaps the most widely distributed Cataglyphis species in Tunisia. Its distributional range overlaps with C. bicolor and C. ruber as well as with C. viaticus in the north and C. savignyi in the south of the bicolor study site. It extends even into the fringes of the fortis study site, where the ground is sparsely covered with islands of low-shrub vegetation.
2. Field study sites
Most field data were collected during the 5-year period of 1987 – 1991 at our study site near Maharès (34.58 °N, 10.50 °E), Tunisia, about 30 km south of Sfax. Partial recordings were continued until the year 2002.
The fortis study site is located within a salty coastal plain charac-terized by large barren surfaces. The soil consists of a mixture of sandy clay and gypsum. Occasionally inundated during the winter months, the surface dries slowly during March and April. Due to high evaporation rates, a hard, smooth, brownish-yellow surface develops. Towards the sea this hard, solid ground is replaced by a salt-swamp tidal seashore environment covered patchily by halophilous chenopodiacean shrubs (mostly Arthrocnemum glaucum). On the inland side the bare surface of the fortis study site blends with the shrub desert of the bicolor study site (see below).
The C. fortis nest sites are located in open, vegetation-free areas of the salt-pan habitat. The nest entrances can be found on top of hardly detectable elevations of the ground, but never in, or close to, patches of the sparse vegetation.
The bicolor study site is located within the shrub desert character-istic for the pre-Saharian zone of the Tunisian Sahel (150 – 200 mm rain-fall; Le Houerou, 1969; Floret et al., 1982). The sandy clay soil surfaces often forming thin lime and gypsum crusts are patchily covered with chenopodiacean shrubs such as Suaeda vermiculata and Salsola
longi-folia, but also with Arthrocnemum macrostachyum and Athriplex
species as well as with the thorny zygophyllacean bushes of Nitraria
retusa. These visually dominant shrubs and bushes and interspersed
with a mosaic of low xerophyllic dwarf shrubs, grass horsts (Lygeum
spartum, Cynodon dactylon) and low grasses (Koeleria pubenscens) as
well as with patches of perennial herbs (e. g. the cariophyllacean
Min-uartia geniculata, the cistacean Helianthemum lippii, or the
scophular-iacean Kickxia aegyptiaca) and some inconspicuous (mostly aster-acean) annuals (for a complete plant list of the study site see Neumey-er, 1994). The bicolor study site extends between the sea and patchily distributed fortis habitats on the one side and agricultural lands (olive tree cultures) on the other.
The C. bicolor nest sites can be found within patches of vegetation as well as on the bare ground in between. Even though there does not seem to exist any correlation between the distribution of nests and large-scale features of the habitat, mechanical disturbances of the hard steppic ground such as, e.g., rodent holes seem to favour the initiation of new nests and hence influence the small scale location of the nest entrances.
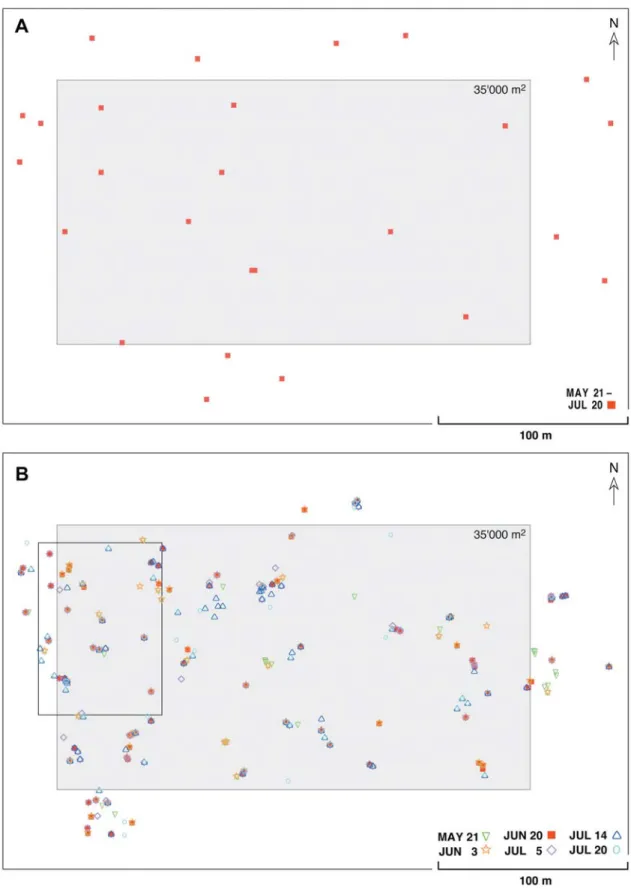
Figure 1. Nest site maps of A C. fortis and B C. bicolor in 1989: intra-annual variation. In C. fortis the nest sites remained constant throughout the
entire summer activity period of the species, but this was not the case in C. bicolor. The different symbols represent nest localities recorded at six dif-ferent times of the ants’ peak activity period, May – July. The localities recorded on June 20 (filled symbols) provided the data set used in the inter-annual comparison (Fig. 4). At the fortis study site (A; test area for experiments on ant navigation, Wehner, 2003) nests were recorded routinely many times during the period May 21 to July 20. Open symbols, nest entrances active before or after the focus period. The insert frame in B marks the loca-tion of the more detailed map in Fig. 2
ues r and rthis R = r/rth= 1. However, as shown by the
R-val-ues in Tables 1 and 2, the nest-site distributional patterns of the two species depart highly significantly from randomness, but do so in different directions. In C. fortis the ratio R = 1.26 ± 0.01 deviates significantly from R = 1 towards
R = 2.15, that is, towards the value representative for maxi-mum spacing, in which all nests are distributed in an even, hexagonal way (uniform distribution, overdispersion). Note that all C. fortis data mentioned above and given in Table 1 are derived from nest-site records that have been taken with-in an area about three times as large as the focal area shown in Fig. 1.
In contrast to C. fortis, the R-value of the nest-site distri-bution of C. bicolor is significantly smaller than one (R = 0.67 ± 0.06; Table 2) indicating a clear tendency towards an
aggregated (under-dispersed) distribution. Even a cursory glance at the inner (focal) area of the C. bicolor nest-site map (Fig. 1 B, rectangular grey area) reveals that in C. bicolor the nest sites are distributed in a patch-like way. This aggregated distributional pattern corresponds with our previous finding that C. bicolor unlike C. fortis exhibits a polydomous colony structure (Wehner et al., 1983; Schmid-Hempel, 1984). The queenright (primary) nest is associated with a number of queenless satellite (secondary) nests. At the peak of the activ-ity period, colonies of C. bicolor comprise, on average, 3.2 simultaneously active nests (90 colonies, 292 nests, median: 3, quartiles: 1 and 4, maximum: 11; 4 years). The number of nests that have been active within a colony at least once dur-ing the entire foragdur-ing season amounts to 6.1 (55 colonies, 334 nests, median: 5, quartiles: 2 and 9, maximum: 15; 2 years). The secondary nests are connected to the queenright – in C. bicolor than it is in C. fortis. As can be deduced from
the data presented in Tables 1 and 2, the densities amount to 300 ± 42 nests per km2in C. fortis and 1’535 ± 497 nests per km2in C. bicolor (mean ± standard deviation, N = 4 years). This difference is in accord with the extremely poor nutri-tional value of the C. fortis habitat, the salt-pan flats, as com-pared to the low-shrub semi-desert inhabited by C. bicolor. Furthermore, during the ants’ (summer) activity period the nest sites of C. fortis are extremely stable, but the ones of
C. bicolor shift around substantially. In Fig. 1 B the filled red
squares depict nests active during the peak of the annual activity period, the end of June, whereas the open symbols represent active nests recorded before and after that peak period. During 6 sampling periods separated by 12.6 ±
6.4 days within a 3-month period (May – July) Nest Renewal and Nest Remaining Indices (Cerda et al., 2002) were 30.1 ±
6.8 % and 66.7 ± 12.3 %, respectively. The functional
corre-late underlying this pronounced spatial shifting of nest sites in C. bicolor will become apparent later.
First, let us ask whether the marked difference between the population densities of the two Cataglyphis species is correlated with corresponding inter-species differences in the kind of pattern, in which the nest-sites are spatially dis-tributed. To answer this question we used the measure of spacing first proposed by Clark and Evans (1954) and based on the criterion of nearest neighbour distances (see Meth-ods). In particular, we determined the mean nearest neigh-bour distances of the nests, r, and compared these values with the theoretical mean distances to the nearest neighbours that would be expected if the nests were distributed randomly, rth.
By definition, in the latter (random) case the ratio of the
val-Table 1. Nest site distribution patterns of all mapped nests in the “fortis study site”. The table shows the Nearest-Neighbour-Analysis for the mapped C. fortis nest entrances for summer 1988 to 1991. The table includes the numbers of nests, the sizes of the mapped area, the nest densities, r mean
val-ues and ± sr standard errors of the nearest neighbour nest distances, rththeoretical mean value and ±srthstandard error of the expected nearest neigh-bour nest distances in an infinitely large random distribution for the observed nest densities, the ratio R = r/rthas a measure of the degree to which the observed distributions depart from random expectation (0 = maximal aggregation, 1 = random distribution, 2.15 = regular distribution/maximal spac-ing), and c = (r – rth)/srththe standard variate of the normal curve (one-sided test). In 1988 a larger area has been sampled
Year N Area Density r ± sr rth±srth R c P
[m2] [10–4m–2] [m] [m]
1988 38 14 · 104 2.71 41.86 ± 16.54 33.20 ± 3.12 1.26 2.78 0.003
1989 35 10 · 104 3.50 37.65 ± 11.14 29.88 ± 2.96 1.26 2.62 0.004
1990 32 10 · 104 3.20 39.05 ± 12.53 31.42 ± 3.27 1.24 2.33 0.010
1991 26 10 · 104 2.60 44.45 ± 16.66 35.33 ± 4.10 1.26 2.22 0.013
Table 2. Nest site distribution patterns at the “bicolor study site”. The table presents the Nearest-Neighbour-Analysis for the C. bicolor nest entrances,
which have been active in June-July during the summers of 1988 to 1991 (see marked area in Fig. 4B). For definitions and conventions see Table 1
Year N Area Density r ± sr rth±srth R c P
[m2] [10–4m–2] [m] [m]
1988 39 3.5 · 104 11.14 9.75 ± 10.54 16.13 ± 1.48 0.60 – 7.46 <0.001
1989 57 3.5 · 104 16.28 8.66 ± 8.63 13.16 ± 0.99 0.66 – 8.75 <0.001
1990 42 3.5 · 104 12.00 10.00 ± 12.01 15.49 ± 1.36 0.65 – 4.36 <0.001
nest and with each other by above-ground carrier transports (Table 3). As the C. bicolor nest sites shift considerably, that is, as existing satellite nests are often abolished and new ones are formed, the flow of carriers between two particular nests is often reversed in direction. Towards the end of the season many satellite nests are given up, so that the hibernating colony usually contains only one or very few nests.
Technically, the carrier transport (Table 3) can be used to establish the affiliation of particular nests to particular colonies (see arrows in Fig. 2) and to determine the nearest neighbour nest distances within a colony (73 nests, mean: 7.90 m, median: 5.78 m, quartiles: 2.69 m and 10.70 m, max-imum value: 35.76 m; year 1989). By applying a cluster analy-sis in combination with the carrier-transport criterion we were able to transform the nest-site pattern of Fig. 1B into the most likely colony-site distribution (Fig. 2). If the nearest neighbour analysis performed on the former (nest-based) pattern and pre-sented in Table 2 is now repeated for the latter (colony-based) pattern, a striking difference results. Even though the R value again departs significantly from the random distribution hypothesis, it now does so in the opposite direction (R = 1.30
± 0.10; for year-by-year data see Table 4), i.e., towards a
uni-form distribution. Hence, the monodomous colonies of C.
for-tis and the polydomous colonies of C. bicolor exhibit the same
kind of distribution. According to an ANOVA, the species differences present at the nest-site level (ANOVA for group effects – differences between nest maps – F7,327 = 14.58,
P < 0.001 and orthogonal contrasts for species effects F1,327=
97.66, P < 0.001) vanish at the colony-site level (ANOVA for group effects – differences between colony maps – F7,183 =
0.0672, P > 0.10 and orthogonal contrasts for species effects
F1,183= 0.0145, P > 0.10). In C. bicolor the R value for the
colony pattern is even slightly higher than in C. fortis.
At the bicolor study site two other (smaller) Cataglyphis species, C. albicans and C. ruber, occur alongside C. bicolor. They reach high local nest densities (in the area shown in Fig. 3: 633 · 10–4m–2in C. albicans, 167 · 10–4m–2in C.
Year N Median 1. Quartile 3. Quartile Maximum
Distance Distance Distance Distance
[m] [m] [m] [m] 1987 38 7.31 3.28 11.24 31.47 1988 10 3.00 1.74 3.82 16.35 1989 89 7.39 3.56 16.38 64.81 1990 16 5.80 2.97 7.51 23.02 1991 31 6.82 3.68 10.09 50.88 total 184 6.66 3.33 11.89 64.81
Table 3. Carrier transport distances in C. bicol-or as recbicol-orded during the peak period of satellite
nest building (May to July). The table contains all nest to nest distances of observed carrier trans-ports during the nest mapping periods in the C.
bicolor study site. The distribution of carrier
tances is skewed in the direction of longer dis-tances. The longest observed carrier distances exceed even the mean nearest neighbour colony distances. This exemplifies the extreme plastici-ty and variabiliplastici-ty of the spatial layout of C.
bicol-or colonies
Figure 2. Map of inferred colonies of C. bicolor as recorded in 1989
(shaded areas). The map is based on nest entrance mappings in spring and summer. The shaded areas include all nest entrances of the polydo-mous colonies. The colony affiliations are deduced from a combination of observed “carrier transports” (arrows) and the results of an iterative clustering algorithm on the nest site pattern. The red line shows the iter-ative clustering process by 30 clusters. This number (30) led to the smallest amount of incompatibilities with the mappings derived from observed “carrier transports”. All ambiguities in colony affiliation that occurred between the cluster computations and the “carrier transport” data have been resolved in favour of the latter. Closed red symbols depict nest entrances active together at the peak of the foraging activity period end of June. Open symbols indicate nest entrances active either earlier or later in the same season
Table 4. Distribution patterns of C. bicolor colonies as inferred from cluster analysis and observed inter-nest transport of individuals. The table
pre-sents the estimated number of “colonies” (Fig. 2) and the corresponding “colony densities” within the 3.5 · 104m2test area (shaded frame in Fig. 4B).
In performing the Nearest-Neighbour-Analysis the sites of a colony is computed as the arithmetic mean of the coordinates all nest entrances belong-ing to an inferred colony. For definitions and conventions see Table 1
Year Colonies Area Density r ± sr rth±srth R c P
[m2] [10–4m–2] [m] [m]
1988 23 3.5·104 6.6 30 ± 9 22 ± 3 1.38 3.16 0.001
1989 20 3.5·104 5.7 29 ± 8 23 ± 3 1.25 1.92 0.027
1990 14 3.5·104 4.0 33 ± 9 28 ± 4 1.17 1.06 0.142
bined biomass of C. albicans (10 kg per km2) and C. ruber (2 kg per km2) – the two Cataglyphis species occurring syn-topicly with C. bicolor at the bicolor study site – are includ-ed in the comparison.
2. Pattern dynamics
Monodomy in C. fortis and polydomy in C. bicolor are cor-related with yet another parameter of population structure: its dynamic characteristics. We had already alluded to the pro-nounced intra-annual nest-site ‘fluidity’ within C. bicolor colonies. Now we can add a similar inter-annual effect. As systematic samplings of nest locations over periods of at least four consecutive years show, C. fortis and C. bicolor differ markedly in the long-term stability of their nest sites. The extreme stability underlying the nest-location maps of C.
for-tis (Fig. 4 A) contrasts sharply – as expected from the
intra-annual fluctuation – with the amazing flexibility of the maps in C. bicolor (Fig. 4 B). In C. fortis each year 76.2 per cent (N = 42) to 84.4 per cent (N = 32) of the nests could be locat-ed at exactly the site of the previous year (or at a maximum 2-m distance from the former site). At least every tenth nest (9.4 % of N = 340) lasted for at least 9 years.
ruber, and 117 · 10–4m–2in C. bicolor; 1800 m2, April 30, 1988), but rather than being homogenously distributed over the entire area, they form a patchwork of clusters of either
C. albicans or C. ruber nests. Over a larger area the two small
species together may reach a 10 to 20 times higher nest densi-ty than C. bicolor (494 · 10–4m–2, 4000 m2area and 31 · 10–4 m–2, 46’900 m2area, respectively; combined observations of all nests active during March–April 1988). All three species exhibit aggregated nest-site distributions (R = 0.67, C.
albi-cans; R = 0.55, C. ruber; R = 0.57, C. bicolor) and
polydo-mous colony structures, but do so on different spatial scales. The difference between C. bicolor and C. fortis gets even larger, if one adds data on the sizes of the colonies and the body weights of individual ants to the data on colony densi-ties. The colonies of C. bicolor contain 18 times more work-ers (3630 ± 2442, N = 8 colonies) than the colonies of C. for-tis (202 ± 125, N = 4 colonies). As the body weight of a C. bicolor worker (23.0 mg, quartiles 14.6 and 31.7 mg,
N = 1693) is 2.6 times that of a C. fortis worker (8.8 mg, quartiles 6.3 and 11.7 mg, N = 103), the habitat specific bio-mass of C. bicolor (42 kg per km2) exceeds that of C. fortis (0.5 kg per km2) by nearly two orders of magnitude. These habitat differences are increased even further, if the
com-Figure 3. Nest site maps of three syntopic Cataglyphis species: C. albicans, C. ruber and C. bicolor (April – May 1988). The area is part of the
600 mm total annual rainfall). There C. iberica reaches nest densities from 50 to 150 · 10–4m–2(Dahbi et al., 1997), sim-ilar to the nest density of C. ruber (126 · 10–4m–2) and inter-mediate between the nest densities observed for C. bicolor (11 · 10–4m–2) and C. albicans (368 · 10–4m–2) at our study site in the year 1988. In North Africa, however, even C.
for-tis, which occupies the poorest of all Cataglyphis habitats,
where it reaches most probably the lowest of all Cataglyphis population densities, exhibits an over-dispersed spatial pack-ing structure of its colonies and, hence, makes optimal use of its foraging ground.
As this dense packing structure (R > 1, Table 1 and Table 4) might let one assume, the mean nearest neighbour dis-tances between nests, i. e. between colonies in the mon-odomous C. fortis and between nests of different colonies in the polydomous C. bicolor, are strongly correlated with the foraging ranges of the two species. In C. bicolor as well as in the closely related C. nodus in Greece (Platamon study site, Wehner et al., 1983) mean nearest neighbour distances r cor-respond rather well to the radius RCof a circle drawn around
the nest and defining the area in which the ants spend 90 per cent of their foraging time. The same holds true for C.
albi-cans (Schmid-Hempel, 1983), even though in this smaller
species r and RCamount only to one third of the
correspond-ing values in C. bicolor. In C. fortis search density plots of foragers and hence data on RCare not yet fully available, but
a first set of recordings of individual foraging runs clearly shows that in this species the mean foraging distances are much larger than in C. bicolor (Wehner, 1987).
Two further parameters that are correlated with foraging range and inter-nest distance are running speed and relative length of the legs (Wehner, 1983): the largest-legged though medium-sized C. fortis reaches the highest running speeds, exhibits the largest foraging distances and establishes the widest (but still uniform) inter-nest spacing pattern. Just the opposite, i. e. smallest foraging ranges and smallest inter-nest distances, applies to the smallest-legged C. albicans. In all four parameters mentioned above the largest of the three
Cataglyphis species considered here occupies a middle
posi-tion. Obviously, it is a number of functional-morphology traits related to the animal’s locomotor behaviour that is cor-related with, or has been adapted to, the foraging ranges of the workers and the distances between the foragers’ central places, the nests.
The fact that the medium-sized C. fortis ranks highest in terms of foraging range, running speed, and inter-nest dis-tance is certainly correlated with the poor nutritional value of its habitat, in which C. fortis is the only Cataglyphis species. In contrast, the surrounding nutritionally richer low-bush semi-desert is inhabited syntopicly by the large-sized
C. bicolor and the small-sized species C. albicans and C. ruber (Fig. 3). At Maharès the latter species reaches the
northern limit of its distributional range, which extends into the central Sahara.
As all Cataglyphis species considered in the present account are generalist scavengers depending on the same type of food (arthropod carcasses) at the same time of day and year, strong competitive interactions are to be expected. All these values form lower limits, because in two
consec-utive years it was not always possible to distinguish between nests newly discovered by the observer and nests newly found-ed by the ants. In contrast, C. bicolor showfound-ed hardly any con-sistency in the locations of its nest sites between two mapping periods (years). In this species it was almost impossible to relo-cate nests at the same site at which they had been observed in the previous year. On average, this occurred in only 4.9 percent of the cases (N = 139). Nevertheless, in spite of the new nest-site arrangements every year, an ANOVA did not reveal any among-year differences in the distribution pattern of the C.
bicolor nest sites (mean squares: 0.12 and 0.14, d. f. = 3 and
287, respectively; F = 0.86, P > 0.10).
Discussion
The most striking differences between the population struc-tures of the two Cataglyphis species compared in the present account relate to population density (and hence the overall
Cataglyphis biomass supported of the two species specific
habitats) and population fluidity (and hence the spatio-tem-poral distributional patterns of the two species). Let us first deal with these two characteristics separately and then try to link them to each other and to the monodomy-polydomy aspect of the two species.
1. Population density and population structure
Sometimes particular nests of C. fortis and C. bicolor may be located only a few hundred meters apart from each other, but the habitats occupied by the two species are completely dif-ferent: extremely food-impoverished salt flats in the case of
C. fortis and nutritionally much richer low-shrub
semi-deserts in C. bicolor. This difference in the nutritional value of the two interdigitated habitats is reflected in the nest den-sity being 5.1 times higher in C. bicolor than in C. fortis (1535 ± 497 and 300 ± 42 nests per km2, respectively). As
C. bicolor exhibits a polydomous colony structure (3.2 ± 2.4
simultaneously active nests per colony, 4 year mean), but
C. fortis does not, the density of colonies and hence of
egg-laying queens varies only by a factor of 1.7 between the two monogynous species (507 ± 128 and 300 ± 42 colonies per
km2in C. bicolor and C. fortis, respectively). This ratio, how-ever, completely underestimates the difference in the number of Cataglyphis individuals and, even more so, the difference in Cataglyphis biomass between the two North African habi-tats (see p. 191).
In spite of these large differences in population density,
C. bicolor and C. fortis coincide in the spatial distribution
patterns of their colonies. Both species exhibit a pattern that deviates highly significantly from randomness towards a uni-form (over-dispersed) distribution. This is in contrast to the random distribution reported for C. iberica, a likewise monogynous and polydomous species studied by Cerdá et al. (2002) at two more mesic sites in south-east and north-east Spain (Murcia, 300 mm total annual rainfall; Barcelona,
These interactions are nearly exclusively of an exploitative, i.e. scramble competition type (Wehner et al., 1983; Schmid-Hempel, 1983; Wehner, 1987; Dietrich and Wehner, 2003). In this state of affairs, it will pay any species to adopt partic-ular food-retrieval preferences. For example, the frequency distributions of the sizes of the food items retrieved by
C. bicolor and C. albicans deviate significantly from each
other and from the size distribution of the food items avail-able within the foraging ranges of the two species (Schmid-Hempel, 1983). This means that in the richer of the two habi-tats, at the bicolor study site, which supports a Cataglyphis biomass that is one hundred times higher than that of the
for-tis study site (see above), a large-sized and at least one
small-sized Cataglyphis species differentially exploit the upper and the lower end of the food-size distribution. In contrast, in the poorer habitat only a single, medium-sized Cataglyphis species occurs: C. fortis, which has the entire range of food-sizes at its disposal. These correlations might also apply to the ecological equivalent of Cataglyphis in southern Africa, i.e. to ants of the myrmicine genus Ocymyrmex, which com-prises a similar range and distributional pattern of small-, medium- and large-sized species (Wehner, 1987).
Levings and Traniello (1981) proposed a model for the interpretation and prediction of ant nest-site distribution pat-terns, based on the ants’ foraging distances. The model pre-dicts that if there is a partial niche overlap – as is the case in the sympatric Cataglyphis species – intra-species competi-tion should be further increased relative to inter-species com-petition. As a consequence, regular patterns of nest-site dis-tributions should result – as has been observed in the colony-site distributional pattern of C. bicolor.
2. Population fluidity and polydomy
C. fortis and C. bicolor do markedly differ not only in their
population densities as discussed above but also in the stabil-ity/fluidity of their nest-site distributions. While in the for-mer species these distributions are amazingly stable over periods of several – in some cases up to ten – years (Fig. 4 A),
C. bicolor exhibits a very dynamic colony regrouping system
on an intra-annual and, consequently, all the more on an inter-annual time scale (Figs. 1 B and 4 B, respectively). This high temporal variability, which nevertheless maintains the aggre-gated spatial distribution of the nests within a colony and the over-dispersed distribution of the colonies within the popula-tion, is associated with the obligate polydomy of the species. Outside workers, mostly advanced foragers (Wehner et al., 1972), carry inside workers, pupae, larvae and eggs from one nest to another (Wehner et al., 1972; Duelli, 1976; Cerdá and Retana, 1992; Dahbi et al., 1997). The association of polydo-mous colony structure and high nest renewal rate was found and amply documented in the Spanish C. iberica as well (Cerdá et al., 2002). These authors describe interference competition between C. iberica and Camponotus foreli, in which C. foreli exhibits superior performances in fighting, whereas C. iberica does so in digging. This asymmetry leads to nest usurpation of C. iberica nests by C. foreli, and to nest
relocations by C. iberica (Cerdá and Retana, 1998). C. fortis, on the other hand, is strictly monodomous.
At first sight, the latter finding is surprising. For it is especially under the constraints of large foraging distances that ant species have been reported to develop polydomous colony structures, in order to increase foraging ranges and hence colonywide food intake rates. For example, Formica
polyctena can establish temporary ‘way stations’ between the
nest and a food source. Later these way stations often devel-op into satellite nests (Mabelis, 1979). In the Malaysian
Dolichoderus cuspidatus (Maschwitz and Hänel, 1985) and
the Argentine ant Linepithema humile (Hollway and Case, 2000) new nests are established at sites located close to food areas, especially when foraging distances have become too large. Colonies of fire ants, Solenopsis invicta, have been observed to occupy foraging areas prior to budding off sister colonies in these areas (Showler et al., 1990). The tropical giant ant Camponotus gigas even employs specialized trans-porter ants to carry food from peripheral nests to the central nest containing the queen. In addition, it establishes intricate communication systems, which enable several nests of a colony to cooperate in foraging by triggering waves of recruitment, which spread from the nest nearest to the food source to nests farther apart (Pfeiffer and Linsenmair, 1998). In all these examples of ‘dispersed central-place foraging’ (McIver, 1991) transport capacity and hence foraging yield are optimized by minimizing travel time and hence foraging costs.
Seen in this light, one might wonder why C. fortis has not adopted the polydomy mode of colony structure. As it has not, its foragers must travel much larger distances within a much poorer habitat than foragers of the polydomous C. bicolor have to do. Probably there is a threshold number of colony members to make the establishment of satellite nests favourable. Anecdotal observations of short term satellite nest foundations for only one or two weeks in a big C. fortis colony in 1989 – also the year with the highest observed nest density of this species – could point in this direction. Our results are in accordance with the hypothesis (Dahbi et al., 1997) that polydomy may be linked with high nest densities. Seasonal polydomy under high nest densities could help to reduce dis-ease and parasite load, but there is no evidence yet for such a function in our North African Cataglyphis populations.
Any more definitive answer to the question of why C.
for-tis with its widely dispersed colonies is monodomous must
await more comparative data on efficiency rates of individual foragers, on predatory risks of workers while foraging, i. e. risks resulting from robber flies, spiders, tiger beetle larvae, etc., and finally on colony-targeted attacks by predators, e. g. by subterraneous doryline ants. The latter (defensive) role of polydomy – spreading the risk of predation – has been dis-cussed and observed most directly by Droual (1984) for
Pheidole desertorum, in which a colony avoids approaching
predators by frequently shifting from one nest site within a set of multiple nests to another, but by occupying only one of these nests at any one time. Two subterraneous Dorylus species (D. fulvus and D. atriceps) occur in our study area, and over the years we have observed several attacks of these
Dietrich, B. and R. Wehner, 2003. Sympatry and allopatry in two desert sister species: how do Cataglyphis bicolor and C. savignyi coexist?
Oecologia 136: 63–72.
Donnelly, K.P., 1978. Simulations to determine the variance and edge-effect of total nearest neighbour distance. In: Simulation Studies in
Archaeology (I. Hodder, Ed.), Cambridge University Press,
Lon-don. pp. 91–95.
Duelli, P., 1976. Distanzdressuren von getragenen Ameisen (Cataglyphis bicolor) Fabr., Hymenoptera, Formicidae. Rev. Suisse
Zool. 83: 413–418.
Droual, R., 1984. Anti-predator behaviour in the ant Pheidole
deserto-rum: the importance of multiple nests. Anim. Behav. 32: 1054–
1058.
Fabricius, J.C., 1793. Entomologica Systematica emendata et aucta secundum classes, ordines, genera, species. Adjectis synonimis, locis, observationibus, descritionibus, Hafniae 2: pp 519. Floret, C., R. Pontanier and S. Rambal, 1982. Measurement and
model-ling of primary production and water use in a south Tunisian steppe.
J. Arid Envir. 5: 77–90.
Foerster, A., 1850. Eine Centurie neuer Hymenopteren. Zweite Dekade.
Verh. Naturhist. Ver. Preuss. Rheinl. Westf. 7: 484–500.
Forel, A., 1902. Les fourmis du Sahara algérien. Ann. Soc. Ent. Belgique
46: 147–158.
Forel, A., 1903. Mélanges entomologiques, biologiques et autres. Ann.
Soc. Ent. Belgique 47: 249–268.
Franks, N.R. and A.B. Sendova-Franks, 1992. Brood sorting by ants: distributing the workload over the work-surface. Behav. Ecol.
Sociobiol. 30: 109–123.
Greenslade, P.J.M. and R.B. Halliday, 1983. Colony dispersion and rela-tionships of meat ants Iridomyrmex purpureus and allies in an arid locality in south Australia. Insect. Soc. 30: 82–99.
Haefner, J.W., G.C. Poole, P.V. Dunn and R.T. Decker, 1991. Edge effects in computer models of spatial competition. Ecol. Model. 56: 221–244.
Harkness, R.D. and V. Isham, 1983. A bivariate spatial point pattern of ants’ nests. Appl. Stat. - J. Roy. St. C 32: 293–303.
Hölldobler, B. and E.O. Wilson, 1990. The Ants. Springer Verlag, Berlin, Heidelberg, London. 732 pp.
Holway, D.A. and T.J. Case, 2000. Mechanisms of dispersed central-place foraging in polydomous colonies of the Argentine ant. Anim.
Behav. 59: 433–441.
Houerou, H.N. le, 1969. La végétation de la Tunisie steppic. INRAT, Ariana (Tunisie). pp. 561.
Johnson, R.A., 1992. Soil texture as an influence on the distribution of the desert seed-harvester ants Pogonomyrmex rugosus and Messor
pergandei. Oecologia 89: 118–124.
Levings, S.C. and N.R. Franks, 1982. Patterns of nest dispersion in a tropical ground ant community. Ecology 63: 338–344.
Levings, S.C. and J.F.A. Traniello, 1981. Territoriality, nest dispersion, and community structure in ants. Psyche 88: 265–319.
Linder, A. and W.A. Berchtold, 1979. Elementare statistische
Metho-den. Birkhäuser UTB522, Basel.
Mabelis, A.A., 1979. Nest splitting by the red wood ant (Formica
polyctena). Neth. J. Zool. 29: 109–125.
Maschwitz, U. and H. Hänel, 1985. The migrating herdsmen
Dolichoderus (Diabolus) cuspidatus: an ant with a novel mode of
life. Behav. Ecol. Sociobiol.17: 171–184.
McIver, J.D., T.R. Torgersen and N.J. Cimon, 1997. A supercolony of the thatch ant Formica obscuripes forel (Hymenoptera: Formici-dae) from the Blue Mountains of Oregon. Northwest Science 71: 18–29.
Neumeyer, R., 1994, Strategie der Nahrungsbeschaffung syntoper Arten der Ernteameisengattung Messor im mitteltunesischen Steppenge-biet. Ph.D. Thesis, University of Zürich. 121 pp.
Partridge, L.W., K.A. Partridge and N.R Franks, 1997. Field survey of monogynous lepthothoracine ant (Hymenoptera, Formicidae): evi-dence of seasonal polydomy? Insect. Soc. 44: 75–83.
Perry, J.N., A.M. Liebhold, M.S. Rosenberg, J. Dungan, M. Miriti, A. Jakomulska and S. Citron-Pousty, 2002. Illustrations and guidelines species of driver ants on C. bicolor colonies. At least one of
these episodes was followed by a relocation of the attacked
C. bicolor nest. Finally, it is a social function that has been
ascribed to polydomy: workers can increase their inclusive fitness by rearing brood apart from their own mother queen in queenless satellite nests (e. g. Snyder and Herbers, 1991; Partridge et al., 1997). In fact, in C. iberica (Cerdá et al., 2002) as well as in Camponotus gigas (Pfeiffer and Linsen-mair, 1998) virgin females have never been found in the cen-tral (queenright) nests of these monogynous and polydomous species. Why, then, has C. fortis opted for monodomy? Nest location and/or construction in the comparatively wet salt-pan environment might be a factor that contributes to counter-balance the ecological and social selection pressures favouring a polydomous colony system. As studies in mor-phometric and molecular systematics show (Wehner, 1983; work in progress by the Cataglyphis systematics group),
C. fortis is related most closely to C. albicans, which is
poly-domous (Schmid-Hempel, 1983) and from which it might have split off in adaptation to the North African salt-pan type of habitat (Wehner, 1983). Hence, in C. fortis monodomy is certainly a derived character. Whatever the adaptive signifi-cance of the C. fortis monodomy might be, the strict mon-odomy-and-temporal-stability syndrome of colony structure in C. fortis contrasts sharply with the polydomy-and-tempo-ral-variability syndrome in C. albicans and C. bicolor.
Acknowledgments
We thank Per and Barbara Antonsen, Barbara Dietrich, Thomas Dillier, Elisabeth Dillmann, Valerie Domanico, Patrizia Fry, Martina Funk-Neumeyer, Andrew Giger, Thomas Krucker, Martin Müller, Rainer Neumeyer, Iris Schmidt, Katja Selchow, Deryk Shah, and Simone Thornton for their cooperation during this long-term field study, and Dr. Xim Cerda for helpful comments on the manuscript. Financial support came from the Swiss National Science Foundation as well as the G. and A. Claraz Foundation.
References
Agosti, D., 1990. Review and reclassification of Cataglyphis (Hymenoptera, Formicidae). J. Nat. Hist. 24: 1457–1505. Cerdá, X. and J. Retana, 1992. A behavioural study of transporter
work-ers in Cataglyphis iberica ant colonies (Hymenoptera Formicidae).
Ethol. Ecol. Evol. 4: 359–374.
Cerdá, X. and J. Retana, 1998. Interference interactions and nest usurpation between two subordinate ant species. Oecologia 113: 577–583.
Cerdá, X., A. Dahbi and J. Retana, 2002. Spatial patterns, temporal vari-ability, and the role of multi-nest colonies in a monogynous Span-ish desert ant. Ecol. Entomol. 27: 7–15.
Clark, P.J. and F.C. Evans, 1954. Distance to nearest neighbor as a mea-sure of spatial relationships in populations. Ecology 35: 445–453. Dahbi, A., X. Cerdá, A. Hefetz and A. Lenoir, 1997. Adult transport
in the ant Cataglyphis iberica: a means to maintain a uniform colonial odour in a species with multiple nests. Physiol. Entomol.
22: 13–19.
Dale, M.R.T, P. Dixon, M.J. Fortin, P. Legendre, D.E. Myers and M.S. Rosenberg, 2002. Conceptual and mathematical relationships among methods for spatial analysis. Ecography 25: 558–577.
for selecting statistical methods for quantifying spatial patterns in ecological data. Ecography 25: 578–600.
Pfeiffer, M. and K.E. Linsenmair, 1998. Polydomy and the organization of foraging in a colony of the Malaysian giant ant Camponotus
gigas (Hym./Form.). Oecologia 117: 579–590.
Roger, J., 1859. Beiträge zur Kenntnis der Ameisenfauna der Mit-telmeerländer. Erstes Stück. Berlin. Ent. Z. 3: 225–259.
Ryti, R.T. and T.J. Case, 1992. The role of neighborhood competition in the spacing and diversity of ant communities. Am. Nat. 139: 355– 374.
Sachs, L., 1992. Angewandte Statistik. Springer Verlag, Berlin, Heidel-berg, New York, London, Paris, Tokyo, Hong Kong, Barcelona, Budapest. pp. 846.
Schmid-Hempel, P., 1983. Foraging ecology and colony structure of two sympatric species of desert ants Cataglyphis bicolor and
Cataglyphis albicans. Ph.D. Thesis, University of Zuerich. 126 pp.
Schmid-Hempel, P., 1984. Individually different foraging methods in the desert ant Cataglyphis bicolor (Hymenoptera, Formicidae). Behav. Ecol. Sociobiol. 14: 263–271.
Showler, A.T., R.M. Knaus and T.E. Reagan, 1990. Studies of the ter-ritorial dynamics of the red imported fire ant Solenopsis invicta Buren Hymenoptera Formicidae. Agr. Ecosys. Environ. 30: 97– 105.
Sinclair, D.F., 1985. On tests of spatial randomness using mean nearest neighbor distance. Ecology 66: 1084–1085.
Snyder, L.E. and J.M. Herbers, 1991. Polydomy and sexual allocation ratios in the ant Myrmica-punctiventris. Behav. Ecol. Sociobiol. 66: 1084–1085.
Wehner, R., 1983. Taxonomie, Funktionsmorphologie und Zoogeogra-phie der saharischen Wüstenameise Cataglyphis fortis (Forel 1902) stat. nov. Senckenbergiana biol. 64: 89–132.
Wehner, R., 1986. Artcharakterisierung von Cataglyphis diehlii und C.
ruber. Jb. Akad. Wiss. Lit. Mainz 86: 106–113.
Wehner, R., 1987. Spatial organization of foraging behavior in individ-ually searching desert ants, Cataglyphis (Sahara desert) and
Ocymyrmex (Namib desert). In: Behavior in Social Insects (J.M.
Pasteels and J.-L. Deneubourg, Eds.), Birkhäuser Verlag, Basel, Boston. pp. 15–42.
Wehner, R., 2003. Desert ant navigation: how miniature brains solve complex tasks. Karl von Frisch Lecture, J. Comp. Physiol. A 189: 579–588.
Wehner, R., P.L. Herrling, A. Brunnert and R. Klein, 1972. Periphere Adaptation und zentralnervöse Umstimmung im optischen System von Cataglyphis bicolor (Formicidae, Hymenoptera) Rev. Suisse
Zool. 79: 197–228.
Wehner, R., R.D. Harkness and P. Schmid-Hempel, 1983. Foraging
Strategies in Individually Searching Ants Cataglyphis bicolor (Hymenoptera: Formicidae). Gustav Fischer Verlag, Stuttgart, New
York. 79 pp.
Wehner, R., S. Wehner and D. Agosti, 1994. Patterns of biogeographic distribution within the bicolor species group of the North African desert ant, Cataglyphis Foerster 1850 (Insecta: Hymenoptera: Formicidae). Senckenbergiana biol. 74: 163–191.