HAL Id: hal-00296508
https://hal.archives-ouvertes.fr/hal-00296508
Submitted on 27 Mar 2008
HAL is a multi-disciplinary open access
archive for the deposit and dissemination of
sci-entific research documents, whether they are
pub-lished or not. The documents may come from
teaching and research institutions in France or
abroad, or from public or private research centers.
L’archive ouverte pluridisciplinaire HAL, est
destinée au dépôt et à la diffusion de documents
scientifiques de niveau recherche, publiés ou non,
émanant des établissements d’enseignement et de
recherche français ou étrangers, des laboratoires
publics ou privés.
fine particles from Asia and the Northwestern United
States measured during INTEX B
R. E. Peltier, A. H. Hecobian, R. J. Weber, A. Stohl, E. L. Atlas, D. D.
Riemer, D. R. Blake, E. Apel, T. Campos, T. Karl
To cite this version:
R. E. Peltier, A. H. Hecobian, R. J. Weber, A. Stohl, E. L. Atlas, et al.. Investigating the sources
and atmospheric processing of fine particles from Asia and the Northwestern United States measured
during INTEX B. Atmospheric Chemistry and Physics, European Geosciences Union, 2008, 8 (6),
pp.1835-1853. �hal-00296508�
www.atmos-chem-phys.net/8/1835/2008/ © Author(s) 2008. This work is distributed under the Creative Commons Attribution 3.0 License.
Chemistry
and Physics
Investigating the sources and atmospheric processing of fine
particles from Asia and the Northwestern United States
measured during INTEX B
R. E. Peltier1,*, A. H. Hecobian1, R. J. Weber1, A. Stohl2, E. L. Atlas3, D. D. Riemer3, D. R. Blake4, E. Apel5, T. Campos5, and T. Karl5
1Georgia Institute of Technology, School of Earth and Atmospheric Science, Atlanta, GA 30332-0340, USA 2Norwegian Institute for Air Research, 2027 Kjeller, Norway
3University of Miami, Rosenstiel School of Marine and Atmospheric Science, Miami, FL 33149-1098, USA 4Department of Chemistry. University of California Irvine, Irvine, CA, 92697-2025, USA
5National Center for Atmospheric Research, Atmospheric Chemistry Division, Boulder, CO 80307, USA *now at: Department of Environmental Medicine, NYU School of Medicine, Tuxedo, NY 10987, USA
Received: 16 November 2007 – Published in Atmos. Chem. Phys. Discuss.: 29 November 2007 Revised: 29 February 2008 – Accepted: 29 February 2008 – Published: 27 March 2008
Abstract. During the National Aeronautics and Space
Ad-ministration (NASA) Intercontinental Chemical Transport Experiment, Phase B (INTEX-B), in the spring of 2006, air-borne measurements were made in the United States Pacific Northwest of the major inorganic ions and the water-soluble organic carbon (WSOC) of submicron (PM1.0)aerosol. An
atmospheric trajectory (HYSPLIT) and a Lagrangian particle dispersion model (Flexpart) quantifying source contributions for carbon monoxide (CO) were used to segregate air masses into those of primarily Asian influence (>75% Asian CO) or North American influence (>75% North American CO). Of the measured compounds, fine particle mass mostly con-sisted of water-soluble organic carbon and sulfate, with me-dian sulfate and WSOC concentrations in two to four times higher, respectively, in North American air masses versus transported Asian air masses. The fraction of WSOC to sul-fate in transported Asian air masses was significantly lower than one at altitudes above 3 km due to depleted organic aerosol, opposite to what has been observed closer to Asia and in the northeastern United States, where organic compo-nents were at higher concentrations than sulfate in the free troposphere. The observations could be explained by loss of sulfate and organic aerosol by precipitation scavenging, with reformation of mainly sulfate during advection from Asia to North America. In contrast to free tropospheric mea-surements, for all air masses below approximately 2 km alti-tude median WSOC-sulfate ratios were consistently between
Correspondence to: R. J. Weber ([email protected])
one and two. WSOC sources were investigated by multivari-ate linear regression analyses of WSOC and volatile organic compounds (VOCs). In Asian air masses, of the WSOC variability that could be explained (49%), most was related to fossil fuel combustion VOCs, compared to North Amer-ican air masses, where 75% of the WSOC variability was explained through a nearly equal combination of fossil fuel combustion and biogenic VOCs. Distinct WSOC plumes en-countered during the experiment were also studied. A plume observed near the California Central Valley at 0.6 km alti-tude was related to both fossil fuel combustion and biogenic VOCs. Another Central Valley plume observed over Nevada at 3 to 5 km, in a region of cloud detrainment, was mostly related to biogenic VOCs.
1 Introduction
Expanding arid regions and biomass burning in Asia, along with the rapid industrialization of China, has led to emissions from the Asian continent that are a significant global source of tropospheric aerosols (Streets and Waldhoff, 2000; Streets et al., 2003; Streets, 2007). Numerous studies have investi-gated the long range transport of Asian mineral dust and pol-lution (Jaffe et al., 1999; Huebert et al., 2003; Bertschi and Jaffe, 2005; Jaffe et al., 2005), including extensive airborne measurements made near the Asian coast during the ACE-Asia (Huebert et al., 2003) and TRACE-P (Jacob et al., 2003) research campaigns in the spring of 2001. Other studies have examined transported Asian aerosol as they approached the
North American continent (Park et al., 2003; de Gouw et al., 2004; Heald et al., 2005; Jaffe et al., 2005).
Airborne measurements during TRACE-P and ACE-Asia of fine particle chemical composition identified both rel-atively pure plumes and mixed plumes of mineral dust, biomass burning, and anthropogenic emissions. Biomass burning plumes consisted of fine particle ammonium, nitrate, water-soluble potassium, as well as organic carbon and el-emental carbon (Ma et al., 2003). Anthropogenic plumes were comprised mainly of sulfate and nitrate, with associ-ated ammonium (Lee et al., 2003), and carbonaceous ma-terial that was mainly organic carbon (OC) (Maria et al., 2003; Huebert et al., 2004a). From soundings conducted off the coast of Asia, sulfate concentrations on average dropped from ∼4 µg sm−3 near the surface to less than 1 µg sm−3 in the free troposphere. Elemental carbon (EC) had a sim-ilarly shaped profile (see Heald et al., 2005 and references therein). In contrast, OC concentrations ranged from on av-erage ∼4 to 5 µgC sm−3 and were fairly uniform from the surface up to the upper measurement range of 6 to 7 km above sea level (a.s.l.). This resulted in mass ratios of or-ganic carbon to sulfate of near one below ∼2 km a.s.l., but ratios of 3 to 4 in the 3 to ∼6 km a.s.l. altitude range. Sim-ilar types of aerosol chemical components were observed in the anthropogenic-influenced Northeastern United States measured during ICARTT (Peltier et al., 2007a), and a simi-lar altitude profile of organic carbon to sulfate was observed. These and other studies have demonstrated the importance of OC in the free troposphere.
Numerical simulations aimed at understanding the sources and atmospheric processing of sulfate and organic carbon in these two study domains demonstrated limitations with cur-rent understandings of OC sources and processing (Heald et al., 2005, 2006). For the ACE-Asia study, sulfate and EC were well predicted by GEOS-Chem, but OC was sig-nificantly under predicted, indicating unknown and unac-counted for OC sources (Heald et al., 2005). For the eastern United States ICARTT dataset, the average OC mass (actu-ally, the mass of water-soluble OC) was predicted fairly well by GEOS-Chem, but individual observations were poorly correlated (Heald et al., 2006), suggesting a poor understand-ing of atmospheric formation of WSOC.
A number of other recent studies have also demonstrated a general lack of understanding of OC sources and process-ing in regions impacted by urban anthropogenic emissions (de Gouw et al., 2005; Johnson et al., 2006; Volkamer et al., 2006; de Gouw et al., 2007). These studies indicated there is a significant yet unknown anthropogenic route for secondary organic aerosol production. OC is a substantial fraction of fine particle aerosol mass and a poor understanding of its sources and processing hinders development of strategies to improve air quality and assess its role in global climate. Un-derstanding OC has been impeded by its chemical complex-ity, in part due to its many sources, ranging from biogenic to anthropogenic emissions that produce both primary or
sec-ondary particles (Rogge et al., 1993; Jacobson et al., 2000; Turpin et al., 2000; Seinfeld and Pankow, 2003).
A subset of OC is the fraction that is water-soluble. So-called water-soluble organic carbon (WSOC) is of interest since it may have unique and important health effects and in-direct impacts on the planetary radiation balance. WSOC has two main sources: biomass burning and secondary organic aerosol formation (Huang et al., 2006; Sullivan et al., 2006; Huang and Yu, 2007; Weber et al., 2007). WSOC comprises typically 30–80% (gC/gC) of OC, with lowest ratios gener-ally recorded near sources with large primary emissions and highest ratios in aged air masses (Zappoli et al., 1999; Dece-sari et al., 2001; Jaffrezo et al., 2005). Single particle compo-sition studies show that most aged fine particles are internal mixtures of sulfate and organic compounds (Murphy et al., 2006).
In the spring of 2006, airborne measurements were made of the major inorganic ions and the water-soluble organic car-bon (WSOC) of submicron (PM1.0) aerosol with the goal
to study the impact of transported Asian emissions on the Northwestern United States (Singh et al., 20081). This re-search was part of the National Aeronautical Space Admin-istration (NASA) Intercontinental Chemical Transport Ex-periment, Phase B (INTEX-B). The National Center for At-mospheric Research (NCAR) C130 research aircraft partici-pated in this study, and was based at Paine Field in Everett, Washington, (47.91◦N, −122.28◦). The C130 conducted 10 research flights (plus two transit flights) that intercepted emissions mainly from Asia as they approached the North American continent. Research flights were conducted from 21 April 2006 to 15 May 2006. Altitude range of the air-craft extended from ∼0.1 km to ∼7.3 km a.s.l., with a nom-inal flight range of ∼1300 km from base. Instruments de-ployed on the NSF C130 pertinent to this study are discussed in the following section.
2 Methods
Fine particle bulk chemical composition was measured on-line from the C130 with two automated systems, each involv-ing a Particle-Into-Liquid Sampler (PILS). The PILS quanti-tatively transfers ambient aerosol into a liquid stream that can then be analyzed for specific aerosol chemical compo-nents. One PILS was coupled to two Metrohm® Ion Chro-matographs (Model 761, Houston, TX), while the second was coupled to a Sievers Total Organic Carbon analyzer (GE Water Systems, Model 800T, Boulder, CO). The first instru-ment package is referred to as PILS-IC (ion chromatograph), and the second as PILS-TOC (Total Organic Carbon ana-lyzer). Detailed descriptions of these instruments have been
1Singh, H. B., Brune, W. H., Crawford, J. H., Jacob, D. J.,
Rus-sell, P. B., et al.: An Overview of the INTEX-B Campaign: Trans-port and Transformation of Pollutants over the Pacific and the Gulf of Mexico, Atmos. Chem. Phys. Discuss., in preparation, 2008.
published (Weber et al., 2001; Orsini et al., 2003; Sullivan et al., 2006; Sullivan and Weber, 2006; Peltier et al., 2007a) Aerosol was sampled with a constant flow nominally isoki-netic inlet designed and constructed by Dunlea et al. (2008)2 following the design of Clarke and coworkers (Huebert et al., 2004b), and was located on the underside of the air-craft roughly three quarters of the way aft in the free air stream. This inlet was shared with an Aerosol Mass Spec-trometer that extracted a portion of flow upstream of the PILS from the centerline of the 1 inch OD sample transport tube. Aerosol was then passed through a non-rotating multi-orifice impactor (Marple et al., 1991) that had a nominal particle cut size of 1.0 µm at 1 atmosphere. Sample temperature, rela-tive humidity, and pressure were measured, and the sample then divided equally using a “Y” to each PILS operating at
∼15 L/min. 2.1 PILS-IC
The PILS-IC was operating using a 2.45 min cation and 75 s anion chromatographic separation. For cation separation, a “Cation 1–2” resin column (Metrohm-Peak, Houston, TX) was used. Over a 90 s period, PILS effluent was pumped through a 150 µl sample loop for injection onto the column. Eluent with concentrations of 8.5 mM L-tartaric acid and 4.1 mM dipicolinic acid was used to isocratically separate cationic components: sodium, ammonium, calcium, potas-sium, and magnesium. For this setup, cation limits of de-tection (LOD) for each species were 0.1 µg sm−3, with the
exception of potassium ion with LOD 0.5 µg sm−3. A
“Met-rosep Dual 4–25” monolithic column (Metrohm-Peak, Hous-ton, TX) was used for anion separation. Aerosol sample was continually collected over 60 s in a 90 µl sample loop and in-jected into the column. Eluent of 12.0 mM p-cyanophenol, pH adjusted (with 1.0 N LiOH) to 7.80±0.05 isocratically separate chloride, nitrate, and sulfate. With PILS liquid flow rates used for this anion setup, limits of detection were chloride: 0.1 µg sm−3, nitrate: 0.02 µg sm−3, and sulfate: 0.02 µg sm−3.
The resulting time interval for one PM1.0ion composition
measurement was a 90-s integrated sample every 2.45 min for cations, and a 60-s integrated sample every 75 s for an-ions. All concentrations have been converted to a standard temperature and pressure (273.15◦K, 1013.25 hPa).
A carbon monolith denuder and a set of etched glass hon-eycomb denuders coated with citric acid and sodium carbon-ate were loccarbon-ated immedicarbon-ately upstream of the PILS-IC to eliminate gas interferences. Before each flight, a valve di-verted sampled aerosol through a HEPA filter for
quantifica-2Dunlea, E., DeCarlo, P., Aiken, A., Kimmel, J., Bahreini, R.,
Peltier, R. E., Weber, R., Tomlison, J., Collins, D., Shinozuka, Y., McNaughton, C., Howell, S., Clarke, A., Emmons, L., Apel, E., Pfister, G., van Donkelaar, A., Millet, D., Heald, C., and Jimenez, J. L.: Evolution of Asian Aerosols During Transpacific Transport in INTEX-B, in preparation, 2008.
tion of backgrounds. Sulfate was the only ionic compound measured with detectable background interference, which was generally constant at 0.015 µg l−1(equivalent to
ambi-ent aerosol concambi-entration of ∼10 ng sm−3). The sulfate back-ground was subtracted from the dataset.
The ion chromatographs were calibrated using known di-lutions of NIST-traceable ion standards. Linear calibration curves forced through zero were established using five dif-ferent standards of anions and cations that bracketed the expected range of concentrations typically observed for the flow rates employed and the estimated ambient aerosol con-centration. Both cation and anion systems were calibrated using all five standards at the beginning and middle of the re-search mission. The anion column was also challenged with a single standard before most flights to verify peak retention time (which was very sensitive to eluent concentration and temperature), as well as peak area. At the end of the mis-sion, the anion column calibration was re-verified; unfortu-nately, the cation column failed during the last local flight and could not be calibrated. Sensitivity changed by less than
∼5% throughout the duration of the mission for the anion and cation systems, based on the series of calibrations.
2.2 PILS-TOC
A second PILS coupled to a Sievers Total Organic Carbon analyzer quantified PM1.0 WSOC. The PILS was operated
to produce a total sample liquid flow rate of 1.2 ml min−1. Following the removal of entrained gas bubbles in the liquid sample, the PILS effluent was aspirated by two glass syringe pumps working in alternating tandem to achieve continuous flow and pumped through a 0.5 µm PEEK filter. Liquid sam-ple was re-equilibrated with cabin pressure by using an inline sample line “tee” with one leg open to cabin air. Most of this sample (1.0 ml/min) was then drawn into the TOC analyzer via its internal peristaltic pump.
The TOC analyzer converts carbonaceous material to CO2
(carbon dioxide), and measures the evolved CO2 by
con-ductivity. Oxidation of organic compounds was achieved by acidifying the sample, and then applying a combina-tion of chemical (ammonium persulfate, 15% w/w, flow rate=1.5 µl min−1)and UV (ν=184 and 254 nm) oxidation. Tests show that no EC and no insoluble OC larger than
∼0.1 µm can be quantified with the TOC analyzer (Peltier et al., 2007b). The instrument was operated in “Turbo” mode to provide a 3-s integrated measurement every 3 s. All con-centrations have been converted to standard temperature and pressure (273.15◦K, 1013.25 hPa).
Immediately upstream of the PILS-TOC, the sample was passed through an activated carbon parallel plate denuder (Eatough et al., 1999) to remove organic gases. During each flight, a computer-actuated valve was triggered every three hours to divert sample flow through a Teflon filter for a dy-namic blank measurement. In general, before aircraft take off, and just after aircraft landing, the filter system was also
manually triggered for blank measurements and to limit con-tamination associated with aircraft maneuvering while taxi-ing. A linear interpolation of consecutive blanks was cal-culated and subtracted from the online dataset to determine ambient WSOC concentrations. Though the instrument is factory calibrated, additional calibrations using 4 different concentrations of oxalic acid was conducted before and af-ter the research mission. Near the middle of the mission, a single calibration standard was measured to verify analyzer sensitivity. In each case, analyzer sensitivity was within 5% of factory calibration.
To provide an assessment of instrument accuracy, mea-surements of identical species made on the NSF C-130 and NASA DC-8 research aircraft were compared during periods of formation flying. A blind intercomparison from flight 12 (15 May 2006) showed that fine particle sulfate measured online with a mist chamber on the DC-8 was essentially identical to fine particle sulfate measured by the PILS-IC on the C130 (slope: 1.00, 1σ =0.03 µg sm−3, range 0.25 to 1.15 µg sm−3; n=40). The PILS-WSOC was only operated on the C130 and thus could not be compared with a similar instrument on the DC-8.
2.3 Other instrumentation
Additional instrumentation used in this work included a CO monitor using a modified UV resonance fluorescence instru-ment for 1Hz measureinstru-ments of carbon monoxide (CO). The Trace Organic Gas Analyzer (TOGA) (Apel et al., 2003) was employed to measure a suite of 33 oxygenated volatile or-ganic compounds that included: carbonyls, alcohols, and C2-C8 nonmethane hydrocarbons. TOGA is a fast gas chromatograph-mass spectroscopy (GC/MS) that provides a 45-s integrated measurement every ∼2.5 min. In addi-tion, a variety of organic carbon compounds were detected by whole air sampling (WAS). These samples were subse-quently analyzed by gas chromatography, mass spectrome-try, flame ionization detection, or electron capture detection, depending on species measured. An onboard Proton Trans-fer Reaction-Mass Spectrometer (PTRMS) (Lindinger et al., 1998; de Gouw et al., 2003) quantified a variety of organic compounds, including hydroxyacetone and acetic acid. The sampling interval of this instrument was ∼33 s. Water va-por mixing ratio was measured at 1Hz by an onboard hy-grometer. Physical measurements, such as altitude and lat-itude/longitude were provided by the C130 standard instru-mentation package.
2.4 Identifying air mass sources
Various sources of measured anthropogenic species were identified with Flexpart, a Lagrangian particle dispersion model (Stohl et al., 1998, 2005). Flexpart backward runs were conducted whenever the aircraft changed latitude or longitude by 0.18 degrees, or when the aircraft altitude
changed by ∼8–15 hPa. In general, Flexpart runs were com-pleted every ∼30–60 s for all research flights.
The Flexpart model provides estimates for the fraction of anthropogenic CO, SO2, and NO2from the following
conti-nents: Asia, Africa, North America, Australia, South Amer-ica, and Europe. The calculations treated these substances as inert tracers, i.e., no deposition processes or chemical con-versions were accounted for. The results, thus, reflect the ac-cumulated emissions that entered the air mass during the 20 days the model was run backward from the observation loca-tions. The emissions were taken from the EDGAR 3.2 Fast Track 2000 global inventory (Olivier and Berdowski, 2001), except for North America where the emissions were based on the point, on-road, non-road and area sources from the US EPA National Emissions Inventory, base year 1999 with updates for 2005, with spatial partitioning of area sources at 4 km resolution (Frost et al., 2006).
In this analysis, when Asian CO (as determined by Flex-part) exceeded 75% of total Flexpart-predicted CO, the air mass was presumed to consist of mainly Asian emissions. When North American CO exceeded 75% of total CO, the air mass was considered to be influenced mainly by North American sources. CO was chosen as a tracer because of the three anthropogenic species Flexpart predicts (CO, NO2,
SO2), CO is likely the most inert on the time scales of interest
here, and hence best tracer to identify long range transport. On average, CO from North America and Asia accounted for >90% of total CO that was predicted by the model, in-dicating little influence from other continental sources. Of the 6078 Flexpart model runs analyzed, ∼48% (n=2931) were delineated as influenced by Asian pollution, ∼12% (n=704) were mainly influenced by North American sources of CO, and the remaining ∼40% were not dominated by ei-ther source. For air masses identified as mainly influenced by Asia or North America, measured CO mixing ratio dur-ing this mission was greater than 100 ppbv in 93% and 97% of the observations, respectively. Thus, in cases that were identified using model results as influenced by Asia or North America, most cases had significant enhancements above background levels of CO and were only minimally affected by low concentration (e.g., background) observations. In the following, Asian, North American, and all data are analyzed.
3 Results
During the experiment, each research flight had defined ob-jectives that depended on a variety of factors, including mete-orological conditions, satellite overpass schedules, coordina-tion with research flights of other aircraft involved in the IN-TEX campaign, and most importantly, model simulation pre-dictions on the locations of Asian plumes. Figure 1 shows the sampling region. Because most INTEX-B research flights focused on measurements within aged plumes from Asia, the data are not statistically representative of local aerosol
climatology; rather it represents measurements weighed by a focus on aged Asian air masses. On several occasions, specific plumes that were identified to be mainly influenced by more local sources in North America were encountered. These are analyzed as a subset of the North American data set.
3.1 Aerosol composition by continental source
Frequency distributions of measured concentrations were generally log-normally distributed and so geometric means and standard deviations are included in the analysis. Of measured components, PM1.0 mainly consisted of
sul-fate and then water-soluble organic carbon, as summa-rized in Table 1. For all data, median sulfate concentra-tion (±1σ ) was 0.59±0.74 µg sm−3, and median WSOC
was 0.3±0.8 µgC sm−3. Median ammonium concentration
was at the detection limit, though mean concentration was 0.2±0.2 µg sm−3. Sodium ion was above the detection limit for just 10.2% of observations, and nitrate ion was above the detection limit 5.0% of the time. Calcium and chloride ion were above the detection limit just 0.1% and 0.2%, respec-tively, and potassium and magnesium ions were not detected during the field campaign. The lack of sea-salt and mineral dust components is consistent with a PM1.0 measurement,
since these compounds are mostly observed in supermicron particle sizes (Fitzgerald, 1991).
Contrasting air masses with mainly Asian CO sources to North American sources of CO shows that generally both sul-fate and WSOC were higher in North American air masses. Median sulfate concentration was 0.84 µg sm−3 in North
American plumes and 0.42 µg sm−3in Asian plumes, with
substantially more variability in Asian sulfate concentrations (range: LOD to 6.83 µg sm−3 in Asian plumes; LOD to 1.92 µg sm−3in North American plumes). This is consistent with large Asian point sources of SO2. This was confirmed
by assessing the data using a Wilcoxon rank-sum test (JMP, ver 5.0.1, SAS, Cary, NC), which showed statistically signifi-cant differences in sulfate concentration between each source region. It is noted, however, that our method of identifying North American emissions, based on CO, tends to focus on urban sources located near the west coast of the United States where there are relatively few SO2sources.
In contrast to sulfate, median WSOC was a factor of 4 times higher in North American air masses (Table 1) than Asian air masses. Highest concentrations of WSOC could be traced with Flexpart to air masses from the Central Valley of California, as well as the immediate vicinity of Seattle. Not considering these plumes of highest WSOC concentra-tion, North American plumes still had generally much higher WSOC than Asian plumes (median WSOC without Cen-tral Valley or Seattle plumes was 0.5 µgC sm−3). California Central Valley plumes are analyzed further in Sect. 3.4. The North American and Asian WSOC data were also assessed by Wilcoxon rank-sum test are were found to be significantly
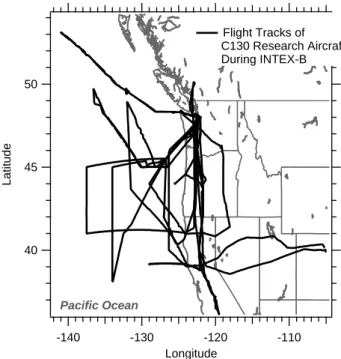
50 45 40 Latitude -140 -130 -120 -110 Longitude Flight Tracks of C130 Research Aircraft During INTEX-B Pacific Ocean
Fig. 1. NSF C130 research aircraft flight paths. The aircraft was
based near Seattle, US (47.91◦N, −122.28◦) from 21 April to 15 May 2006. Ten local research flights were conducted.
different. Plumes from Seattle are not investigated because interceptions were sporadic, recorded briefly during take-off and landing when many instruments were not operational.
Ammonium ion concentration was a factor of two higher in North American air masses compared to Asian air masses. Lastly, mean nitrate (median values are below the LOD) ion concentration in North American plumes (0.07 µg sm−3)
was 7 times higher than observed in Asian air masses (0.01 µg sm−3, Table 1), though nitrate was only infre-quently observed above LOD for Asia interceptions (1% of measurements were above LOD).
Most of the observations of sulfate and WSOC were rep-resentative of more regional conditions. This was especially true for the North American air masses. The ratio of mean to median concentration can provide some indication to the extent of large anomalous plumes in the data set. Inter-ceptions of unique plumes with concentrations significantly above the regional values would lead to mean/median ra-tios significantly larger than 1. Asian sulfate and WSOC had mean/median ratios of 1.6 and 2.5, respectively, whereas North American air masses had ratios of 0.95 (sulfate) and 1.2 (WSOC). In both Asian and North American air WSOC and sulfate were not correlated (r2<0.03), suggesting differ-ent sources and atmospheric processing.
3.2 Altitude profiles of WSOC and sulfate
To provide a more detailed comparison on the distribution of aerosol composition, and for comparison with other studies,
Table 1. Statistical summary of PILS observations during INTEX-B field campaign, including all data, observations mainly influenced by
Asian emissions, and observations mainly influenced by North American emissions (according to Flexpart continental emissions product). Data includes all 10 local research flights as well as the two transit flights. For measurements below the detection limit, 1/2 the LOD was used in the statistical calculations. Time resolution for ion data is 60 second integral for anions, and 90 second integral for cations. WSOC data has been averaged to each Flexpart model run (approx every 30–60 s; refer to Flexpart summary for more information). All concentrations are µg sm−3for ion data, and µgC sm−3for WSOC at standard T and P (273◦K and 1 atm, respectively).
All Data LOD n % above LOD Median Mean 1σ Meangeo 1σgeo Max Min
Sodium 0.1 1652 10.2% 0.05 0.09 0.17 0.06 0.66 1.8 0.05 Ammonium 0.1 1846 37.1% 0.10 0.21 0.24 0.08 0.7 3.2 0.05 Calcium 0.1 1664 0.1% 0.05 0.05 0.01 0.05 0.05 0.4 0.05 Potassium 0.5 1664 0.0% 0.25 0.25 0.0 0.25 0.0 0.25 0.25 Magnesium 0.1 1846 0.0% 0.05 0.05 0.0 0.05 0.0 0.05 0.05 Sulfate 0.02 3452 96.7% 0.59 0.77 0.74 0.50 1.10 7.03 0.01 Nitrate 0.02 3464 5.0% 0.01 0.03 0.14 0.01 0.70 1.01 0.01 Chloride 0.1 3452 0.2% 0.05 0.05 0.02 0.05 0.08 1.2 0.05 WSOC 0.1 3644 67.1% 0.3 0.6 0.8 0.25 1.47 5.7 0.1
Asia LOD n % above LOD Median Mean 1σ Meangeo 1σgeo Max Min
Sodium 0.1 669 6.7% 0.05 0.08 0.12 0.06 0.56 1.10 0.05 Ammonium 0.1 752 39.9% 0.05 0.16 0.20 0.10 0.93 1.20 0.05 Calcium 0.1 676 0.0% 0.05 0.05 0.00 0.05 0.00 0.05 0.05 Potassium 0.5 676 0.0% 0.25 0.25 0.00 0.25 0.00 0.25 0.25 Magnesium 0.1 752 0.0% 0.05 0.05 0.00 0.05 0.00 0.05 0.05 Sulfate 0.02 1235 96.2% 0.42 0.68 0.82 0.41 1.14 6.83 0.01 Nitrate 0.02 1235 1.5% 0.01 0.01 0.02 0.01 0.29 0.65 0.01 Chloride 0.1 1235 0.2% 0.05 0.05 0.01 0.05 0.06 0.2 0.05 WSOC 0.1 1742 56.5% 0.2 0.5 0.6 0.19 1.37 4.3 0.1
North American LOD n % above LOD Median Mean 1σ Meangeo 1σgeo Max Min
Sodium 0.1 110 6.4% 0.05 0.08 0.18 0.06 0.56 1.70 0.05 Ammonium 0.1 119 60.5% 0.10 0.26 0.40 0.14 1.05 3.20 0.05 Calcium 0.1 110 0.0% 0.05 0.05 0.00 0.05 0.00 0.05 0.05 Potassium 0.5 110 0.0% 0.25 0.25 0.00 0.25 0.00 0.25 0.25 Magnesium 0.1 119 0.0% 0.05 0.05 0.00 0.05 0.00 0.05 0.05 Sulfate 0.02 210 98.1% 0.84 0.80 0.34 0.68 0.78 1.92 0.01 Nitrate 0.02 211 0.0% 0.01 0.07 0.38 0.01 0.00 1.01 0.01 Chloride 0.1 210 0.0% 0.05 0.05 0.00 0.05 0.00 0.05 0.05 WSOC 0.1 434 83.4% 0.9 1.1 0.9 0.27 1.24 4.2 0.1
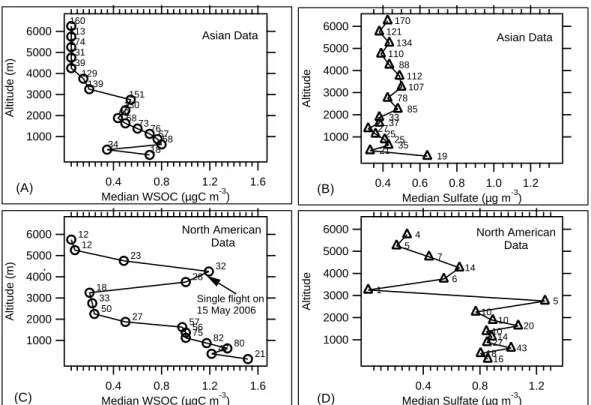
the median WSOC and sulfate altitude profiles are plotted for the Asian and North American air masses. Data were binned into 250 m intervals below 2500 m, and 500 m inter-vals above this altitude.
3.2.1 Asian WSOC and sulfate
As observed in other locations, Asian air mass WSOC con-centrations were highest near the surface. The median WSOC below 3 km was ∼0.4–0.8 µgC sm−3, whereas above this altitude WSOC concentration rapidly decreased to be-low the limit of detection (0.1 µgC sm−3). Measurements of OC on the Asian coast during ACE-Asia were very different. Huebert et al. (2004a) measured relatively constant OC con-centration with altitude, while Maria et al. (2003) measured
slightly decreasing concentrations with altitude. In both cases, the OC concentration at higher altitudes ranged from
∼2–10 µgC sm−3, or approximately 10–20 times higher than
WSOC observations at any altitude in our Asian air mass. A number of possibilities may explain the difference. The organic carbon measured in our study may not have been highly soluble and so not detected as WSOC (OC was mea-sured in ACE-Asia). Emissions from Asia could have been substantially different for these two different study peri-ods. The organic carbon aerosol may have been substan-tially diluted during transport, or the organic carbon was lost through, for example, precipitation scavenging.
It is unlikely that most of the OC remained insoluble since the air masses were well aged with transport times
6000 5000 4000 3000 2000 1000 Altitude (m) 1.6 1.2 0.8 0.4 Median WSOC (µgC m-3) 18 34 58 67 76 73 68 69130 151 139 129 139 131 174 113 160 Asian Data 6000 5000 4000 3000 2000 1000 Altitude (m) 1.6 1.2 0.8 0.4 Median WSOC (µgC m-3) 21 4780 82 75 56 57 27 50 33 18 28 32 23 12 12 North American Data Single flight on 15 May 2006 6000 5000 4000 3000 2000 1000 Altitude 1.2 1.0 0.8 0.6 0.4 Median Sulfate (µg m-3) 19 21 35 25 25 2737 33 85 78 107 112 88 110 134 121 170 Asian Data 6000 5000 4000 3000 2000 1000 Altitude 1.2 0.8 0.4 Median Sulfate (µg m-3) 16 18 43 2714 10 20 10 10 5 1 6 14 7 5 4 North American Data (D) (A) (C) (B)
Fig. 2. Altitude profiles of median WSOC and sulfate concentration. Data is grouped into 250 m altitude bins below 2 km, and 500 m bins
above 2 km. Number of observations for each bin are on the edge of the plot.
greater than ∼7 days. Aged air has ratios of oxygenated or-ganic matter to total oror-ganic matter, and hence WSOC/OC, typically near 1.0 (Zhang et al., 2007). Asian emissions have, if anything, increased in the last few years, so dif-ferences in emission cannot likely account for the factor of 10 to 20 lower WSOC measured along the Western United States coast. This is further supported by com-parisons of CO, an approximately inert tracer for anthro-pogenic or biomass burning sources on the time scales con-sidered here. CO recorded from the NASA P-3B aircraft (similar operating altitude range as the NSF C130 of ACE-Asia) during TRACE-P (held nominally concurrent with ACE-Asia) had mean CO of 178.3 ppb (1σ =±89.3 ppbv), and median CO was 158.6 ppbv (range: 67–808 ppbv), whereas in this study, INTEX-B Asian air masses had mean CO of 130.7 ppbv (1σ =±23.9 ppbv), and median CO was 133.1 ppbv (range: 72–316 ppbv). Assuming a spring-time background concentration of CO as 100 ppbv, and that emissions from Asia have not substantially changed since TRACE-P, this very roughly suggests that pollutant concen-trations decreased by a factor of 3 or less by dilution from transport across the Pacific (i.e, (mean TRACE-P CO minus background CO)/(mean INTEX-B CO minus background CO), or (178 ppb–100 ppb)/(131 ppbv–100 ppbv)). Based on these arguments it seems reasonable that loss in transport is a major cause for the relatively low WSOC concentrations observed in Asian air masses during INTEX-B. Satellite
ev-idence that suggests possible precipitation loss is discussed further in Sect. 3.3.
In contrast to WSOC, sulfate aerosol concentrations in the Asian plumes recorded near North America were relatively constant across the sampled altitude range. Figure 2 shows that, at altitudes below 3 km, median sulfate concentration was typically 0.35–0.50 µg sm−3. At higher altitudes, me-dian sulfate was 0.40–0.45 µg sm−3. These concentrations are substantially different than what was observed by Lee and coworkers (2003) near the Asian continent, where 8– 10 µg sm−3 of sulfate was recorded near the surface and a rapid decrease to ∼1–2 µg sm−3above 4km. Although the vertical profile is somewhat similar, again concentrations ap-pear to be significantly lower after advection, likely due to dilution and loss.
3.2.2 North American WSOC and sulfate
A somewhat similar altitude profile for WSOC was ob-served when the data was restricted to plumes mainly of North American influence. Overall, WSOC concentration decreased with increasing altitude. Below 2 km, WSOC con-centration was ∼1.0–1.5 µgC sm−3 and was mainly due to local Seattle emissions observed during take off and land-ing approaches, as well as some incidental air traffic control transiting near Seattle. A distinct increase in WSOC con-centration was observed between 3–5 km. These data were
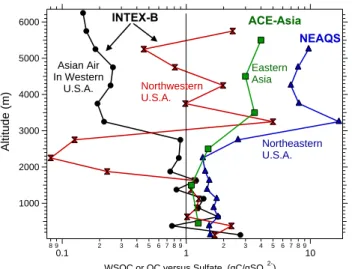
6000 5000 4000 3000 2000 1000 Altitude (m) 8 9 0.1 2 3 4 5 6 7 8 91 2 3 4 5 6 7 8 910 WSOC or OC versus Sulfate (gC/gSO4
2-) INTEX-B NEAQS Northwestern U.S.A. Asian Air In Western U.S.A. Northeastern U.S.A. ACE-Asia Eastern Asia
Fig. 3. Altitude profiles of the median ratio between WSOC or
OC and sulfate aerosol measured during INTEX-B for data seg-regated into Asian and North American air masses. For compari-son, also plotted are measurements off the Northeastern US mea-sured during NEAQS 2004, and data collected off the coast of Asia during ACE-Asia, spring 2001, adapted from Heald et al. (2005). INTEX-B and NEAQS data are WSOC/Sulfate, and ACE-Asia data are OC/Sulfate.
recorded on a single flight that occurred on 15 May 2006 near Nevada, U.S.A. and was due to air masses from the Califor-nia Central Valley (this plume is discussed more in Sect. 3.4). At altitudes above ∼5 km, WSOC concentration decreased to approximately 0.1 µgC sm−3. This is higher than similar al-titude WSOC concentrations in Asian air masses, which were below the LOD of 0.1 µgC sm−3, but similar to the WSOC concentrations of ∼0.3 µgC sm−3at ∼5 to 6 km altitude re-ported by Peltier et al. (2007a) near the Northeastern United States.
For sulfate aerosol, North American air masses were char-acterized by fairly uniform concentrations below 3 km alti-tude (∼0.8–1.0 µg sm−3), and significantly lower concentra-tions above 3 km (∼0.4 µg sm−3). The free troposphere sul-fate concentrations in North America air masses were sim-ilar to the free troposphere sulfate from Asian air masses, however, there are significantly fewer data available for an altitude profile of North American sulfate and thus not statis-tically significant.
3.3 WSOC-Sulfate ratio with altitude
As the two main components of fine particles in many re-gions, the ratio of OC or WSOC to sulfate can provide insight into differences in sources and processing. For example, in the Northeastern United States (NEAQS field campaign), the median ratio of WSOC to sulfate was observed to signifi-cantly increase with increasing altitude (Fig. 3) (Peltier et al., 2007a) suggesting that relative to sulfate, WSOC was either
more efficiently lofted, removed less efficiently, and/or pro-duced in situ at faster rates at altitudes between 3 and 5 km. That study concentrated on urban regions of the northeast, as well as a region densely populated with coal-fired power generation facilities located 500–900 km to the west of New York City. A similar dominance of organic aerosol at higher altitudes was also recorded within ∼1000 km from the coast of the Korean peninsula, Japan, and the Asian continent dur-ing ACE-Asia (Heald et al., 2005). These results are also plotted in Fig. 3.
NEAQS and ACE-Asia sampled relatively fresh emis-sions. In contrast, the Asian air masses recorded in this study along the Northwestern US coast had undergone long-range transport (6000–7000 km) and the altitude profile of WSOC/sulfate is much different. As shown in Fig. 3, the INTEX-B Asian WSOC/sulfate profile tends to decrease with increasing altitude with a WSOC/sulfate ratio signif-icantly below 1.0 in the free troposphere. On the other hand, INTEX-B North American observations were similar in trend to the results from NEAQS and ACE-Asia, with increasing WSOC/sulfate ratios above roughly 2 km a.s.l. (Fig. 3). However, free troposphere WSOC/sulfate ratios were not as high, possibly a result of Asian influence on the Northwestern United States aerosol climatology. Note that the much higher variability in the Northwestern US profile is likely due to a limited number of sulfate data points (see Fig. 2).
The differences in Asian air masses recorded in this study may be due to the effects of transport from Asia on WSOC and sulfate. A number of studies have shown that under clear skies the characteristic time-scale for secondary organic aerosol (SOA) formation in well defined urban plumes is on the order of ∼1 day (Sullivan et al., 2006; de Gouw et al., 2007), while the oxidation time constant for sulfate for-mation from SO2 is approximately 3–4 days (Brock et al.,
2007). Assuming the SOA and sulfate formation time con-stants described by these studies were similar for Asian out-flow, this mechanism, coupled with precipitation scavenging of aerosols followed by reformation of aerosol during ad-vection from Asia may be responsible for the WSOC/sulfate ratio observed in the free tropospheric Asian INTEX-B air masses.
In contrast to the free troposphere data (altitude roughly greater than 2 km), the ratio of WSOC to sulfate mass in the boundary layer varied less, ranging from approximately 1 to 2, regardless of the air mass origin. In these regions, WSOC and sulfate concentrations are generally much higher (Fig. 2), and this may be the cause of the observed lower variability in the WSOC/sulfate ratio.
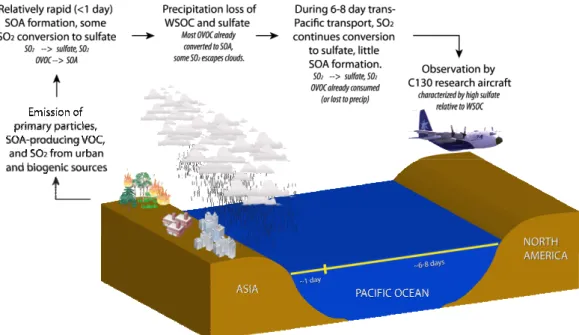
Eastern Asia and the north central Pacific Ocean re-gions were subjected to significant precipitation and cloud cover during the INTEX-B study period, according to infrared satellite images of convective influence (http:// bocachica.arc.nasa.gov/INTEX 2006/index.html). Figure 4 is a schematic representation of a possible explanation for
852
Figure 4: Schematic of sulfate and SOA formation near the Asian continent with
853
Fig. 4. Schematic of sulfate and SOA formation near the Asian continent with subsequent precipitation loss and sulfate replenishment during
transport. The schematic attempts to explain the differences in observed WSOC/Sulfate ratios recorded near Asia in other studies, and Asian air masses recorded near North America during this study.
observed differences between WSOC and sulfate at various locations that involves a combination of aerosol formation, loss, and replenishment. If most anthropogenic SOA (hence WSOC) is formed rapidly downwind of urban regions (de Gouw et al., 2005; Sullivan et al., 2006; de Gouw et al., 2007), much of the WSOC could be lost by precipitation scavenging during advection to North America. Any pri-mary WSOC from biomass burning and sulfate formed prior to precipitation would also be lost. However, aerosols can reform if the precursor gases penetrate the region of precip-itation. Measurements show that because SO2is not highly
water-soluble, sulfate can be reformed down-wind of precip-itating clouds (Weber et al., 2001; Brock et al., 2004). Our observation that WSOC concentration was much lower rel-ative to sulfate in the Asian air masses measured near the Northwestern United States suggests that there was little ref-ormation of WSOC in comparison to sulfate. One would ex-pect that some VOCs may also penetrate the clouds, but if this line of reasoning is correct, they apparently do not lead to significant concentrations of SOA. The overall result is that Asian sulfur emissions may be more readily transported long distances than organic aerosols and their precursor VOCs, and hence sulfate will tend to dominate Asian anthropogenic impacts in North America.
3.4 Investigating sources of WSOC
As the two main components of PM1.0 in this study, the
sources of sulfate and WSOC are of interest. Sulfate sources
are well established and generally well predicted in model simulations (Heald et al., 2005; Nowak et al., 2006), whereas this is not the case for carbonaceous aerosols, especially or-ganic carbon. For this reason, possible sources for WSOC measured in this study are investigated further.
3.4.1 CO, water vapor, and WSOC
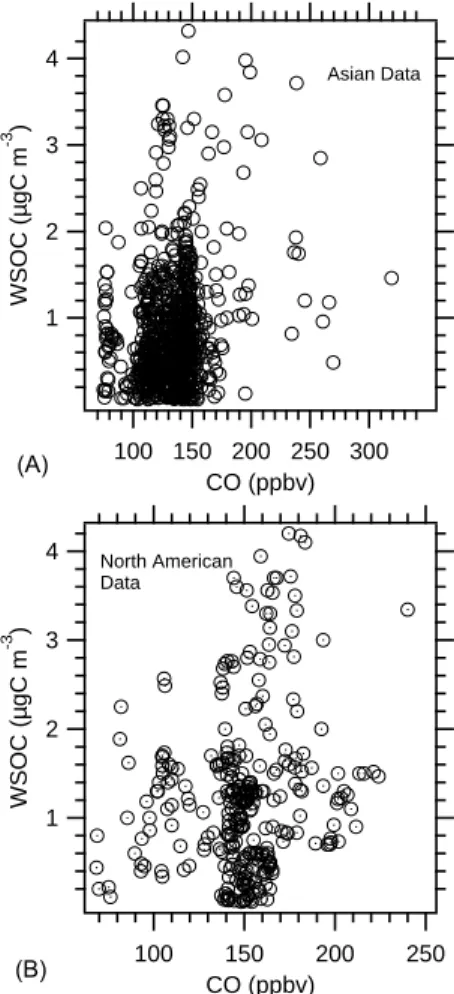
Our previous work focusing on SOA formation in urban plumes showed a strong correlation between WSOC and CO (Sullivan et al., 2006; de Gouw et al., 2007; Weber et al., 2007) indicating that WSOC and CO sources were strongly linked in some manner. Those studies involved airborne measurements in relatively fresh, well defined, urban plumes (aged <4 days). In contrast, the INTEX-B measurements were of well-aged Asian air masses that had undergone trans-Pacific transport (>7 days) and North American air masses mainly representative of regional conditions. WSOC and CO were not correlated (Fig. 5, r2=0.06 Asian, 0.08 North American) and WSOC could not be linked to specific sources using this method. However, there were two notable in-terceptions of plumes in the North America data set where enhancements in WSOC concentrations could be linked to a specific source region. On 3 May 2006, measurements were made in the vicinity of the California Central Valley and air trajectory analysis suggested Central Valley plumes of 1–2 days old. Other sources, such as urban regions along the California coast are also possible, however, we refer to these air masses as Central Valley plumes. These plumes
4 3 2 1 WSOC (µgC m -3 ) 300 250 200 150 100 CO (ppbv) Asian Data 4 3 2 1 WSOC (µgC m -3 ) 250 200 150 100 CO (ppbv) North American Data (A) (B)
Fig. 5. Univariate regression analysis of WSOC and CO for data
segregated into Asian (A) and North American (B) air mass data.
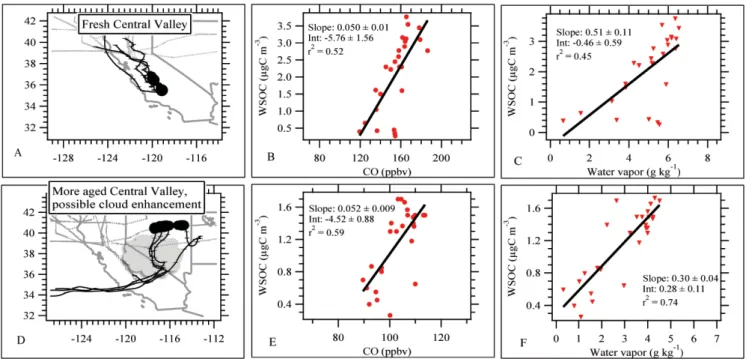
were intercepted at 21:50:30–22:05:00 UTC and again at 22:16:00–22:33:30 UTC at an altitude of 600 m a.s.l. On 15 May 2006, between 20:51 and 22:10 UTC, a region of en-hanced WSOC concentration was intercepted over North-ern Nevada at an altitude of 3 to 5 km a.s.l. This plume can be seen in North American median WSOC profile of Fig. 2. Flexpart indicated plumes from the Central Valley that were 2–3 days old. Maps showing the locations of both plumes are given in Fig. 6. The low altitude fresher plume was detected in a region of clear sky with broken cloud cover at altitudes of 6.4 km a.s.l., based on archived METARs from the Central Valley during the flight (available online at: http://vortex.plymouth.edu/sa parse-u.html). The air mass sampled may have been recently cloud processed, however, we have found no evidence that permits a strong conclusion either way. The second plume from the Central Valley was recorded directly down-wind of a heavily clouded region, based on both aircraft video and satellite data (cloud optical thickness based on MODIS Aqua).
For each of these flights, WSOC and CO were moderately correlated (Fig. 6). The coefficient of determination between WSOC and CO during the flight near the Central Valley was
0.52. The Central Valley plume that was intercepted after transport to the Northern Nevada region had a slightly higher correlation of r2=0.59. Univariate linear regression slopes of 50±1 and 52±9 µgC sm−3/ ppmv, respectively, were some-what higher than the range of slopes reported for New York City (Sullivan et al., 2006) and Atlanta, United States, (We-ber et al., 2007) urban plumes (30 to 40 µgC sm−3/ppmv).
Correlation between WSOC and water vapor in these plumes was also noteworthy (Fig. 6). Studies have shown that SOA formation may readily occur in aqueous solutions and may be enhanced by higher relative humidity (Lim et al., 2005; Matsunaga et al., 2005; Altieri et al., 2006; Carlton et al., 2006). Both water vapor concentration and relative humidity are moderately correlated with WSOC during the observation above the Central Valley (water vapor r2=0.45, Fig. 6; RH r2=0.40, not shown), and better correlated in the observation over Northern Nevada downwind of clouds (wa-ter vapor r2=0.74, RH r2=0.80). These plumes are further discussed in Sect. 3.4.3. In an attempt to discern contribu-tions of anthropogenic and biogenic sources to the WSOC observed in the Asian and North American air masses, and the Central Valley plumes, a multivariate regression analysis is performed.
3.4.2 Multivariate regression to investigate WSOC sources Measured VOCs, when compared with WSOC, may provide insights into specific WSOC sources. The previous analy-ses have focused on comparisons of WSOC with single vari-ables (e.g. CO, water vapor, altitude, etc.). In order to fur-ther identify WSOC sources, a multivariate linear regression model of WSOC and VOC data was constructed. Principle component analysis (PCA) is often used to identify general sources that have impacted ambient field studies that would not be apparent from a single correlation analysis (Hopke et al., 1998; Wang et al., 2000; Hopke et al., 2003; Millet et al., 2004, 2005, 2006; Quinn et al., 2006; Kim and Hopke, 2007; Shim et al., 2007). PCA is used to reduce a large number of variables into smaller and more meaningful sets of vari-ables that account for most of the observed variability in the dataset. Known sources for compounds can then be used in identifying the source for each principle component. This is particularly useful when a large number of variables are cor-related. A disadvantage to this technique is that inferences from specific variables are limited because they have been grouped together with like variables. Multivariate linear re-gression directly relates a dependent variable to a specific set of independent variables. In these techniques, multivari-ate linear regression coefficient variables can be compared to one another to provide some indication of the relative impor-tance of each variable. However, a significant disadvantage to this technique is that the results are largely dependant on the variables that are chosen for the regression analysis. The multivariate regression model is described in Eq. (1), where
Fig. 6. (A) Location of relatively fresh, low altitude Central Valley plumes with 96 h HYSPLIT back trajectories. Shaded box represents
Central Valley; (B) Univariate regression analysis of WSOC and CO; (C) WSOC and water vapor for Central Valley California plumes; (D) Location of Central Valley plume (black circles) over Nevada with 96 h HYSPLIT back trajectories. Shaded box represents Central Valley, and cartoon represents region of clouds observed directly downwind of the measurements; (E) Univariate regression analysis of WSOC and CO; (F) WSOC and water vapor for cloud-influenced Central Valley California plumes.
β0is the intercept, and β1to βi are the regression coefficients
for independent variables x1to xi.
y = βo+β1x1+β2x2+. . . βixi (1)
There were a number of VOC measurements made aboard the C130 research aircraft that can be used as tracers of fossil fuel combustion or biogenic (including biomass burn-ing) emissions. Fossil fuel combustion VOCs chosen for this analysis were mainly alkanes and aromatics. Biogenic VOCs were mainly alcohols and organic acids, and also in-cluded acetonitrile, a gas tracer for biomass burning. The VOCs selected for fitting with WSOC are summarized in Table 2. While none of the selected VOCs are perfectly unique tracers for fossil fuel combustion, biomass burning, or biogenic-non-biomass burning sources, compounds that have been shown to be emitted by mainly fossil fuel combus-tion or mainly biogenic sources were selected (Guenther et al., 1995; Heikes et al., 2002; Jacob et al., 2002; Spaulding et al., 2003; Singh et al., 2004; Jacob et al., 2005; Lewis et al., 2005). For example, acetonitrile does have some small industrial sources, and may be formed as a secondary com-pound, but the largest source of acetonitrile in the atmosphere is from biomass burning (Reiner et al., 2001; de Gouw et al., 2003).
Because the frequency distribution of the bulk concentra-tion data were lognormally distributed, prior to regression
analysis, the natural log for each data point for all variables was calculated to transform the frequency distributions to more normal distributions. Subtracting the geometric mean concentration or mixing ratio from each measurement, and then dividing by the variable geometric standard deviation, standardized the dataset for each variable. This shifts the mean of the sample to 0 and standardizes the data variabil-ity (e.g. 1σ =±1, 2σ =±2, etc.). The transformation elimi-nates potential bias introduced into the model caused by the wide range of concentrations observed in the dataset, giv-ing equal weight to all variables independent of magnitude. Model multivariate linear regression coefficients can then be compared to one another without consideration to original concentration of the variables (Kim and Ferree, 1981). Our interest here is the source of VOCs with highest coefficients (e.g., fossil fuel, biogenic, biogenic from biomass burning).
Backward stepwise multivariate linear regression analysis was performed on the data to model WSOC concentration, where a variable was included when the t-statistic exceeded 2 (i.e., significant at the 5% level). The variables were also checked for multicollinearity and if found, one variable was removed from the model to eliminate redundancy. The in-dependent variables listed in Table 2 were used to analyze the dataset, and include many VOCs that have atmospheric lifetimes greater than the expected transport time from Asia (∼5–8 days). Fossil fuel and biogenic VOC variables were
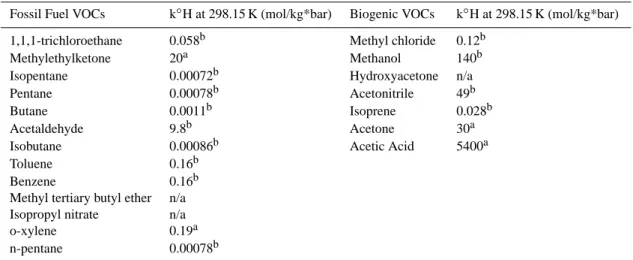
Table 2. Summary of independent variables and their Henry’s Law Constant values used to fit multivariate regression model. The VOCs are
separated into either mainly from fossil fuel combustion, or biogenic sources, which includes biomass burning (acetonitrile) and secondary VOCs linked to biogenic emissions.
Fossil Fuel VOCs k◦H at 298.15 K (mol/kg*bar) Biogenic VOCs k◦H at 298.15 K (mol/kg*bar) 1,1,1-trichloroethane 0.058b Methyl chloride 0.12b
Methylethylketone 20a Methanol 140b
Isopentane 0.00072b Hydroxyacetone n/a
Pentane 0.00078b Acetonitrile 49b
Butane 0.0011b Isoprene 0.028b
Acetaldehyde 9.8b Acetone 30a
Isobutane 0.00086b Acetic Acid 5400a
Toluene 0.16b
Benzene 0.16b
Methyl tertiary butyl ether n/a Isopropyl nitrate n/a
o-xylene 0.19a
n-pentane 0.00078b
aadapted from Staudinger and Roberts (1996) badapted from Yaws (1992)
combined in the regression model to predict WSOC variabil-ity. It should be noted that this analysis does not predict whether specific VOCs form WSOC, rather it uses VOCs as tracers to describe conditions when WSOC can be observed. As a result of using a linear multivariate regression anal-ysis, it is not likely that the model will fully capture WSOC variability. The C130 research aircraft was equipped to mea-sure just ∼60 different VOCs by several different analytical techniques. Since WSOC formation involves highly complex and, as of yet, largely unknown VOC chemistry, there are un-doubtedly a number of VOCs that play an important role in WSOC formation but were not included in the regression.
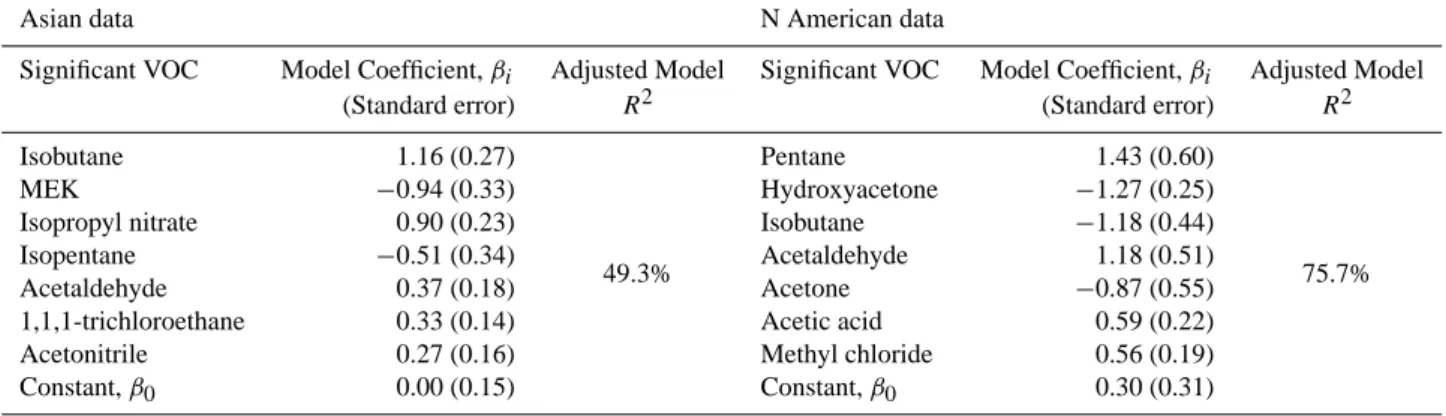
Table 3 summarizes the multivariate regression analysis for INTEX-B data that is mainly influenced by Asian emis-sions. The combined VOC sources of WSOC account for 49.3% of the observed variability. Thus, a significant fraction of WSOC variability is unaccounted for in this analysis. Sev-eral factors that were not quantified could explain the miss-ing variability in the regression model. For example, cloud and precipitation losses of WSOC aerosol, which does not result in appreciable losses of VOCs, is one such mechanism that might explain the discrepancy. Similarly, VOCs may have been transformed in ways that do not lead to WSOC formation, resulting in a change in VOC concentration but no change in WSOC. Also, since observed WSOC concen-tration in Asian air masses was frequently below the limit of detection, it is not surprising that this model does not capture all of the variability for well-aged (and traveled) air masses. Regression analysis of North American air masses yielded different results (Table 3). Overall, these covariates explain 75.7% of the WSOC variability.
Comparing the standardized multivariate linear regression coefficients (Table 3) may provide some insight into gen-eralized sources of WSOC. The absolute values of coeffi-cients have been ranked from largest to smallest (Table 3). The absolute value is used since any process that leads to WSOC variability is of interest. For example, a negative co-efficient could imply that the processes that produce WSOC are also, in some way, linked to loss of that VOC. A positive coefficient could result if the VOC and WSOC have similar sources. This points out a limitation with this method that in-troduces uncertainty with this analysis; some covariability of a VOC with WSOC may not be linked to WSOC formation in any physical manner. For example, WSOC formed in high oxidizing environments can lead to more WSOC, but some VOCs not linked to WSOC in any way may also be lost, in-dependent of the VOC source (biogenic or anthropogenic).
Fossil fuel combustion VOC tracers are most closely asso-ciated with WSOC concentration in Asian plumes (Table 3). Isobutane, methyl ethyl ketone (MEK), and isopropyl nitrate coefficients are significantly larger than the remaining regres-sion variables (it is noted, however, that all variables in this analysis are significant since each has been evaluated by stu-dent t-test). The remaining coefficients, including acetoni-trile, a biomass burning tracer, contribute to variability in WSOC, but fossil fuel combustion VOCs explain most of the variability that could be accounted for in this model.
In contrast, North American WSOC that was observed in the Western U.S. is more closely associated with both bio-genic and fossil fuel combustion VOCs. Pentane and hy-droxyacetone are the largest contributors to WSOC variabil-ity. Pentane is a VOC associated with fossil fuel combustion,
Table 3. Multivariate linear regression coefficients for selected VOC independent variables described in Table 2. Data has been split (using
Flexpart) into air masses mainly influenced by North America, and air masses mainly influenced by Asia.
Asian data N American data
Significant VOC Model Coefficient, βi Adjusted Model Significant VOC Model Coefficient, βi Adjusted Model
(Standard error) R2 (Standard error) R2
Isobutane 1.16 (0.27) Pentane 1.43 (0.60)
MEK −0.94 (0.33) Hydroxyacetone −1.27 (0.25)
Isopropyl nitrate 0.90 (0.23) Isobutane −1.18 (0.44)
Isopentane −0.51 (0.34)
49.3% Acetaldehyde 1.18 (0.51) 75.7%
Acetaldehyde 0.37 (0.18) Acetone −0.87 (0.55)
1,1,1-trichloroethane 0.33 (0.14) Acetic acid 0.59 (0.22)
Acetonitrile 0.27 (0.16) Methyl chloride 0.56 (0.19)
Constant, β0 0.00 (0.15) Constant, β0 0.30 (0.31)
and hydroxyacetone is a photo oxidation product of isoprene (Yu et al., 1995). Other significant fossil fuel combustion VOCs that contribute to WSOC variability include isobutane and acetaldehyde. Significant biogenic VOCs include ace-tone, acetic acid, and methyl chloride. These results sug-gest that both biogenic (but not biomass burning) and anthro-pogenic sources contributed to WSOC variability in North American air masses that impact the Western United States. In the North American data set, WSOC variability was not significantly affected by acetonitrile, indicating a limited in-fluence on WSOC by biomass burning.
The contrast between the regression results for Asian ver-sus North American air masses is also consistent with ex-pectations. Higher anthropogenic sources of WSOC relative to biogenic sources in Asian air masses versus Northwestern United States air masses are expected given the proportions of anthropogenic and biogenic sources in the two regions. Asian emissions from more northern regions (e.g., China) advected westward are heavily influenced by large popula-tion centers, whereas the Northwestern United States is not highly populated but is heavily forested.
3.4.3 Regression analysis on WSOC Central Valley plumes The regression was performed in the same manner for the two California Central Valley plumes encountered during INTEX-B. The first Central Valley plume (low altitude mea-surements made near the valley) was characterized by ele-vated VOCs and WSOC (2–4 µgC sm−3). Due to data
avail-ability limitations, hydroxyacetone and acetic acid (both bio-genic VOCs) are not included in the analysis. There are, however, a number of other VOCs included in the regres-sion analysis (Table 2) that can be used to identify biogenic sources. Thus, we may not be able to directly compare these results with the Asian and North American air mass regressions. Methylethylketone (MEK), methanol, and pen-tane are statistically significant VOCs that were identified
in the regression model predicting WSOC variability (Ta-ble 4). Methylethylketone and pentane are associated with fossil fuel combustion. In contrast, methanol sources are predominately biogenic, though there is evidence of small sources related to fossil fuel combustion (Jacob et al., 2005) (methanol from fossil fuel combustion accounts for ∼1–2% of global methanol loading). Comparing multivariate linear regression coefficients (again, using the absolute value), bio-genic sources are similar (0.97±0.13, Table 4) to fossil fuel combustion sources (6β=1.74±0.46 by RMS) for WSOC
variability, suggesting that in the Central Valley, WSOC is related to both fossil fuel combustion and biogenic sources of VOCs. This model accounts for ∼98.2% of the variability of WSOC (Table 4).
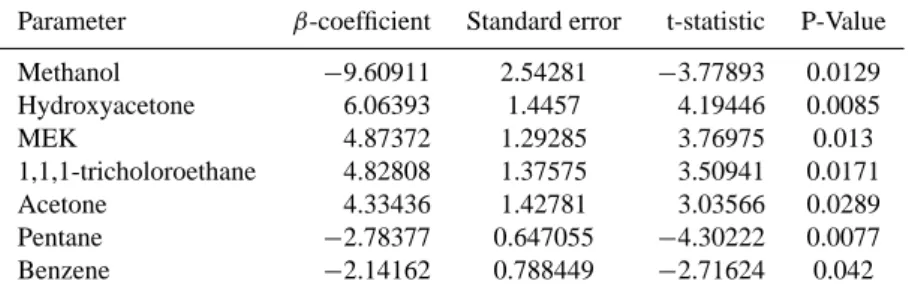
The second Central Valley plume intercepted over North-ern Nevada in a region directly downwind of extensive clouds was characterized by elevated WSOC concentrations (1– 2 µgC sm−3), elevated oxygenated VOCs (e.g. methanol, acetic acid, acetone), and CO, and relatively low anthro-pogenic VOCs (e.g. benzene). For this plume, a number of statistically significant VOCs were observed in the multiple regression model of WSOC variability. Methanol and hy-droxyacetone – both biogenic VOC tracers – comprise the largest multivariate linear regression coefficients of all pa-rameters tested (Table 2). MEK and 1,1,1-tricholorethane, which are associated with fossil fuel combustion, and ace-tone (a biogenic tracer) have similar β-coefficients (Table 5), and are somewhat less important. Lastly, pentane and ben-zene, two VOCs associated with fossil fuel combustion, are also significant determinants of WSOC variability, though their β-coefficients are considerably smaller than the other VOCs (Table 5). The model accounts for 92.6% of the vari-ability of WSOC during observations downwind of clouds. By summing the significant VOCs by their β-coefficient, bio-genic sources appear to be most related to WSOC variability (∼66%), though fossil fuel combustion VOC tracers also ap-pear to be involved (∼33%).
Table 4. Multivariate linear coefficients and statistics for selected VOC independent variables described in Table 2. Data is from a single
plume during a flight on 3 May 2006 in the Central Valley of California.
Parameter β-coefficient Standard error t-statistic P-Value MEK −1.22136 0.429068 −2.84655 0.0159 Methanol 0.97262 0.130999 7.42463 0 Pentane 0.52521 0.174838 3.00398 0.012 Adjusted model R2=98.2%.
Table 5. Multivariate linear regression coefficients and statistics for selected VOC independent variables described in Table 2. Data is from
a single plume during a flight on 15 May 2006 in Northern Nevada.
Parameter β-coefficient Standard error t-statistic P-Value Methanol −9.60911 2.54281 −3.77893 0.0129 Hydroxyacetone 6.06393 1.4457 4.19446 0.0085 MEK 4.87372 1.29285 3.76975 0.013 1,1,1-tricholoroethane 4.82808 1.37575 3.50941 0.0171 Acetone 4.33436 1.42781 3.03566 0.0289 Pentane −2.78377 0.647055 −4.30222 0.0077 Benzene −2.14162 0.788449 −2.71624 0.042 Adjusted model R2=92.6%.
Despite having similar source regions (i.e., roughly same region of the Central Valley or urban regions on California coast, as indicated by Flexpart), WSOC for each plume ap-pears to have a different association with VOCs. Based on vi-sual and satellite evidence of clouds in the vicinity during the Nevada flight segment, higher correlations with water vapor (Fig. 6), and differences in altitudes at which the two Cen-tral Valley plumes were detected, the Nevada plume is more likely to have been recently influenced by cloud processing. Recent work by Sorooshian et al. (2006, 2007) has shown that clouds efficiently produce SOA, with highest concentra-tions of SOA frequently observed above clouds. Thus, SOA formation by clouds may account for some of the differences in multiple regression results.
In the cloud-outflow region, the overall analysis result is suggestive of WSOC (i.e., SOA) formation by heterogeneous processes involving liquid water and biogenic VOCs, as has been proposed in a number of other studies (Pun et al., 1999, 2002; Tsigaridis and Kanakidou, 2003; Baltensperger et al., 2005; Hartz et al., 2005; Hastings et al., 2005; Lim et al., 2005; Na et al., 2006; Varutbangkul et al., 2006). This type of mechanism may, at least in part, explain the generally higher WSOC/sulfate ratios (e.g., Fig. 3) observed in free tropospheric continental air masses in this and other studies (Peltier et al., 2007a), and may explain poor model prediction of free tropospheric organic aerosol mass and spatial distri-butions (Heald et al., 2005, 2006).
4 Conclusions
Airborne measurements in spring 2006 of fine particle (PM1.0) bulk chemical composition were made from the
surface to ∼7 km attitude over Western United States and Canada, and the Eastern Pacific Ocean. The online mea-surements included ionic species chloride, nitrate, sulfate, sodium, ammonium, potassium, calcium and magnesium, and the water-soluble organic carbon (WSOC) fraction of the organic aerosol. Data were analyzed separately according to continental source by using the Flexpart dispersion model to identify continents of influence based on CO sources. A par-ticular emphasis on WSOC sources is discussed.
Submicron aerosol mass was dominated by water solu-ble organic carbon and sulfate, with additional contribution to mass by ammonium, nitrate and sodium ions. WSOC concentration was highest in North American air masses (median=0.9 µgC sm−3), and lower in Asian outflow (me-dian=0.2 µgC sm−3). Overall, sulfate aerosol had similar concentrations for Asian and North American observations.
WSOC concentration was highest at lowest altitude ranges in both North American and Asian air masses, though several enhancements in particular altitude ranges were observed. WSOC was also compared to sulfate concentration, and an-alyzed across altitude. Contrary to previous findings near Asia and near the Northeastern United States, the ratio of WSOC-to-sulfate in aged Asian air masses tended to de-crease with altitude. Consistent with the mechanism pro-posed by Brock et al. (2004), we propose this was likely
caused by precipitation loss of aerosol prior to observation, followed by preferential replenishment of sulfate aerosol as the air mass was transported across the Pacific. Since obser-vations were generally not of fresh, urban emissions, WSOC and CO were poorly correlated. However, in two distinct WSOC plumes observed during this experiment, WSOC and CO were well correlated (r2=0.5 to 0.6). A similar finding was observed when comparing WSOC with water vapor mix-ing ratio.
Both Asian and North American plumes were investigated by multivariate regression analysis using a number of tracer VOCs that were representative of fossil fuel combustion or biogenic emissions (including biomass burning). In Asian air masses, VOCs that are mainly from fossil fuel combus-tion sources were most closely related to WSOC variability. Biogenic VOCs did not substantially contribute to the ob-served variability of WSOC in Asian air masses. However, the regression model has significant variability that cannot be explained by the measured VOCs, and this is likely re-lated to the long transport time and possible cloud scaveng-ing or precipitation loss affectscaveng-ing Asian aerosols. In contrast, a multivariate regression of North American aerosols that im-pacts the Western United States shows that WSOC variabil-ity is driven by a combination of fossil fuel combustion and biogenic VOCs. This regression model explained a greater amount of WSOC variability (∼75%).
The North American air mass data observed during this study were further refined to include only Central Valley outflow (with possible contributions from other urban re-gions), and compared a relatively fresh plume (aged 1– 2 days) with a somewhat aged (2–3 days) plume that ap-peared to be recently advected through clouds. Multivari-ate regression analysis revealed that both biogenic and fos-sil fuel combustion VOCs were nearly equally responsible for WSOC variability in relatively fresh plumes. In contrast, biogenic VOCs appear to have a significantly stronger as-sociation with WSOC variability in a plume with stronger evidence for cloud processing (∼2/3 biogenic to ∼1/3 fossil fuel combustion). This may also have resulted in a somewhat higher 1WSOC/1CO regression slope for cloud-processed air masses (∼50 µgC sm−3/ppmv), than what has been ob-served in other urban plumes (30 to 40 µgC sm−3/ppmv). Cloud processing of biogenic VOCs may be an important mechanism for free tropospheric WSOC (SOA) formation, explaining enhanced WSOC concentrations above ∼2 km al-titude in this and other studies.
Acknowledgements. The authors acknowledge the invaluable
assistance of the C130 aircraft support team from National Center for Atmospheric Research, and from NASA Earth Science Support Office. This work was funded by NASA under contract NNG06GA68G.
Edited by: H. Singh
References
Altieri, K. E., Carlton, A. G., Lim, H. J., Turpin, B. J., and Seitzinger, S. P.: Evidence for oligomer formation in clouds: Re-actions of isoprene oxidation products, Environ. Sci. Technol., 40, 4956–4960, 2006.
Apel, E. C., Hills, A. J., Lueb, R., Zindel, S., Eisele, S., and Riemer, D. D.: A fast-GC/MS system to measure C2 to C4carbonyls
and methanol aboard aircraft, J. Geophys. Res., 108, 15–11, doi:10.1029/2002JD003199, 2003.
Baltensperger, U., Kalberer, M., Dommen, J., Paulsen, D., Alfarra, M. R., Coe, H., Fisseha, R., Gascho, A., Gysel, M., Nyeki, S., Sax, M., Steinbacher, M., Prevot, A. S. H., Sjogren, S., Wein-gartner, E., and Zenobi, R.: Secondary organic aerosols from anthropogenic and biogenic precursors, Faraday Discuss., 130, 265–278, 2005.
Bertschi, I. T. and Jaffe, D. A.: Long-range transport of ozone, carbon monoxide, and aerosols to the NE Pacific troposphere during the summer of 2003: Observations of smoke plumes from Asian boreal fires, J. Geophys. Res.-Atmos., 110, D05303, doi:10.1029/2004JD005135, 2005.
Brock, C. A., Hudson, P. K., Lovejoy, E. R., Sullivan, A., Nowak, J. B., Huey, L. G., Cooper, O. R., Cziczo, D. J., de Gouw, J., Fehsenfeld, F. C., Holloway, J. S., Hubler, G., Lafleur, B. G., Murphy, D. M., Neuman, J. A., Nicks, D. K., Orsini, D. A., Parrish, D. D., Ryerson, T. B., Tanner, D. J., Warneke, C., We-ber, R. J., and Wilson, J. C.: Particle characteristics following cloud-modified transport from Asia to North America, J. Geo-phys. Res., 109, 1–18, doi:10.1029/2003JD004198, 2004. Brock, C. A., Sullivan, A. P., Peltier, R. E., Weber, R. J., Wollny,
A., de Gouw, J. A., Middlebrook, A. M., Atlas, E. L., Stohl, A., Trainer, M. K., Cooper, O. R., Fehsenfeld, F. C., Frost, G. J., Holloway, J. S., H¨ubler, G., Neuman, J. A., Ryerson, T. B., Warneke, C., and Wilson, J. C.: Sources of Particulate Matter in the Northeastern United States: 2. Evolution of Chemical and Microphysical Properties, J. Geophys. Res., accepted 2007. Carlton, A. G., Turpin, B. J., Lim, H. J., Altieri, K. E., and
Seitzinger, S.: Link between isoprene and secondary organic aerosol (SOA): Pyruvic acid oxidation yields low volatility organic acids in clouds, Geophys. Res. Lett., 33, L06822, doi:10.1029/2005GL025374, 2006.
de Gouw, J., Warneke, C., Karl, T., Eerdekens, G., van der Veen, C., and Fall, R.: Sensitivity and specificity of atmospheric trace gas detection by proton-transfer-reaction mass spectrometry, Int. J. Mass Spectrom., 223, 365–382, 2003.
de Gouw, J. A., Cooper, O. R., Warneke, C., Hudson, P. K., Fehsen-feld, F. C., Holloway, J. S., Hubler, G., Nicks, D. K., Jr., Nowak, J. B., Parrish, D. D., Ryerson, T. B., Atlas, E. L., Donnelly, S. G., Schauffler, S. M., Stroud, V., Johnson, K., Carmichael, G. R., and Streets, D. G.: Chemical composition of air masses trans-ported from Asia to the U.S. West Coast during ITCT 2K2: fossil fuel combustion versus biomass-burning signatures, J. Geophys. Res., 109, D23S20, doi:10.1029/2003JD004202, 2004. de Gouw, J. A., Middlebrook, A. M., Warneke, C., Goldan, P.
D., Kuster, W. C., Roberts, J. M., Fehsenfeld, F. C., Worsnop, D. R., Canagaratna, M. R., Pszenny, A. A. P., Keene, W. C., Marchewka, M., Bertman, S. B., and Bates, T. S.: Budget of organic carbon in a polluted atmosphere: Results from the New England Air Quality Study in 2002, J. Geophys. Res., 110, 22, D16305, doi:10.1029/2004JD005623, 2005.