Demand Estimation and Fleet Management for
Autonomous Mobility on Demand Systems
by
Justin Lee Miller
B.S., Arizona State University (2009)
S.M., Massachusetts Institute of Technology (2011)
Submitted to the Department of Mechanical Engineering
in partial fulfillment of the requirements for the degree of
Doctor of Philosophy
at the
MASSACHUSETTS INSTITUTE OF TECHNOLOGY
September 2017
MA %H SET~S INSTITUTE - TEOF TTEHNIQLOGYEPfj2j2017
LIBRARIES
ARCHVES
@
Massachusetts Institute of Technology 2017. All rights reserved.
Author ...
Certified by...
Signature redacted
Department of Mechanical Engineering
Signature
redacted
August
14, 2017
Jonathan P. How
Richard Cockburn Maclaurin Professor of Aeronautics and Astronautics
, Thesi:,,Supervisor
Certified by...
Signature redacted
Sanjay E. Sarma
Fred Fort Flowers and Daniel Fort Flowers
Professor of Mechanical Engineering
Certified by...
Accepted by ...
Cha4man,. Thesis Committee
Signature redacted
Stephen C. Graves
Abraham J. Siegel Professor of Management Science
and Professor of Mechanical Engineering
jut- - MerubcThesis
CommitteeSignature redacted
...
Rohan Abeyaratne
Chairman, Department Committee on Graduate Theses
Demand Estimation and Fleet Management for Autonomous
Mobility on Demand Systems
by
Justin Lee Miller
Submitted to the Department of Mechanical Engineering on August 14, 2017, in partial fulfillment of the
requirements for the degree of Doctor of Philosophy
Abstract
Mobility On Demand (MOD) systems are creating a paradigm shift in transportation, where mobility is provided not through personally owned vehicles but rather through a fleet of shared vehicles. To maintain a high customer quality of service (QoS), MOD systems need to manage the distribution of vehicles under spatial and temporal fluctuations in customer demand.
A challenge for MOD systems is developing and informing a customer demand model. A new proactive demand model is presented which correlates real-time traffic data to predict customer demand on short timescales. Traditional traffic data collection approaches use pervasive fixed sensors which are costly for system-wide coverage. To address this, new frameworks are presented for measuring real-time traffic data using MOD vehicles as mobile sensors. The frameworks are evaluated using hardware and simulation implementations of a real-world MOD system developed for MIT campus. First, a mobile sensing framework is introduced that uses camera and Lidar sensors onboard MOD shuttles to observe system-wide traffic. Through a principled approach for decoupling dependencies between observation data and vehicle motion, the framework provides traffic rate estimates comparable to those of costly fixed sensors. Second, an active sensing framework is introduced which quantifies demand uncertainty with a Bayesian model and routes mobile sensors to reduce parameter uncertainty. The active sensing framework reduces error in demand estimates over both short and long timescales when compared to baseline approaches.
Given estimates of customer demand, the challenge for MOD systems is maintaining high customer QoS through fleet management. New automated fleet management planners are introduced for improving customer QoS in ride hailing, ride requesting, and ridesharing MOD operating frameworks. The planners are evaluated using data-driven simulation of the MIT MOD system. For ride hailing, to address the challenge of missed customers, a chance-constrained planner is introduced for positioning vehicles at likely customer hailing locations. The chance-constrained planner provides a significant improvement in the number of served hailing customers over a baseline exploration approach. For ride requesting, to address the challenge of high customer wait times, a
predictive positioning planner is introduced to position vehicles at key locations in the MOD system based on customer demand. The predictive positioning planner provides a reduction in service times for requesting customers compared to a baseline waiting approach. For ridesharing, incorrect assumptions on customer preference for transit delays can lead to poor realized customer QoS. A ridesharing planner is introduced for assigning customers to vehicles based on a trained ratings-based QoS model. The ridesharing planner provides robust performance over a range of unknown customer preferences compared to approaches with assumed customer preferences.
Thesis Supervisor: Jonathan P. How
Acknowledgments
The PhD experience for me has been more than just the process of obtaining a degree or a check-mark on my resume, it has been a phase of life that has provided me with personal and professional growth. There are many people that I'd like to thank for their support of me and this work along the way.
First, I'd like to thank my advisor, Professor Jonathan How. I joined Jon's lab halfway through my PhD program, and at that time, I had no clue how I was ever going to make it out. Over these past few years, Jon has pushed me and taught me the proper way to go about research. His advice on every aspect of my thesis, from building hardware, to formulating problem statements, to submitting papers, is ultimately what got me through to the end.
I'd like to thank my committee chair Professor Sanjay Sarma. I'm grateful to Sanjay for mentoring me throughout my entire PhD process, providing advise on both research and life. I would also like to thank Professor Stephen Graves for joining my committee and providing valuable feedback and encouragement.
I'm grateful to the graduate students and postdoc that have shared their time with me in ACL. In particular, I would like to thank Mark Cutler and Shih-Yuan Liu for their invaluable support early on and passing down their knowledge of ROS, programming, and paper writing. I want to thank fellow Ford project team members, Andres Hasfura, Steven Chen, and Michael Everett, for their support with the project, and for all those late nights where we worked hard to create awesome demos and videos. I want to thank fellow building 41 members (including Brett Lopez) for helping to make working on robots fun. I also need to acknowledge the support of my small army of UROPs who have helped me to develop all of the hardware for this thesis: Jan Carius, Robert Tran, Alex Gilbert, Wally Wibowo, Victor Zhang, Angel Echevarria, Matt Deyo, Yun Chang, Ronnie Ogden, Rockey Hester, Nicolas Lanzetti, and Emmanuel Akinbo. I also want to acknowledge all the MIT MOD shuttle drivers who helped me collect data, Ian, Samantha, Ricky, Jolly, Anna, Hosea, and Kenneth, as well as all of the anonymous MIT students who used the MOD service in order to
provide me with the data that I needed. I am grateful to the ACL admins Quentin Alexander and Bryt Bradley who ordered and processed every piece of hardware that I ever needed for the project.
I would like to acknowledge the support of Ford Motor Company who sponsored my work through the Ford-MIT alliance, providing me with an interesting research project and the funding to accomplish it.
Finally, I would like to thank those who have supported me outside of the lab over all these years. I want to thank my friends for helping to make the grad school experience fun and I want to thank my family for their constant love and encouragement over all of these years. I am grateful to my loving girlfriend Samantha for her role in my life, for the fun times both home and abroad, and for being by my side through the toughest times. Lastly, I want to thank God for blessing me with the opportunity and abilities needed to study at the greatest engineering school in the world, I owe it all to Him.
1 Introduction
1.1 Motivation . . . . 1.2 MOD Operating Frameworks 1.3 Problem Statement . . . . 1.4 Literature Review. . . . . 1.5 Summary of Contributions . . 2 Background 2.1 Poisson Processes . . . . 2.2 Network Graphs. . . . . 2.3 Parameter Estimation . . . . 3 The 3.1 3.2 3.3 3.4 3.5
MIT MOD Testbed Design Requirements . . . Campus Operating Region 3.2.1 MIT Campus . . . 3.2.2 Golf Cart Shuttles 3.2.3 Network Graph . . Ride Framework . . . . Autonomous Driving . . . Advanced Sensing . . . . . 3.5.1 Hardware . . . . . 3.5.2 Localization . . . . 17 18 20 23 26 31 35 35 36 38 41 41 42 42 43 44 47 48 49 50 51
Contents
. . . . . . . . . . . . . . . . . . . .3.5.3 Pedestrian Tracking . . . . 3.6 MIT MOD Evaluation . . . . 3.6.1 Passenger Request Testing . . . . 3.6.2 Pedestrian Trajectory Collection . . . . 3.7 High-Fidelity MIT MOD Simulation . . . . 3.8 Sum m ary . . . .
4 Moving Observer Method
4.1 Moving Observer Method . . . . 4.2 Poisson Arrival Rate Estimation . . . . 4.3 Comparison To Previous Moving Observer Methods 4.4 Experimental Testing . . . . 4.4.1 Hardware Experiments . . . . 4.4.2 Simulation Experiments . . . . 4.5 Sum m ary . . . .
5 Customer Demand Estimation
5.1 Customer Arrival Model . . . . 5.2 Two-factor Demand Model . . . . 5.3 Active Sensing . . . . 5.3.1 Arrival Rate Variance . . . . 5.3.2 Exploration Planner Formulation . . . . 5.3.3 Online Implementation . . . . 5.4 Experimental Testing . . . . 5.4.1 Simulation Setup . . . . 5.4.2 Active Sensing Approaches . . . . 5.4.3 Exploration Example . . . . 5.4.4 Active Sensing Results . . . .
5.5 Summary 53 54 55 56 58 60 63 64 66 67 69 69 73 77 79 . . . . 80 . . . . 80 . . . . 84 . . . . 84 . . . . 85 . . . . 86 . . . . 86 . . . . 87 . . . . 87 . . . . 88 . . . . 89 . . . . 9 0
6 Fleet Management for Ride Hailing 93
6.1 Hailing M odel . . . .. . . . . . 94
6.2 Ride Hailing Planner ... ... 95
6.2.1 Problem Formulation . . . . 95
6.2.2 Online Approach . . . . 97
6.2.3 Planner Comparison . . . . 99
6.3 Experimental Testing . . . . 99
6.3.1 Simulation Setup . . . . 101
6.3.2 Ride Hailing Approaches . . . . 101
6.3.3 Ride Hailing Evaluation . . . . 102
6.4 Sum m ary . . . . 102
7 Fleet Management for Ride Requesting 105 7.1 Customer QoS Model . . . . 106
7.1.1 Customer QoS without ridesharing . . . . 106
7.1.2 Customer QoS with ridesharing . . . . 107
7.2 Predictive Positioning for Minimizing Wait Time . . . . 109
7.2.1 Predictive Positioning Formulation . . . . 110
7.2.2 Online Implementation . . . . 111
7.3 Quality of Service Ridesharing . . . . 112
7.3.1 Ridesharing Formulation . . . . 113
7.3.2 Ridesharing Cost Functions . . . . 114
7.3.3 Online Approach . . . . 115
7.4 Experimental Testing . . . . 117
7.4.1 Simulation Setup . . . . 118
7.4.2 Predictive Positioning Evaluation . . . . 119
7.4.3 Ridesharing Benefits . . . . 121
7.4.4 Ridesharing QoS Evaluation . . . . 122
8 Conclusion
8.1 Future W ork . . . .
References
A MOD Sensing Hardware and Software Design A.1 Hardware
A.1.1 Cameras ... A.1.2 2D Lidar ... A.1.3 3D Lidar . . . ... A.1.4 Seat Sensors ... A.1.5 Computing ...
A. 1.6 Power and Communication . . . . A .2 Software . . . . A.2.1 Robot Operating System (ROS) . A.2.2 Hardware Drivers . . . . A.2.3 Localization . . . . A.2.4 Pedestrian Tracking . . . . A.2.5 Data collection procedure . . . .
B Marginalization of Arrival Probability
127 129 130 139 139 139 140 141 142 142 145 147 147 148 150 156 160 165 . . . . . . . . .
List of Figures
1-1 Ridesharing example . . . . 1-2 Approach overview . . . .
2-1 Example traffic network with corresponding network graph . .
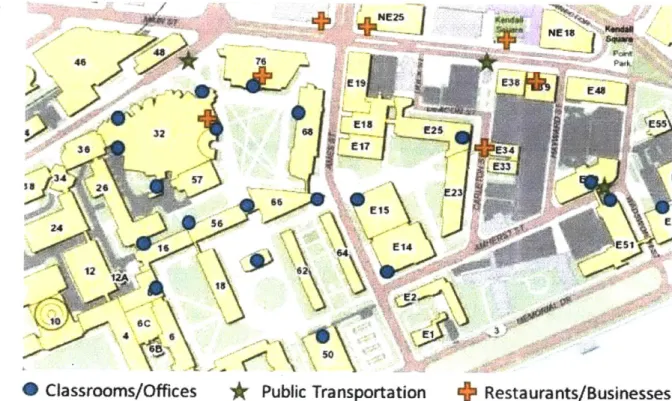
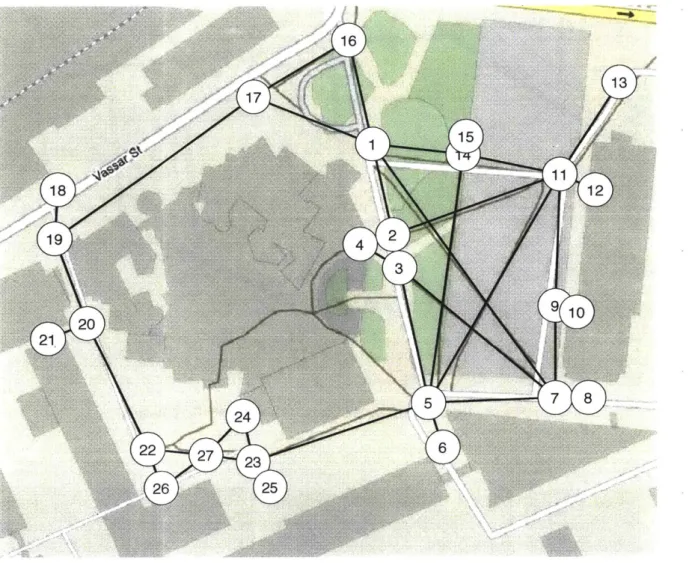
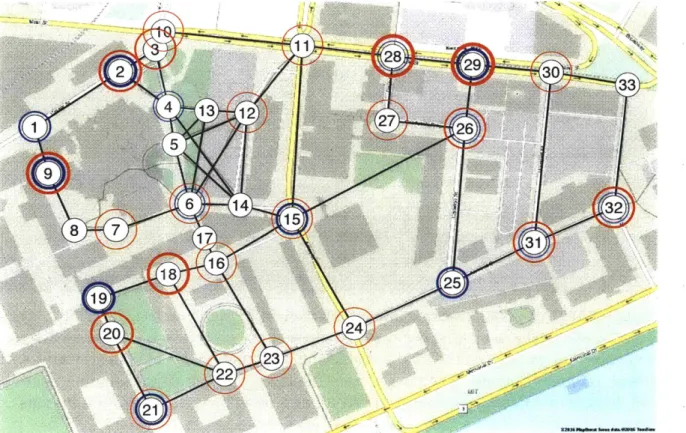
3-1 Map of MIT operating region showing demand locations . . . 3-2 Stock 2015 GEM e4s . . . . 3-3 MIT MOD campus operating region with vehicle justification. 3-4 Pedestrian network graph . . . . 3-5 3-6 3-7 3-8 3-9 3-10 3-11 3-12 3-13 3-14 3-15 3-16
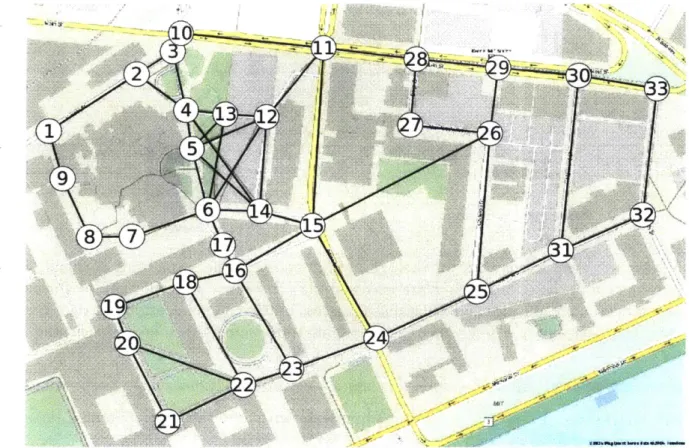
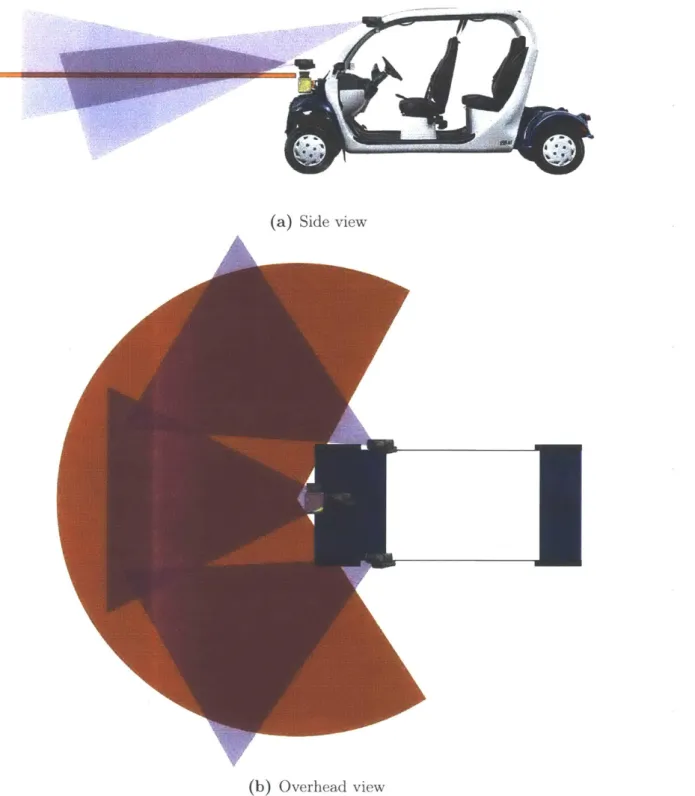
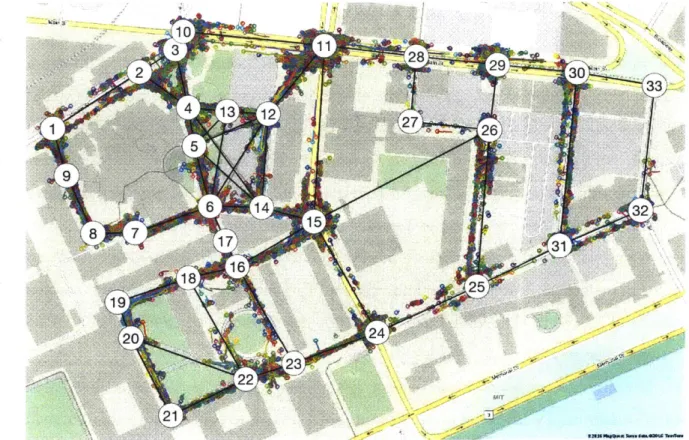
Full network graph . . . . App framework for the MIT MOD system . . . . Driver routing app for MIT MOD system . . . . GEM shuttle with sensors . . . . Pedestrian sensing coverage of the MOD vehicles . . . . Pedestrian tracking framework . . . . Pedestrian tracking implementation . . . . Pickup and dropoff locations for the campus MOD system Pedestrian trajectories overlayed on the full network graph Pedestrian velocities on MIT campus . . . . Example simulation of the MIT MOD system . . . . M IT M OD fleet . . . .
4-1 Moving observer diagram . . . . 4-2 Hardware setup for moving observer experiment . . . .
23 24 37 43 44 45 46 . . . . 47 . . . . 48 . . . . 49 . . . . 51 . . . . 52 . . . . 53 . . . . 55 . . . . 56 . . . . 57 . . . . 59 . . . . 60 . . . . 61 65 70
4-3 Moving observer arrival rate estimate comparison . . . . 71
4-4 Arrival rate estimates for pedestrians traveling along additional links 72 4-5 Arrival rates on each link in the network . . . . 74
4-6 Full network simulation results . . . . 75
4-7 Arrival rate estimates for varied number of link traversals . . . . 76
4-8 Arrival rate estimates for varied true arrival rates . . . . 76
5-1 Two-factor arrival diagram . . . . 81
5-2 Route assignments from the exploration planner. Relative link uncer-tainties are shown in magenta. Three vehicles (red, blue, green) are each assigned a route to reduce uncertainty. The route origin for each vehicle is marked with a cross. . . . . 89
5-3 Customer arrival rate estimation error over time . . . . 90
6-1 Comparison of expected value and chance-constrained planners . . . . 100
6-2 Comparison of ride hailing planners . . . . 103
7-1 Ridesharing assignment diagram . . . . 116
7-2 Relative customer arrival rates and computed predictive nodes . . . . 120
7-3 Service time comparison of baseline and predictive positioning methods over a range of customer arrival rates . . . . 121
7-4 Service times for unmanaged and predictive positioning methods, with and without ridesharing, over a range of customer arrival rates . . . . 122
7-5 Average customer rating for several fleet management strategies . . . 125
8-1 MIT MOD vehicle in pedestrian traffic . . . . 130
A-1 Logitech C920 camera . . . . 140
A-2 Sick LM S 151 Lidar . . . . 141
A-3 Velodyne VLP-16 Lidar . . . . 142
A-4 Seat sensor . . . . 143
A-5 Computing and battery . . . . 144
A-7 Hardware wiring diagram . . . . 145
A-8 Hardware wiring components . . . . 146
A-9 Software overview diagram . . . . 147
A-10 Sensor data comparison . . . . 162
A-11 Occupancy grid map for MIT campus . . . . 163
List of Tables
1.1 Summary of MOD operating frameworks. . . . . 20
7.1 MOD fleet management performance as measured by average customer rating . . . . 124
Chapter 1
Introduction
Mobility On Demand (MOD) systems are revolutionizing transportation, especially in urban environments. In MOD systems, a fleet of shared vehicles continually serves multiple customers by transporting them from desired pickup locations. to desired destinations. By utilizing shared resources, MOD systems promote higher vehicle utilization rates and more sustainable urban land use through reduced parking
spaces
[651.
MOD usage is growing quickly with the introduction of new app-based ride request systems such as Uber and Lyft. Both companies are seeing increases in requests, with Lyft recently reporting a rise in gross bookings by as much as 25% quarter over quarter [5]. It is estimated that by 2030, as much as 26% of all global miles traveled will be from customers using shared vehicles [4].
Additionally, the introduction of new autonomous MOD systems is expected, where vehicle fleets are composed of self-driving, autonomous vehicles. Autonomous vehicles in general promise to save lives and reduce costs with fewer accidents [8], but their use in MOD systems is also expected to reduce labor costs by removing the need for a driver. Existing MOD providers such as Uber are in active development of autonomous vehicles in order to augment their existing fleets
[55].
Furthermore, many vehicle manufactures currently in active development of autonomous vehicles are planning deployment within MOD systems. For example, Ford Motor Company is targeting high volume production of autonomous MOD fleets as early as 2021 [21.1.1
Motivation
A fundamrental goal for MOD systems is providing a high customer quality of service (QoS). Compared to the private automobile ownership experience, MOD customers
may experience inconveniences that are introduced from relying on a shared resource. For example, MOD customers can experience transit delays in the form of additional wait time as they wait for a vehicle to pick them up, or additional ride time if the vehicle makes additional stops before dropping them off. Along with the price of the service, the MOD system transit delays are a key factor in the success of MOD systems
[441.
The culmination of these factors is the customer QoS, a qualitative factor that specifies how customers perceive their MOD transportation experience. Through proper management of MOD systems, the QoS for MOD customers can be made more attractive than private ownership alternatives[44].
Success for MOD systems depends on the ability to manage the distribution of MOD vehicles under spatial and temporal fluctuations in customer demand
[44].
Therefore, MOD system must leverage powerful and accurate demand prediction models to efficiently manage the spatio-temporal distribution of the fleet [44]. There are many modeling paradigms that can be considered for demand prediction, each operating on different timescales.Reactive models operate on instantaneous timescales by using current ride request
information as a measure of customer demand. Example reactive models include real-time rebalancing policies that model customer demand using queue sizes of customers waiting for rides [50, 66]. The advantage of reactive models is that there is little uncertainty in demand because it is already made known. The disadvantage is that reactive models inherently lag behind demand, that is, demand is only made known once customers have arrived and are waiting to be served.
Predictive models operate on long timescales by using past ride request information
to extract temporal patterns in customer demand. An example predictive model is the Poisson-spectral model for extracting temporal patterns in [37]. The advantage of predictive models is that they can extract any temporal patterns that exist in the
system and provide predictions based only on the time-of-day, allowing for long-term predictions. A challenge for predictive models is that in order to extract any meaningful patterns, large datasets are required which can difficult to obtain, especially in new environments. One disadvantage is that the models are sensitive to deviations from historical data and can leave un-met demand if the system doesn't have records of customer arrivals in system locations.
Proactive models operate on short timescales by using real-time data in order
to anticipate future customer arrivals. These models attempt to use real-time mea-surements of data that is reflective of demand to identify demand hotspots before customers arrive. An example proactive model is the demand-supply level model in
[56]
that correlates real-time taxi turnover times with customer demand in an attempt to reduce customer wait times. The advantage of proactive models is that they can quickly respond to sudden changes in demand and can be used in new environments. A challenge for these models is that they require real-time data acquisition that often requires system-wide sensing for system-wide demand estimation. They also have the disadvantage that customer demand estimates are only valid for the short timescales for which the collected real-time data is valid, requiring that data be collected quickly and continually.This thesis is motivated by the rise of advanced sensing capabilities of modern vehicles, particularly autonomous vehicles, that can be used to to address the challenges associated with proactive customer demand models. By using autonomous vehicles as MOD shuttles, new sensing capabilities are introduced into the MOD system, where the advanced sensors used to automate each vehicle can now double as part of a mobile sensor network. Through a principled approach, sensor data from the mobile vehicles can be used to estimate real-time data in the form of traffic flows on short timescales. A proactive model then correlates real-time traffic data with customer demand to provide a belief in customer demand.
By utilizing the customer demand model, MOD fleets can be managed such that customer QoS is improved. Many modern MOD systems utilize automated fleet management for vehicle repositioning and fleet-wide coordination, especially MOD
Table 1.1: Summary of MOD operating frameworks.
Car sharing Ride hailing Ride requesting Ridesharing
. Vehicles wait Vehicles hailed Rides requested Customers at hubs by passengers via an app ride together
Ideal Vehicle Vehicle in Minimal
Customer available at proximity of Low pickup wait overall transit
QoS
customer's hub arrival location time delaysRebalance fleet Assign vehicles Assign
MOD Fleet to expected Minimize wait customers to
with respect to
Management demand arrival time for customers vehicles based
Goal locations [13,271 on QoS
[50, 58, 64, 66J]96J _________ [2
[9, 631 [42, 47]
fleets with autonomous vehicles capable of operation without a driver [49]. While the fundamental approach is to manage vehicles relative to customer demand, the exact means for which customer QoS can be improved through automated fleet management depends on the underlying MOD operating framework.
1.2
MOD Operating Frameworks
MOD in general refers to any framework in which customers do not own vehicles for transportation, but rather have on-demand access to rides whenever needed. However, the means for which customers request and receive rides can vary depending on the specific type of MOD framework. The distinction for how customers access an MOD system is important for understanding how customer QoS is affected by system operation. The following provides an overview of the details for several MOD frameworks with specific consideration on factors that affect customer QoS and the goals for effective MOD fleet management.
MOD operation can be classified into car sharing, ride hailing, ride request, and ridesharing frameworks, a summary for which is provided in Table 1.1.
Car Sharing In car sharing frameworks, customers walk to an origin hub to pick up
frameworks include one-way car rental services such as Zipcar and city bike sharing services such as Hubway. Typically, car sharing frameworks will utilize large vehicle fleets that are distributed across a relatively few number of hubs. The benefit of car sharing is that vehicles only need to be stored and routed between hubs, circumventing
the need to have vehicles at every exact customer arrival location. The drawback is that customers must first travel to a hub to receive a ride, introducing an additional transit delay. The customer QoS metrics for car sharing frameworks typically focus on the availability of vehicles at hubs 150,58,64,66]. A binary measure of QoS can be used, where an arriving customer either does or does not find access to a vehicle. Therefore, the challenge for MOD fleet management approaches is to ensure that there
is always a vehicle available for an arriving customer. As vehicles service customers, vehicles will be moved across the network and may be far from the next customer arrival location, causing an imbalance between future customer demand and fleet locations. The goal is then to design a car sharing planner that rebalances vehicles
across hubs based on expected customer arrivals.
Ride Hailing In ride hailing frameworks, customers do not travel to a hub but are rather picked up at their exact arrival location from a nearby waiting or passing vehicle. A request for a ride is made simply by hailing (waving down) a vehicle as it passes, requiring that the vehicle and arrived customer be within line-of-site proximity to one another. The most common example of ride hailing frameworks are taxi services that allow for street hailing. Like car sharing, ride hailing customer QoS is a binary measure that depends on whether or not the customer successfully hailed a ride. The challenge for MOD fleet management is ensuring that an MOD vehicle is within proximity of a customer arrival location, where the number of possible arrival locations often exceeds the number of vehicles in the fleet. As a result, the goal of a ride hailing planner is to selectively place vehicles in sufficient proximity of expected customer "hotspots", as identified by a customer demand model.
Ride Requesting In ride request frameworks, customers provide requests in the form of a pickup and dropoff location and a vehicle is routed directly to their arrival and destination locations. Modern ride requesting examples, such as Uber and Lyft, utilize a smartphone app capable of specifying precise address locations to a centralized server. Basic ride request frameworks provide a one-to-one service, where vehicles serve only one customer at a time. Because the customer's request is pushed to the MOD system, customer QoS no longer depends on whether a customer will receive a ride, but rather on how long they wait to receive the ride. A customer may have to wait for a vehicle to become available if all vehicles are currently in use. Even if a vehicle is available, the customer may have to wait for the vehicle to travel from its current location to the customer's pickup location. The challenge for MOD fleet management is that many or unexpected customer arrivals will lead to large customer wait times. One goal for a ride request planner could be to ensure that there are enough vehicles available in the system to always accommodate customer demand. However, given a fixed number of available vehicles, the goal is instead to minimize the wait time customers experience by placing vehicles close to expected customer arrival locations.
Ridesharing In ride request frameworks, if demand is high, it may not be possible to ensure there are enough vehicles to serve every customer on a one-to-one basis due to limited fleet sizes. Ridesharing frameworks are an extension of ride request frameworks where multiple customers may be serviced simultaneously by sharing a ride. Examples of ridesharing frameworks include airport shuttle services such as the SuperShuttle and app-based services such as Uber Pool and Lyft Line. Ridesharing reduces customer wait times by allowing new customers to be picked up before previous passengers have been dropped off. However, a trade off is introduced between reduced wait times for new customers and increased ride times for current customers. Customer
QoS
now depends on several factors such as wait time, ride time, the number of stops the vehicle makes, etc., and the reduction of one factor typically leads to the increase of another. Figure 1-1 shows an illustration of how a ridesharing customer mayAdditional distance
Wait delays
Additional stops
Figure 1-1: Ridesharing example. The figure illustrates example transit delays a customer (blue) experiences while going to their destination. After experiencing wait delays before being picked up, the customer may experience additional stops and ride delays before reaching their destination because the vehicle serves another customer (red).
experience several transit delays. The challenge for ridesharing is efficiently routing vehicles to serve multiple customers while maintaining a high QoS for each customer. This also leads to the challenge of determining an accurate quantitative measure of
QoS,
where naive assumptions in customer preference can lead to poor realized QoS if customers are improperly allocated to vehicles. The goal of a ridesharing planner is to both accurately quantify customer QoS and determine how to allocate customers to vehicles such that QoS is maximized.1.3
Problem Statement
The goal of this work is to develop algorithms for demand estimation and MOD fleet management in order to improve customer QoS. The focus for demand estimation is on the development of a proactive customer demand model that uses real-time traffic data for short-term predictions of customer arrival locations. A challenge for the proactive model is measuring real-time traffic data on a system-wide scale on short timescales. To address this, first real-time traffic arrival rate data is estimated using sensors onboard MOD vehicles. Traffic arrival data is then correlated with ride requests using
MOD Ride Expected
Requests Demand Improved
Requests Hotspots Customer
ProctveAutomated Qos
Vehic1 Real-time Correlation Fleet
Sensc '* Traffic Model
Management
Estimation Traffic
Arrival Sensing
Rates
Figure 1-2: Approach overview. Real-time traffic estimation uses data from vehicle
sensors to measure traffic trajectory data and provide estimates of traffic arrival rates.
A proactive correlation model uses the traffic arrival rates and MOD ride request data to estimate customer demand locations. Automated fleet management is used
to perform active sensing of the vehicle fleet in order to further improve accuracy in demand estimates. Ultimately, the goal is to perform automated fleet management with respect to customer demand estimates to improve customer QoS.
a proactive model to estimate expected demand hotspots in the form of customer
arrival locations. Through automated fleet management, vehicles as active sensors can be specifically routed to perform active sensing in order to further improve customer demand estimates. In addition to active sensing, MOD fleet management can be used
to ensure that customer's experience a high QoS. This work focuses on the challenges
associated with ride hailing and ride requesting frameworks for finding customers and mitigating transit delays. To address those challenges, fleet management planners
utilize customer demand estimates from the proactive model to ultimately improve customer QoS. An overview of the approach for this thesis is illustrated in Figure 1-2.
Real-time Traffic Estimation Traffic data is quantified in terms of arrivals (flows)
in a network graph representation of an MOD operating environment. In particular, the work in this thesis focuses on campus MOD systems composed primarily of
pedestrian traffic. The traffic estimation problem considers how data collected from
autonomous vehicles can be used to estimate Poisson arrival rates of pedestrian traffic.
In autonomous MOD systems, each vehicle is equipped with a suite of real-time sensors
in the form of cameras, Lidar, and GPS that enable it to drive autonomously. The first objective is to build and evaluate a physical framework for recording pedestrian movement using these onboard sensors. Pedestrian observations in the form of
trajectory data is used to estimate arrival rates along links in a network graph. For static sensors, arrival rate estimation could be trivially performed by counting the number of passing pedestrians in a given time. For mobile sensors, however, pedestrian counts and observation times are dependent on the vehicle motion. For example, a vehicle traveling alongside traffic will have different pedestrian counts if it travels with or against the pedestrian flow. The objective is to decouple the vehicle motion from the pedestrian observations in order to accurately measure pedestrian arrival rates. The goal is to demonstrate that real-time arrival rate estimation from already available mobile sensors on MOD shuttles is comparable to that of costly static sensors.
Customer Demand Estimation Customer demand is quantified as the number of MOD customers that will arrive at each location within an MOD system. Prediction of customer demand is achieved by estimating the Poisson arrival rates of customers at each location. Arrival rate estimation is performed through a proactive model that correlates real-time traffic data with customer arrivals. The first challenge is therefore determining the proper correlation between traffic and customer arrivals, ideally with quantification of uncertainty. The second challenge is obtaining system-wide observability. Fine-grained MOD network graphs typically have a large number
of possible arrival locations with relatively few vehicles available for observing traffic data at each one. A trial-and-error approach to assigning vehicles to park and wait sequentially at every potential arrival location would be slow and result in missed customers. The challenge is that of performing active sensing within the MOD network, where sensing vehicles are specifically routed to provide more accurate customer demand estimates.
MOD Fleet Management Given accurate predictions of customer demand, the next challenge is that of managing MOD fleets to best improve customer QoS, the requirements for which will vary depending on the underlying MOD framework. Of the many MOD frameworks, autonomous car sharing is potentially the least likely to be used in practice, as automatic positioning capabilities will likely obviate the
need for customers to travel to a hub. This thesis instead focuses on autonomous fleet management for ride hailing, ride requesting, and ridesharing frameworks. In ride hailing environments, customers do not specify pickup locations but rather hail a nearby passing vehicle. Unless a vehicle is in proximity of a customer, the customer will not be served. The challenge becomes that of estimating customer arrival locations and coordinating the vehicle fleet in the presence of estimation uncertainty in order to minimize lost customers. In ride request environments, as vehicles service customers, vehicles will be moved across the network and may be far from the next customer arrival location, resulting in large customer wait times. The challenge becomes that of using estimated customer demand to position unallocated vehicles in the MOD fleet such that customer wait times are minimized. In ridesharing environments, vehicle capacities are increased and different customers may be serviced simultaneously. The first challenge is that of understanding how tradeoffs in customer transportation metrics, such as reduced wait times for new customers and increased ride times for current customers, affect overall customer QoS. Naive assumptions in customer preference can lead to poor QoS if customers are improperly allocated to vehicles. Once a model of customer QoS is obtained, the challenge becomes that of efficiently assigning customers to vehicles to ensure that a high overall QoS is maintained.
1.4
Literature Review
This section highlights previous work in the domains of traffic sensing, customer demand estimation, and autonomous MOD fleet management.
Traffic Sensing
Automatic traffic monitoring techniques traditionally utilize stationary sensors such as cameras, pneumatic tubes, and magnetic loop counters
[3].
For pedestrian networks, traffic flow rates are obtained through similar means such as cameras and turnstiles. Stationary sensors can measure temporal variations in traffic, but only at the locations where they are installed which can make network-wide coverage cost prohibitive forlarge networks.
Mobile sensor methods have been proposed using vehicles for traffic monitoring under two main variations: probe vehicle methods and moving observer methods. Probe vehicle methods measure traffic stream characteristics by placing a probe vehicle in the flow of traffic [17,19,611. Only statistics of the probe vehicle are actually measured, which limits the types of traffic data that can be inferred and makes the method unsuitable for measuring arrival rates. Probe methods perform poorly for vehicles operating in pedestrian traffic networks because vehicle movement is not necessarily reflective of pedestrians traffic movement.
Moving observer methods can measure arrival rates by making manual counts of other vehicles or pedestrians as the observer vehicle drives along a link in the network graph. Previous work on counting methods use manual counts of other vehicles, typically the number of vehicles that are overtaking or are being overtaken by the moving observer, as the vehicle drives a link in either both directions [59] or a single direction
[451.
The methods are performed manually and are limited in the amount of data that can be collected because the algorithms require vehicles to traverse entire links to obtain arrival rate estimates. The idea of using autonomous vehicle sensors to estimate arrival rates is presented in [54], but the focus of the work was on developing the detection capabilities of the vehicle and arrival rate estimation methods were not addressed.Customer Demand Estimation
Many arrival process are modeled using Poisson process, which is a prominent customer arrival modeling approach used in MOD systems. Many autonomous car sharing approaches [50,58,64,66] use Poisson arrival rates to quantify customer arrivals at hubs within a network. These methods focus on the fleet management approaches and assume accurate knowledge of customer arrival rates based on historical taxi log data. In [43J, customer arrivals are not modeled through a prescribed distribution but rather through generalized uncertainty sets. This approach does not require assumptions about Poisson distributed arrivals, but the bounds on the uncertainty sets will be
dependent on choice of confidence level and data availability, where arrival data is again obtained from historical taxi logs.
Non-autonomous ride hailing approaches study customer demand estimation for taxi MOD systems. In [18, 23, 40, 51], temporal demand estimation methods are proposed based on historical data. A benefit to non-autonomous MOD systems is that human taxi-drivers provide initial knowledge on customer demand locations, which can then be studied to estimate future demand. In autonomous MOD systems operating in ride hailing frameworks, if there are no knowledgeable human-taxi drivers to find customers in the first place, then historical databases may be data deficient, causing demand to remain unknown. In
[9,56],
customer demand hotspots are estimated in real-time using large-scale taxi fleets that determine demand based on the likelihood of finding a customer. Demand is specified either for city-scale areas[561
or for customers waiting at taxi stands [9], where it is assumed that customers will be willing to wait for a taxi to pass by. If customers are not willing to wait for vehicles, but rather choose alternative transportation if no vehicle is waiting, then data composed only of customer arrivals will not be a sufficient measure of true customer demand.MOD Fleet Management
MOD fleet management has been traditionally studied for non-autonomous MOD systems through taxi dispatch and recommendation systems, with recent research interests focusing more on planners for autonomous MOD vehicles. Most of the literature on autonomous fleet management has focused on car sharing frameworks. Literature regarding other MOD frameworks (ride hailing and ride requesting) remains largely in the domain of non-autonomous MOD fleet planners.
Autonomous Fleet Management Previous works on autonomous MOD fleet management have focused on the car sharing challenge of determining how many vehicles are needed and how to rebalance (reposition) vehicles to ensure arriving customers always have access to a vehicle. In [50], rebalancing flow rates are determined and used to find the minimum number of rebalancing vehicles to bound the number
of waiting customers. A similar approach in
[581
determines rebalancing Markov transition probabilities to find the minimum number of vehicles to ensure that all arrivals can be met while minimizing wait times. In [66], a queuing theoretic approach is used to find rebalancing rates in the form of virtual passengers arrival rates. The method finds both the policy and minimum number of rebalancing vehicles needed to ensure that vehicles are available uniformly throughout the network. In[64],
a rebalancing policy uses Model Predictive Control to optimize over several objective functions, such as the number of waiting customers, the number of rebalancing vehicles, and the state of charge of the vehicles. These approaches assume a large fleet size is available in order to cover each station and do not extend well to more complex MOD frameworks where the number of possible nodes can quickly outgrow the number of vehicles.Ride Hailing Ride hailing planners focus on ensuring that vehicles are in proximity of possible customer arrival locations, where there are typically more arrival locations than available vehicles. Previous work on ride hailing planners do not consider autonomous MOD systems but rather take the form of taxi recommendation systems. In [28], a taxi recommendation system provides a sequence of potential pick-up points to drivers in order to minimize the distance that is likely to be driven before finding a customer. In [62,631, behaviors discovered from high-profit taxi drivers are used to make recommendations that maximize the profit of recommended taxi drivers. In
[9],
a recommendation smartphone application is used to direct taxi drivers to nearby hotspots in an attempt to balance fleet-wide supply and demand. Taxi-based planners typically focus on recommendations for individual taxi drivers and do not consider fleet-wide coordination that is guaranteed in autonomous systems.
Predictive Positioning for Ride Requesting Ride requesting planners with one-to-one assignments (without ridesharing) consider customer wait times when planning how vehicles should be repositioned throughout the network. Real-time predictive positioning of autonomous vehicles to minimize wait time for ride requests is not
common in literature. However, the concept is very similar to the ambulance location and relocation problem that positions ambulances with respect to expected emergency demand. A survey of ambulance location models is available in
[13].
The ambulance location problem is different from MOD positioning due to its focus on ensuring demand coverage, where the radius of coverage for each ambulance is prescribed by government standards. While coverage standards can be specified for MOD systems (minimum wait times), meeting those standards may require excessively large fleets. In MOD predictive positing, the problem is inverted: given a set of available vehicles, what is the best obtainable coverage.QoS in Ridesharing Ride request planners with ridesharing must include additional considerations on how individual customers should be assigned to each vehicle. There are many factors that compose customer QoS that need to be considered by the ridesharing planner. MOD ridesharing is traditionally formulated as a Dial-A-Ride Problem (DARP), which is a specialization of the Vehicle Routing Problem, formulated specifically for allocating customers to vehicles. The DARP has traditionally been applied to door-to-door transportation of elderly or disabled people, where the static DARP is used to make passenger assignments well in advance to vehicle operation [21]. The DARP is NP-Hard and exact mathematical formulations, especially those with customer QoS criteria included, can be complex and difficult to solve exactly
142].
Many approaches focus more on techniques for exact DARP solutions, with less focus on proper consideration for customer QoS. For example, in17]
an exact solution to the DARP is used by formulating a mixed integer linear program with customer QoS included in the cost function simply as a piecewise-linear customer impatience function. To reduce computation time and provide more generalization in QoS constraints, heuristic methods have been proposed taking the form of either integer program formulations or scheduling problem formulations. Integer program formulations using a weighted sum of QoS metrics as the cost function and a large number of feasibility constraints have been solved using genetic algorithms[36],
simulated annealing[42],
weights and constraint formulations are predefined according to assumed customer preference. Scheduling problem formulations enumerate the possible ways of inserting new passengers into the customer schedule of existing vehicles and evaluate each new schedule according to a cost function and a set of constraints. In
[26]
customers are assigned to the nearest vehicle for which a set of predefined customer QoS constraints are satisfied, and the fleet is sized to ensure all customers can be assigned. In [22,35], passengers are required to specify either pickup or drop off time windows that serve as additional constraints when evaluating a customer QoS based cost function. In addition to specifying any cost function weights, these methods must also specify customer QoS thresholds for the constraints. The main drawback with all of these approaches is that the formulation that encodes the QoS metrics could be wrong or the choice of weights and constraint thresholds that define customer preference may be chosen incorrectly. If customers perceive a different QoS preference than was assumed by the assignment algorithm, true customer QoS will suffer.1.5
Summary of Contributions
The contributions of this thesis address challenges in the field of MOD systems with respect to estimating customer demand and performing automated fleet management. The research contributions of this thesis are:
1. Introduction of a mobile-sensing framework for estimating network-wide traffic arrival rates; Chapter 4. Traffic arrival rates are estimated using camera and Lidar sensors onboard MOD vehicles. Challenges associated with coupling between vehicle motion and traffic observations are addressed through a novel moving observer method. Experimental testing demonstrates that the moving observer method achieves comparable arrival rate accuracy to that of pervasive stationary counters, allowing for network-wide sensing with mobile sensors.
2. Development of a customer demand estimation framework that incorporates real-time traffic sensing; Chapter 5. Estimates of customer arrivals are made
using a two-parameter approach that combines traffic arrival rates with observed customer arrival fractions. A Bayesian framework utilizes the data available from the moving observer method and customer arrivals to make online, recursive updates to the demand model. An active sensing planner is introduced for utilizing the customer demand model to specifically route vehicles in an MOD network graph in order to reduce uncertainty. Experimental testing shows that the modeling and active sensing approaches successfully improve customer arrival rate estimation accuracy on short timescales when compared against baseline approaches that focus either on waiting for customers or continual exploration.
3. Formulation of MOD fleet management planners for improving customer QoS in ride hailing, ride request, and ridesharing operating frameworks; Chapters 6 and 7.
For ride hailing, an MOD fleet management framework is introduced that addresses the challenges of utilizing customer demand in order to maximize the number of served customers. Uncertainty in future customer arrival locations is addressed through formulation of a chance-constrained planner. Experimental testing of the chance-constrained ride hailing planner demonstrates a significant improvement in the number of served customers in the MOD system over a baseline exploration approach.
For ride requesting, predictive positioning and ride hailing MOD fleet man-agement frameworks address the challenges of minimizing customer wait time and maximizing overall customer QoS. A predictive positioning planner is in-troduced that uses customer arrival rate information to position vehicles at key nodes in the MOD network graph that minimize the expected customer wait time. Through experimental testing, the predictive positioning approach is shown to effectively reduce customer service times when compared against a baseline planner that does not reposition vehicles after serving customers. A ridesharing planner is introduced for assigning customers to vehicles such that the ride metrics customers experience will result in a high perceived customer
QoS
as indicated through rating feedback. Rather than assume a customers'QoS
preference, a customer ratings model trained on 5-star ratings feedback is used to predict the mapping between customer ride metrics and perceived QoS. An insertion-based ridesharing planner utilizing the novel customer ratings model is shown to provide more robust customer rating performance over a range of unknown customer preferences when compared against ridesharing planners that assume a pre-defined customer preference.4. Design and implementation of an experimental campus MOD test-bed frame-work; chapter 3. A hardware implementation of a real-world MOD system is developed for the MIT campus. Three manually-driven, four-passenger golf cart shuttles are equipped with a set of sensors that are most commonly found on autonomous vehicles and operate within ride hailing and app-based ride request frameworks. The advanced capabilities of the MIT MOD framework are used for the purposes of developing MOD insights, collecting real-world data, and performing experimental evaluation of demand modeling and fleet management algorithms.
Chapter 2
Background
This chapter presents background material for the work in this thesis. Specifically, it covers Poisson process probability distributions, network graphs for transportation systems, associated network graph parameters, and parameter estimation techniques. Poisson arrival rate parameters are used in Chapters 4 and 5 to quantify and estimate both traffic and customer arrivals in terms of locations and rates. Network graphs and associated parameters are used throughout the thesis to provide a foundation for developing fleet management strategies.
2.1
Poisson Processes
Many random events occurring within a transportation system can be modeled using
counting processes. A counting process captures the random number of occurrences N(t) that have occurred at time t > 0. N(t) is a nonnegative integer, is nondecreasing
in t, and is right-continuous, i.e. the number of events in the interval T = (s, t] is given by N(T)= N(t) - N(s).
A Poisson process is a counting process where the the number of events in r is Poisson disturbed, i.e. N(T) - Poisson(AT) and
_ (Ar)k
P(N(r) = k) - (2.1)k
where A is the rate parameter that describes the process.
Poisson processes have many useful properties. First, independent Poisson processes can be merged into a single Poisson process through the superposition property. That is, given two independent Poisson processes, N1(t) and N2(t) with rate parameters A, and A2, their sum N(t) = N1(t) + N2(t) will also be a Poisson process with rate parameter A, + A2. Similarly, a single Poisson process can be split into independent
Poisson processes through the thinning property. That is, given a splitting fraction p, a Poisson process N(t) with rate parameter A can be split into independent Poisson processes N1(t) and N2(t) with rate parameters A = pA and A2 =(1 - p)A.
The thinning and superposition processes can be further applied to determine the order of events in independent Poisson processes
[31].
Given two independent Poisson processes N1(t) and N2(t) with rate parameters A, and A2, the probabilitythat N1(t) = n occurs before N2(t) = m occurs is given by
n+m-1 n + m -- Ai )k A2 n+m-l-k (2.2)
1:~~ ~ ~ (2.2) A2A,+ 2
k=n
2.2
Network Graphs
A network graph can be used to represent the connectivity of a transportation system in order to describe how traffic (pedestrians, bikers, cars, etc.) moves throughout the system. Figure 2-1 shows a an example section of a road traffic network with a corresponding network graph.
Nomenclature
A directed network graph
g
is composed of a set of nodes Af and a set of links L. The set of nodes A"{ni,
. ., nN} contains N, nodes that represent the regions where traffic can enter, leave, or transition through the traffic network. The set of links L={li,
. . . , l~1 contains N directed link edges, each taking the form of anordered pair of neighbor nodes, I = (no(l), fId(l)) E M 2, where o(l) and d(l) represent the respective origin and destination node indexes of each link. The links represent
l 2
6. 4 3 5
(a) Traffic Network (b) Network Graph
Figure 2-1: Example traffic network with corresponding network graph. The 6 shaded, numbered circles represent nodes where traffic may enter, exit, or transition through the network and the 6 bi-directed arrows represent the 12 directional links that indicate how traffic moves between the nodes.
how traffic moves between node regions, with the constraint that once traffic begins traveling along a link, it must travel to the destination node. If there are regions along a link for which that constraint does not hold true, i.e. traffic could exit the link at that location, then the link would instead be split into an additional set of nodes and links with an additional node at the exit location.
It is also useful to consider routes, that represent the complete travel path from origin to destination within the network graph. A route r(no(,), nd(r)) is defined as a sequence of directed links L C L that corresponds to a unique minimum-travel-time path between origin node no(r) and destination node nd(r), where o(r) and d(r) are indices corresponding to the origin and destination of r.
Network Arrivals
Arrivals within a network graph are defined in terms of node arrivals, link arrivals, or route arrivals, the distinction of which is important for parameter estimation discussed in Chapters 4 and 5. A node arrival occurs for a specific node whenever traffic appears within the node region, whether due to transitioning from another node or entering the network for the first time. A link arrival occurs for a specific link whenever traffic leaves the origin node of that link and begins to travel along the link towards the destination node of the link. A route arrival occurs for a specific route when traffic arrives in the network for the first time at the origin node of the route, travels along each link in the route, and leaves the network at the destination node of the route.
Arrivals in the network graph are modeled as route arrivals that occur according to Poisson processes. Poisson route arrivals will induce both link and node arrivals as traffic moves along the routes. Due to the superposition and decomposition properties of Poisson processes, nodes and link arrivals will also occur according to Poisson processes. For a route r that experiences arrivals according to rate A,, the arrivals for link 1 along that route will occur with arrival rate parameter A, such that
A, = 7 Ar, (2.3)
r: IEIr
where the summation is over all routes that include 1. Similarly, node arrivals will be Poisson distributed as a superposition of all link arrivals originating from that node. The arrivals for node n will occur with arrival rate parameter An such that
An = E Al, (2.4)
1: n=nol)
where the summation is over all links that have n as the origin node.
2.3
Parameter Estimation
This section covers maximum likelihood and Bayesian parameter estimation for Poisson and Bernoulli distributions that will be used in Chapters 4 and 5.
Arrivals within the transportation network follow Poisson processes that are defined by an arrival rate parameter A. Observation data for Poisson processes takes the form of the number of arrivals, m, observed over a time period of T. Given a sample of N,
independent arrival counts and corresponding observation time periods, the goal is to estimate A of the Poisson process from which the samples were drawn.
One approach is to use the maximum likelihood estimator (MLE) which is an efficient, unbiased estimator
[25].
First, the sample data can be aggregated intoN.
sufficient statistics for total arrival counts, N, = E me, and total count observation
N.
time T, Ti . The MLE is,
i=1
MLE c (2.5)
Te
Confidence interval bounds can be used to provide a measure of estimate accuracy. Lower and upper confidence interval bounds, AL and AU, specify a 100(1 -a) confidence level that the true value is within the bounds, where a is chosen based on the desired confidence level. The bounds are,
AL X Xa/2(2Ne) (2.6)
2Te
2
A u x a/22Ty= (2Nc + 2) ,(2.7)
2 Te
where XP(v) is the p-th quantile of the x2 distribution with v degrees of freedom.
An alternative approach is to use a Bayesian estimator which uses prior belief to provide a full probability distribution on the parameter itself. A common approach is to model the parameter using a distribution that is conjugate to the likelihood distribution. For data that is Poisson distributed, a conjugate prior for the the rate
parameter is the Gamma distribution, i.e. A - Gamma(A; a, /3) and
P(A = x) = x a e-O, (2.8)
F(a)
where F(-) is the Gamma function and a and /3 are hyperparameters that describe the distribution of A. Prior belief on the distribution of A is specified using values ao and 30. Estimation of the arrival rate parameter is performed by using the number of arrivals m observed over a time period of T to update the hyperparameters. Because the Gamma prior distribution is conjugate to the Poisson, the posterior distribution with updated hyperparameters will also be Gamma distributed, with parameters a = ao + m and
3
= 3o + r. The updated Gamma distribution completely describesthe parameter, where the mean or median can be used as a point estimate, and the variance can be used as a confidence measure.
distribution models the probability that a binary quantity x takes value either 1 or 0. The probability is determined using a fraction parameter p, that is x - Bernoulli(p) such that P(X = 1) = p and P(X = 0) =1 - p. Estimation of the fraction parameter uses a sample of N, observations of x in the form of the number of observed "successes",
N,
s = xi, and the number of observed "failures", -,s = N, - s. A Bayesian estimator
can be used to estimate p with a Beta distribution that is a conjugate prior for a Bernoulli likelihood model. The fraction parameter is modeled as Beta distributed with hyperparameters a and b such that p ~ Beta(p; a, b) and
X a-1(1 - x)b-1
P(p=) =b) (2.9)
where B(-, -) is the Beta function. Prior beliefs for the distribution of p are specified using prior values ao and bo. The posterior distribution for p will be Beta distributed