RESEARCH ARTICLE
High-Mass MALDI-MS Using Ion Conversion Dynode
Detectors: Influence of the Conversion Voltage
on Sensitivity and Spectral Quality
Simon Weidmann, Renato Zenobi
Department of Chemistry and Applied Biosciences, ETH Zürich, CH-8093, Zürich, Switzerland
+ - -HV2 HV1 ion-to-ion conversion discrete dynode
-secondary ion yield? dispersion? sensitivity?
Abstract.With the development of special ion conversion dynode (ICD) detectors for high-mass matrix-assisted laser desorption/ionization mass spectrometry (MALDI-MS), the mass-to-charge ratio is no longer a limiting factor. Although these detectors have been successfully used in the past, there is lack of understanding of the basic processes in the detector. We present a systematic study to investigate the performance of such an ICD detector and separate the contributions of the MALDI process from the ones of the ion-to-secondary ion and the secondary ion-to-electron conversions. The performance was evaluated as a function of the voltages applied to the conversion dynodes and the sample amount utilized, and we found that the detector reflects the MALDI process correctly: limitations such as sensitivity or deviations from the expected signal intensity ratios originate from the MALDI process itself and not from the detector.
Keywords:MALDI-ToF-MS, High-mass protein analysis, Ion conversion dynode, Sensitivity, Resolution
Received: 5 December 2013/Revised: 7 February 2014/Accepted: 7 February 2014/Published Online: 29 March 2014
Introduction
F
or analyzing high-mass compounds such as biomole-cules, one of the fastest and most accurate methods is matrix-assisted laser desorption/ionization mass spectrome-try (MALDI-MS) [1,2]. One of the distinguishing features of MALDI compared with other soft ionization techniques is the production of primarily singly charged ions. This reduces overlapping signals with the same mass-to-charge ratio (m/z) and simplifies the resulting spectra. Examples of very high-mass samples are noncovalent multiprotein complexes, which can be studied by MALDI-MS [3–7]. However, noncovalent interactions are easily disrupted during MALDI and stabilization of the interactions is necessary [2,3].Analysis of molecules with masses above 100 kDa using MALDI-MS was not possible with the same high sensitivity, mass accuracy, and resolution as when investigating pep-tides for a long time since suitable detectors were lacking. The commonly used microchannel plate detectors (MCP) suffered from a seriously decreased sensitivity for ions with high m/z [8–10], and because MALDI predominantly produces ions with low charge states, the m/z can become rather high. To our knowledge, the only commercially available high-mass detector for MALDI-MS relies on an
ion-to-secondary ion conversion [11] and is, therefore, dubbed an ion conversion dynode (ICD) detector. The underlying principle is known from theory, and such detectors have been successfully used for the detection of high-mass biomolecules with molecular weights of several hundred kDa up to above 1 MDa [6,7,12–15].
In an ICD detector, the ions arriving from the MS impinge onto a first conversion dynode to which a high voltage is applied. The primary ions are converted into secondary ions, which are re-accelerated towards a second dynode by a potential difference (Uacc) between
HV1 and HV2 (see Figure 1). As in a regular time-of-flight (ToF) mass separator, these secondary ions also undergo a slight ToF dispersion. On the second conver-sion dynode, the secondary ions are finally converted to electrons, which are then amplified. The resulting output current is recorded and displayed as a mass spectrum. From secondary ion mass spectrometry, it is known that the yield of sputtered ions increases with the mass of the impinging ion [16, 17] but how this effect manifests itself in an ICD is less clear. Moreover, the effect of Uacc on the ToF dispersion of the secondary ions and,
thus, on the peak width in the resulting spectra has never been investigated before. The influence of the voltage applied to the secondary conversion dynode on the electron yield is also unknown.
Some of the long-standing problems for high-mass MALDI-MS, such as the lack of suitable calibrants, could be solved recently [18] and it was demonstrated that using an ICD as detector greatly reduces mass discrimination [19,
20]. Nevertheless, some mass bias is still present and its reason is so far not fully understood. In order to separate the contribution of the MALDI process from the contribution of the detector to the mass bias, the working principle of the ICD detector needs to be better described. For instance, the influence of the voltages applied to the conversion dynodes has never been studied systematically.
Here, we try to separate the ion-to-secondary ion conversion process from the secondary ion-to-electron conversion, and to determine their individual influence on the mass spectra obtained. For instance, there might be some influence of the voltage difference between the two dynodes on the resolution of the mass spectrometer, or the sensitivity of the instrument could be a function of the conversion voltage. If the mass-dependent sensitivity of a MALDI-MS system were determined by the detector, changes made to the detector settings should have a direct influence on the mass spectrum, but if the sensitivity were limited by the MALDI process itself, the limit-of-detection (LoD) should be quite constant for all detector settings applied, and only the signal intensity and/or spectral quality would be expected to change.
The work presented here clearly shows that mass bias in high-mass MALDI-MS is mostly due to the MALDI process; the detector settings have only a minor influence. Only slight peak broadening was observed due to the ToF dispersion of the secondary ions before their conversion into electrons. Fine-tuning of the detector settings is necessary to optimize the spectra obtained in terms of spectral quality but mass bias cannot be corrected with different detector settings.
Experimental
Materials
Sinapinic acid (SA), acetonitrile (ACN), and phosphate buffered saline (PBS) tablets (pH 7.4) were obtained from Sigma-Aldrich (Buchs, Switzerland), trifluoroacetic acid (TFA) from Acros Organics (Geel, Belgium), and sodium
chloride (NaCl) from J.T. Baker (Deventer, The Nether-lands). All chemicals were of the highest purity available and used without further purification. The water used was of nanopure quality (18.2 MΩ∙cm) and prepared using a NANOpure Diamond water purification system (Barnstead Int., Dubuque, IA, USA). The expression and purification protocol for the proteins used (MBP and MBP3) has been
published before [18].
Sample Preparation
The MALDI matrix used was SA at a concentration of 10 mg/mL in water:ACN:TFA (49.95:49.95:0.1; v/v/v). Prior to sample preparation, the protein concentration was determined by measurement of the UV/Vis absorption at 280 nm using either a GENESYS 10S UV-Vis or a NanoDrop 1000 spectrophotometer (both from Thermo Scientific, Madison, WI, USA), depending on the sample amount, using the estimated extinction coefficients [20]. The samples were diluted using PBS buffer (20 mM PBS, 100 mM NaCl) to the desired concentration. For determina-tion of the relative response factor (Rrel), MBP and MBP3
were mixed in an equimolar ratio. Finally, the protein solutions were mixed with freshly prepared matrix solution (1:1, v/v). After thorough mixing, aliquots of 0.5 μL were spotted onto a stainless steel MALDI plate and allowed to crystallize under ambient conditions.
High-Mass MALDI-MS
A commercial MALDI mass spectrometer (TOF/TOF 4800 Plus, AB SCIEX, Darmstadt, Germany) with a frequency-tripled Nd:YAG laser (355 nm) for desorption/ionization was used. The instrument was retrofitted with an HM2tuvo high-mass detector (CovalX, Zürich, Switzerland) and was operated in linear mode (effective flight path length of 1.7 m). The standard settings for the ICD detector are−2.5 kV and −20 kV for HV1 and HV2, respectively, and were used unless otherwise noted. For acquisition of a spectrum, 250 laser shots at random spot positions with the laser power just above the ion formation threshold were accumulated. In order to exclude any influence of the instrumental parameters chosen, the ion guidance settings were optimized for maximal intensity and ideal peak shapes.
Data Processing
To record the spectra, the software provided by the manufacturer of the instrument was used (4000 Series Explorer, V.3.5.3). The spectra were saved as ASCII files and smoothed using the Savitzky-Golay algorithm. The baseline correction was done by interpolation, where necessary. Smoothing, integration, and baseline correction were done using OriginPro (V.8.6.0, OriginLab Corp., Northampton, MA, USA). In Figure 3 the spectral quality
Figure 1. Schematic representation of an ion conversion dynode detector (ICD). The ground in front of the detector is part of the mass spectrometer (shown in grey) to shield the flight tube from the electric fields of the detector
(i.e., the level of noise) is discussed; therefore, the unprocessed raw data are shown.
Results and Discussion
In a first experiment, the performance of an ICD detector was compared with a conventional MCP detector. Measure-ments were taken using the same instrumental parameters (laser power, number of laser shots) on the very same sample spots. The measurements using the MCP detector were taken before the measurements with the ICD to avoid signal loss due to a progressive ablation of the sample (Figure2). It was possible to obtain signals using the MCP detector for the sample with the lower mass (MBP, 43 kDa) but not for the high-mass sample (MBP3, 130 kDa). Using
the ICD detector, spectra of both species were recorded with good quality, although signals in the lower m/z range were not resolved (Figure 2c, marked with an asterisk). The observed peak width at half maximum (FWHM) of the MBP signal was lower using the MCP (600 Da) compared with the ICD (1.2 kDa). From these figures, an intrinsic limitation of the MCP detector becomes evident: the sensitivity is much higher in the low mass region, which probably also leads to the elevated background at m/zG 10,000. Further-more, a small signal indicating doubly charged MBP (m/z = 21,500) is visible. This signal is almost invisible in the spectrum using the ICD, with the signal of the singly charged species being much higher. Since the conditions for MALDI were identical, the only explanation is the different mass-dependent detection efficiency of the two detector types. The peak resolution of the ICD compared with the MCP when MBP was analyzed was reduced, probably partially due to the applied re-acceleration voltage [21]. Taking the much higher signal intensity and the reduced background signals into account, the use of an ICD is also beneficial for samples with m/z≈ 40,000. The extension of mass gating options from the low mass range to m/z 9
15,000 might help to reduce the background signals when the MCP is used. However, we are not aware of commercial instruments offering this option.
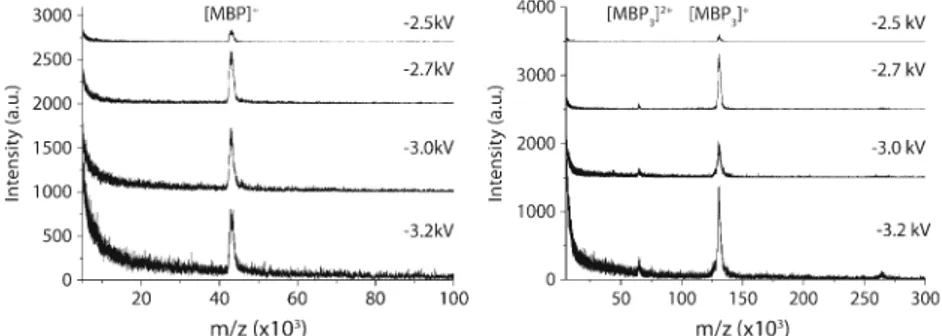
To investigate the influence of the secondary ion-to-electron conversion on the signal obtained, lower sample amounts (100, 50, 10, and 5 fmol) were deposited onto the MALDI plate and analyzed. The conversion voltage (HV1) was varied from−2.5 kV to −3.2 kV and, thus, Uaccchanged
as well. Independent of the voltage applied, no signals were obtained for samples containing less than 100 fmol MBP per spot and 50 fmol MBP3per spot, respectively. This suggests
that the LoD is not primarily dependent on the detector, but governed by the MALDI process itself, during which not enough analyte ions for a successful measurement are formed. As can be seen in Figure 3, the effect of HV1 on the signal intensity and the signal-to-noise ratio (S/N) was quite pronounced. A minor change in the voltage from−2.5 to−2.7 kV enhanced the signal by about a factor of five to ten for MBP and MBP3, respectively. Even higher voltages
did not enhance the signal any further, but the spectral quality (indicated by the S/N) deteriorated. The increase of noise in the m/z range below 20,000 is also notable.
If sample mixtures are investigated, the ratio of the different constituents is of interest. To quantify mass bias, the relative response factor (Rrel) was determined for MBP3
and MBP as previously described [20], using the following definition: Rrel¼ IMBP3 IMBP ⋅ MBP ½ MBP3 ½ : ð1Þ
For Rrel 9 1, the signals of heavier ions are more
prominent or the lighter ions are suppressed, and analogous-ly, RrelG 1 indicates discrimination against the heavier ion.
When evaluating signal integrals for determining Rrel, one
also needs to take into account the baseline of the spectrum.
Figure 2. Comparison of high-mass MALDI spectra of 557 fmol MBP (a), (b), and 100 fmol MBP3(c), (d) per spot, respectively.
Samples were recorded using both the ion conversion dynode (ICD) and the microchannel plate (MCP) detectors. The higher background in subspectra (b) and (d) atm/z G10,000 is due to the enhanced sensitivity of the MCP in the lower m/z range. Using the ICD, it was not possible to resolve different species (marked with asterisks in (c) and (d)) atm/z ≈ 8500, but detection of MBP3was easily possible
Here, the spectra were baseline-corrected and checked individually to prevent errors introduced by this correction. A slight preference for the species with the higher mass, with a Rrel = 1.07 on average (Table 1), was found,
independent of the voltage applied. Thus, it can be concluded that the mass bias is introduced by the MALDI process itself. For a voltage of HV1 =−3.2 kV, the spectra were too noisy to allow for a correct baseline subtraction.
As mentioned above, the yield of sputtered secondary ions increases with the momentum of the projectile [16,17]. Since the acceleration voltage of the MALDI-MS instrument used is kept constant, the momentum of the impact on the first conversion dynode is influenced more strongly by the mass of the analyte. Lowering HV1 and keeping HV2 constant leads to lower Uacc and, thus, less kinetic energy
that is transferred to the secondary ions. On the other hand, a more negative HV1 voltage applied leads an increased gain in the discrete dynode electron multiplier [22, 23]. When electron multiplication takes place, the last steps of the amplification cascade might reach saturation, after which the signal is not amplified anymore. Signals with a lower intensity at the first stage of the electron multiplier will reach saturation at later dynodes and therefore, the overall amplification of these signals is stronger. Although the discrete dynode electron multiplier is equipped with capac-itors to buffer the last conversion electrodes [11], the buffer capacity might not be sufficient and, therefore, low-intensity signals (i.e., background) might be over-represented at extreme detector settings. We observed that a lower HV1 value (e.g., −2.4 kV) did not yield any signal for 100 fmol
MBP per spot (data not shown), thus indicating that such a low voltage applied to the second conversion dynode and the discrete dynode electron multiplier is not sufficient to amplify the signal enough to obtain a good mass spectrum. As can be seen, the window of ideal settings is rather narrow. Similar to the laser intensity for the MALDI process, which should be just above the ion formation threshold, the detector voltage should be above a minimum voltage for obtaining sufficient gain. Only then is the signal gain sufficient to obtain an acceptable signal-to-noise ratio.
Evaluation of the peak width as a function of HV1 showed only minor changes. Between the two conversion dynodes, the secondary ions are re-accelerated by the voltage difference and undergo a minor ToF dispersion. The masses of the secondary ions created in an ICD are unknown but assuming the formation of a 30 Da and a 100 Da ion, with one negative charge (q = −1) each [11], allows to estimate the flight time difference. For reasons of simplicity, no spatial dispersion of the sputtered ions and a single secondary ion generation event was assumed and, thus, the ToF equation [24,25] can be used to estimate the flight times (t) of these two ions:
t¼ ffiffiffiffiffiffiffiffiffiffiffiffiffiffiffiffiffiffiffiffiffiffiffiffi d2 2⋅Uacc⋅ m q⋅e s : ð2Þ
With an assumed maximum length of the secondary ion’s flight path of d = 0.1 m, an acceleration voltage (i.e., the
Figure 3. Unprocessed raw-spectra of 100 fmol of MBP (left) and 50 fmol of MBP3, respectively, with different HV1 settings.
The general trend is the same in both cases: the signal becomes more intense with increasing voltage. An optimum signal-to-noise ratio (S/N) is reached around−2.7 kV; above this value, the increased noise level leads to an overall worse spectrum, although the signal intensity is the same or even slightly higher for MBP or MBP3, respectively
Table 1. Summary of Signal-to-Noise Ratio (S/N), Peak Width, Relative Response (Rrel), and Estimated Flight Time Dispersion as Functions of the Secondary Ion-to-Electron Conversion Voltage (HV1)
MBP MBP3 MBP3:MBP ToF dispersion
HV1 [kV] Uacc[kV] S/N FWHM [kDa] S/N FWHM [kDa] Rrel [μs]
−2.5 −17.5 13 1.2 10 2.2 1.06 0.251
−2.7 −17.3 28 1.4 65 2.5 1.08 0.250
−3.0 −17.0 10 1.3 7 2.6 1.07 0.248
difference between HV1 and HV2, Uacc=−16.8 kV, and the
elementary charge e = 1.602∙10−19 C), the flight times for
the secondary ions were estimated. Their estimated flight times differ by approximately 0.25μs. This short dispersion is only a minute contribution the observed peak width (Figure 3) and is hardly visible by eye. Although by changing HV1 the acceleration voltage of the secondary ions is changed as well, the ToF dispersion is apparently hardly affected (Table1).
Conclusions
We were able to show that ICD detectors correctly reflect the ion intensity generated in high-mass MALDI-MS. Any mass bias observed is caused by the ionization process itself and not introduced by the ICD detector. It is important to note that the ion-to-secondary ion conversion does not compromise the spectral quality. The peak resolution is slightly better in the low m/z range using MCPs, but this drawback is outweighed by much higher signal intensity and drastically reduced background signals when an ICD is used. To obtain mass spectra that show signals with the same peak ratios as the sample contains, we suggest improving the sample preparation. Depending on the sample itself, the best results might be achieved with the conventional dried-droplet method (as used here) or a thin-layer method. Once a reliable spotting method is developed, it should even be possible to obtain more reliable quantitative information from high-mass MALDI-MS.
Acknowledgments
The authors thank the SystemsX.ch initiative (CINA grant) and the Swiss National Science Foundation (grant no. 200020-124663) for financial support, and Nadezhda Nespovitaya for her help with the expression and purifica-tion of the MBP polyproteins.
References
1. Mädler, S., Boeri Erba, E., Zenobi, R.: MALDI-ToF mass spectrometry for studying noncovalent complexes of biomolecules. In: Topics in current chemistry, Springer-Verlag: Berlin/Heidelberg, pp. 1–36 (2012) 2. Nazabal, A., Wenzel, R.J., Zenobi, R.: Immunoassays with direct mass
spectrometric detection. Anal. Chem.78(11), 3562–3570 (2006) 3. Pimenova, T., Pereira, C.P., Schaer, D.J., Zenobi, R.: Characterization
of high molecular weight multimeric states of human haptoglobin and hemoglobin-based oxygen carriers by high-mass MALDI MS. J. Sep. Sci.32(8), 1224–1230 (2009)
4. Farmer, T.B., Caprioli, R.M.: Determination of protein–protein interac-tions by matrix-assisted laser desorption/ionization mass spectrometry. J. Mass Spectrom.33(8), 697–704 (1998)
5. Helin, J., Caldentey, J., Kalkkinen, N., Bamford, D.H.: Analysis of the multimeric state of proteins by matrix assisted laser desorption/
ionization mass spectrometry after cross-linking with glutaraldehyde. Rapid Commun. Mass Spectrom.13(3), 185–190 (1999)
6. Pimenova, T., Nazabal, A., Roschitzki, B., Seebacher, J., Rinner, O., Zenobi, R.: Epitope mapping on bovine prion protein using chemical cross-linking and mass spectrometry. J. Mass Spectrom.43(2), 185–195 (2008)
7. Chen, F., Gerber, S., Heuser, K., Korkhov, V.M., Lizak, C., Mireku, S., Locher, K.P., Zenobi, R.: High-mass matrix-assisted laser desorption ionization-mass spectrometry of integral membrane proteins and their complexes. Anal. Chem.85(7), 3483–3488 (2013)
8. Beuhler, R.J., Friedman, L.: Threshold studies of secondary-electron emission induced by macro-ion impact on solid-surfaces. Nucl. Inst. Methods170(1–3), 309–315 (1980)
9. Geno, P.W., Macfarlane, R.D.: Secondary electron emission induced by impact of low-velocity molecular ions on a microchannel plate. Int. J. Mass Spectrom. Ion Process.92, 195–210 (1989)
10. Brunelle, A., Chaurand, P., Della-Negra, S., Le Beyec, Y., Baptista, G.B.: Surface secondary-electron and secondary-ion emission induced by large molecular ion impacts. Int. J. Mass Spectrom. Ion Process.126, 65–73 (1993) 11. Wenzel, R.J., Röhling, U., Nazabal, A., Hillenkamp, F.: A detector device for high mass ion detection, a method for analyzing ions of high mass and a device for selection between ion detectors. Internat. Patent WO2009/086642-A1, July 16 (2009)
12. Wenzel, R.J., Matter, U., Schultheis, L., Zenobi, R.: Analysis of megadalton ions using cryodetection MALDI time-of-flight mass spectrometry. Anal. Chem.77(14), 4329–4337 (2005)
13. Riek, U., Scholz, R., Konarev, P., Rufer, A., Suter, M., Nazabal, A., Ringler, P., Chami, M., Müller, S.A., Neumann, D., Forstner, M., Hennig, M., Zenobi, R., Engel, A., Svergun, D., Schlattner, U., Wallimann, T.: Structural properties of AMP-activated protein kinase. J. Biol. Chem.283(26), 18331–18343 (2008)
14. Weidmann, S., Kemmerling, S., Mädler, S., Stahlberg, H., Braun, T., Zenobi, R.: Ionic liquids as matrices in microfluidic sample deposition for high-mass matrix-assisted laser desorption/ionization mass spec-trometry. Eur. J. Mass Spectrom.18(3), 279–286 (2012)
15. Chen, F., Mädler, S., Weidmann, S., Zenobi, R.: MALDI-MS detection of noncovalent interactions of single stranded DNA with Escherichia coli single-stranded DNA-binding protein. J. Mass Spectrom.47(5), 560–566 (2012)
16. Winograd, N.: The magic of cluster SIMS. Anal. Chem.77(7), 142 A– 149 A (2005)
17. Fletcher, J.S., Lockyer, N.P., Vickerman, J.C.: Developments in molecular SIMS depth profiling and 3D imaging of biological systems using polyatomic primary ions. Mass Spectrom. Rev.30(1), 142–174 (2011)
18. Weidmann, S., Barylyuk, K., Nespovitaya, N., Mädler, S., Zenobi, R.: A new, modular mass calibrant for high-mass MALDI-MS. Anal. Chem.85(6), 3425–3432 (2013)
19. Farmer, T.B., Caprioli, R.M.: Mass discrimination in matrix-assisted laser-desorption ionization time-of-flight mass-spectrometry: a study using cross-linked oligomeric complexes. J. Mass Spectrom. 30(9), 1245–1254 (1995)
20. Weidmann, S., Mikutis, G., Barylyuk, K., Zenobi, R.: Mass discrim-ination in high-mass MALDI-MS. J. Am. Soc. Mass Spectrom.24(9), 1396–1404 (2013)
21. Strupat, K.: Molecular weight determination of peptides and proteins by ESI and MALDI. In: Burlingame, A.L. (ed.) Methods in enzymology. Elsevier Academic Press: San Diego, pp. 1–36 (2005)
22. Wiza, J.L.: Microchannel plate detectors. Nucl. Inst. Methods162(1–3), 587–601 (1979)
23. Andersson, L.P., Grusell, E., Berg, S.: The parallel-plate electron multiplier. J. Phys. E: Sci. Instrum.12(11), 1015–1022 (1979) 24. Price, D.: of-flight mass spectrometry. In Cotter, R.J. (ed.)
Time-of-flight mass spectrometry; ACS Symposium Series 549, American Chemical Society: Washington, DC pp. 1–15 (1994)
25. Guilhaus, M.: Principles and instrumentation in time-of-flight mass-spectrometry. Physical and instrumental concepts. J. Mass Spectrom. 30(11), 1519–1532 (1995)