Simultaneous Integrated Boost Intensity-Modulated
Radiotherapy (SIB-IMRT) in Nasopharyngeal Cancer
Evangelia Peponi, Christoph Glanzmann, Guntram Kunz, Christoph Renner,
Katja Tomuschat, Gabriela Studer
1Purpose: To assess the efficacy and safety of using simultaneous integrated boost intensity-modulated radiotherapy (SIB-IMRT) to treat nasopharyngeal cancer (NPC) in a Caucasian cohort. Outcome was analyzed with respect to dose-volume histogram (DVH) values.
Patients and Methods: Between 03/2002 and 01/2008, 39 NPC patients underwent SIB-IMRT (37 Caucasians; 31 males; mean age 53 years [16–78 years]). 41% presented with WHO (World Health Organization) type 1 unfavorable histology, 85% with stage III/IV disease. 19 patients had total gross tumor volume (GTV) 16–70 cm3 (mean 36 cm3), while 16 had GTV > 70 cm3
(73–217 cm3; mean 115 cm3). All patients with stage II–IV disease received concomitant cisplatin.
The prescribed SIB dose delivered to the planning target volume (PTV) was 70 Gy (2.00 Gy/fraction) in 17, 69.6 Gy (2.11 Gy/frac-tion) in 19, and 66 Gy (2.20 Gy/fracGy/frac-tion) in three patients.
Results: 3-year local relapse-free, nodal relapse-free, distant metastases-free, disease-free rates and overall survival were 86%, 89%, 85%, 72%, and 85% (median follow-up 30 months [8–71 months]). Histology was a significant prognostic factor concerning overall survival, with worst prognosis in WHO type 1 compared to type 2/3 (75% vs. 93%; p = 0.03). There was a trend in favor of WHO type 2/3 regarding local control (74% vs. 94%; p = 0.052). The PTV DVHs showed a slight left shift compared to reported series. Three patients developed grade 3 late effects (xerostomia [n = 2], dysphagia [n = 1], hearing loss [n = 1]).
Conclusion: In comparison with predominantly Asian NPC IMRT series in the literature, chemo-IMRT in the own Caucasian co-hort, characterized by less radioresponsive WHO type 1, was equally effective. Treatment tolerance was excellent.
Key Words: Nasopharyngeal carcinoma in Caucasians · Intensity-modulated radiotherapy · Simultaneous integrated boost
Strahlenther Onkol 2010;186:135-42 DOI 10.1007/s00066-010-2048-y
Intensitätsmodulierte Radiotherapie mit simultan integriertem Boost (SIB-IMRT) beim Nasopharynxkarzinom
Ziel: Es wurden Wirksamkeit und Effektivität der intensitätsmodulierten Radiotherapie mit simultan integriertem Boost (SIB-IMRT) beim Nasopharynxkarzinom (NPC) untersucht. Die Resultate werden unter Berücksichtigung der Dosis-Volumen-Histo-gramm-(DVH-)Werte diskutiert.
Patienten und Methodik: Zwischen 03/2002 und 01/2008 wurden 39 NPC-Patienten mit SIB-IMRT behandelt (37 Kaukasier; 31 Männer; im Mittel 53 Jahre [16–78 Jahre]). 41% hatten eine ungünstige WHO-Typ-1-Histologie, 85% waren im Stadium III/IV. 19 Patienten wiesen ein Gesamttumorvolumen (GTV) von 16–70 cm3 (Mittelwert 36 cm3), 16 Patienten von > 70 cm3 (73–217 cm3;
Mittelwert 115 cm3) auf. Alle Patienten im Stadium II–IV erhielten simultan Cisplatin.
Die SIB-Dosis auf das Boost-Planungszielvolumen (PTV) betrug 70 Gy (2,00 Gy/Sitzung) bei 17, 69,6 Gy (2,11 Gy/Sitzung) bei 19 und 66 Gy (2,20 Gy/Sitzung) bei drei Patienten.
Ergebnisse: Mit einer mittleren Verlaufsbeobachtung von 30 Monaten (8–71 Monate) lagen die 3-Jahres-Überlebensraten für die Lokal-, Nodal- und Fernkontrolle bei 86%, 89% und 85%, das krankheitsfreie Überleben und das Gesamtüberleben betrugen 72% und 85%. Die Histologie war ein signifikanter prognostischer Faktor hinsichtlich des Gesamtüberlebens, mit ungünstigerer Prognose bei WHO-Typ-1-Histologie im Vergleich zu Typ 2/3 (75% vs. 93%; p = 0,03). Bezüglich der Lokalkontrolle zeigte sich ein Trend zugunsten Typ 2/3 (74% vs. 94%; p = 0,052). In den PTV-DVHs fand sich eine leichtgradige Linksverschiebung im Vergleich zu anderen Serien. Drei Patienten zeigten Grad-3-Spättoxizität (Xerostomie [n = 2], Dysphagie [n = 1], Schwerhörigkeit [n = 1]).
1Department of Radiation Oncology, University Hospital, Zurich, Switzerland.
Received: April 28, 2009; accepted: October 26, 2009 Published Online: February 22, 2010
Introduction
Nasopharyngeal cancer (NPC) is highly prevalent in Asian populations, while it is rare among Caucasians [17, 44]. His-torically, the local control for early stage reaches 80–90%, whereas T3–T4 tumors have a control rate of 30–65% [14, 25, 32]. Improvement in technical accuracy and radiotherapy de-livery has been linked with improved tumor control [36].
Various methods have been used to improve local control by increasing the dose delivered, including brachytherapy [6, 37], stereotactic radiotherapy [13], three-dimensional confor-mal radiotherapy [39, 42] and intensity-modulated radiothera-py (IMRT) [3, 22, 40]. IMRT allows for the simultaneous deliv-ery of different doses to different target volumes, representing an ideal technique for localized dose escalation [26, 31].
WHO (World Health Organization) histology type is regarded as an independent prognostic factor for survival in NPC, with less favorable prognosis in squamous WHO type 1 [5, 29]. Also, patients of Asian origin are considered to have improved survival when compared to non-Asians [2, 24].
Dose-volume histogram (DVH) comparison between institutions remains difficult, as there does not yet exist an international standardization regarding contouring defini-tion, prescription dose, volume-related dose distribution and IMRT fractionation and dose normalization.
We evaluate the outcome and toxicity profile of chemo-SIB-(simultaneous integrated boost-)IMRT in our predominantly Caucasian collective characterized by a high proportion of unfavorable WHO type 1 histology. Results were analyzed with respect to the DVH values resulting from our SIB-IMRT dose definition.
Patients and Methods
Patient, Disease and Staging Characteristics
Between March 2002 and January 2008, 39 patients under-went IMRT for NPC at our department. All were staged us-ing the 2002 American Joint Committee on Cancer (AJCC) criteria [9].
Pretreatment evaluation included complete history, physical examination, direct flexible fiberoptic endoscopy, magnetic resonance imaging (MRI) scans of the nasophar-ynx, skull base and neck, chest computed tomography (CT) or X-ray, laboratory studies, and dental evaluation. Most patients (> 90%) underwent fused CT-positron emission to-mography (PET) initially.
Patient and disease characteristics are listed in Table 1. Mean age of the cohort was 53 years (16–78 years). TN staging is outlined in Table 2.
IMRT Planning
Patients were immobilized from head to shoulders with com-mercially available thermoplastic masks and an individually Schlussfolgerung: Im Vergleich zur IMRT-Literatur mit großteils asiatischen Populationen fanden sich nach Chemo-IMRT bei der eigenen kaukasischen NPC-Kohorte mit großem Anteil an radioresistentem WHO-Typ 1 ähnliche Resultate. Die Therapietoleranz war ausgezeichnet.
Schlüsselwörter: Nasopharynxkarzinom und Kaukasier · Intensitätsmodulierte Radiotherapie · Simultan integrierter Boost
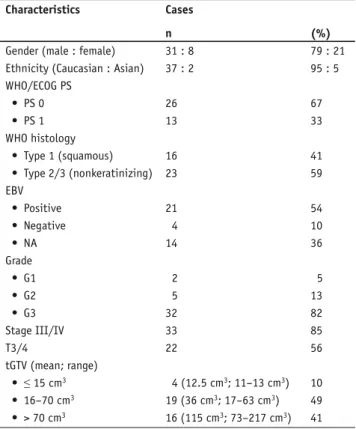
Table 1. Patient and disease characteristics (n = 39). EBV: Epstein-Barr virus; ECOG: Eastern Cooperative Oncology Group; NA: not assessable; PS: performance status; tGTV: total gross tumor volume; WHO: World Health Organization.
Tabelle 1. Patienten- und Tumorcharakteristika (n = 39). EBV: Epstein-Barr-Virus; ECOG: Eastern Cooperative Oncology Group; NA: nicht angebbar; PS: Leistungstatus; tGTV: Gesamttumorvolumen; WHO: Weltgesundheitsorganisation.
Characteristics Cases
n (%)
Gender (male : female) 31 : 8 79 : 21 Ethnicity (Caucasian : Asian) 37 : 2 95 : 5 WHO/ECOG PS • PS 0 26 67 • PS 1 13 33 WHO histology • Type 1 (squamous) 16 41 • Type 2/3 (nonkeratinizing) 23 59 EBV • Positive 21 54 • Negative 4 10 • NA 14 36 Grade • G1 2 5 • G2 5 13 • G3 32 82 Stage III/IV 33 85 T3/4 22 56 tGTV (mean; range) • ≤ 15 cm3 4 (12.5 cm3; 11–13 cm3) 10 • 16–70 cm3 19 (36 cm3; 17–63 cm3) 49 • > 70 cm3 16 (115 cm3; 73–217 cm3) 41
Table 2. TN categories in all patients. Tabelle 2. Verteilung der TN-Stadien.
N0 N1 N2 N3 Total T1 1 0 4 0 5 T2 1 4 6 1 12 T3 0 1 2 1 4 T4 4 5 9 0 18 Total 6 10 21 2 39
customized bite block. CT images (2 mm slice thickness) were acquired from the top of vertex to the level of the carina.
The target volumes were drawn on each axial planning CT slice, based on diagnostic CT images, supplemented with fused diagnostic MRI and/or PET-CT scans. The gross tumor volume (GTV) included the gross extent of the pri-mary disease and involved lymph nodes. PTV1 (planning
target volume) was defined by adding a 0- to 15-mm mar-gin to GTV, dependent on the GTV proximity to critical structures. PTV2 covered areas at high risk for potential microscopic disease. PTV3 included the clinically negative bilateral cervical lymphatics down to the supraclavicular fos-sae (elective PTV).
Organs at risk were outlined in three dimensions with an estimated planning organ-at-risk volume (PRV) margin of 2–10 mm.
We used an extended-field IMRT (EF-IMRT) technique, where the primary was treated in one phase along with the regional lymph nodes. Irradiation was delivered with five or seven coplanar beam angles by a 6-MV dynamic multileaf collimator (MLC) system (sliding-window technique; Var-ian Medical Systems, Palo Alto, CA, USA). Example of a five-field inverse plan is shown in Figure 1.
Prescription Dose
As previously described [33], SIB-IMRT was performed using the following schedules (five fractions/week each):
• SIB2.00: daily dose 2.00 Gy (PTV1)/1.70 Gy (PTV2)/1.54 Gy (PTV3); total dose: 70.00 Gy (n = 17);
• SIB2.11: daily dose 2.11 Gy (PTV1)/1.80 Gy (PTV2)/1.64 Gy (PTV3); total dose: 69.60 Gy (n = 19);
• SIB2.20: daily dose 2.20 Gy (PTV1)/2.00 Gy (PTV2)/1.80 Gy (PTV3); total dose: 66.00 Gy (n = 3).
The mean total treatment time was 46.7 days (33–58 days).
In cases with central nervous sys-tem involvement, the Dmax accepted was 2.00 Gy (SIB2.00). The dose was normalized to the mean dose in PTV1. For intensity optimization the pre-scribed dose should encompass at least 95% of the PTV. No more than 20% of any PTV would receive > 110% of its prescribed dose, while no more than 1% of any PTV would receive < 93% of the desired dose.
Chemotherapy
All patients with stage II–IV disease (n = 38) received concurrent cisplatin (40 mg/m2 i.v. weekly [n = 36] or 100 mg/m2
i.v. on days 1, 22, and 43 [n = 2]) as well as three cycles of neoadjuvant/adjuvant chemotherapy with cisplatin (100 mg/ m2 i.v.) and 5-fluorouracil (1,000 mg/m2
continuous i.v., days 1–4) every 4 weeks (n = 27; modified Head and Neck In-tergroup protocol 0099) [1]. 30 of the patients who received weekly cisplatin Figure 1. Isodose curves of a five-field inverse plan for a patient with
T2 N0 (stage IIB) carcinoma of the nasopharynx displayed on the axial, coronal and sagittal planes through the primary tumor. Dose-volume histograms for the relevant structures.
Abbildung 1. Isodosenkurven von einem Fünf-Felder-Plan bei einem Patienten mit Nasopharynxkarzinom T2 N0 (Stadium IIB) durch den Primärtumor in axialer, koronarer und sagittaler Richtung. Dosis-Volumen-Histogramme für die relevanten Strukturen.
Cumula tiv e sur viv al Months 1 0 10 20 30 40 50 60 70 80
os
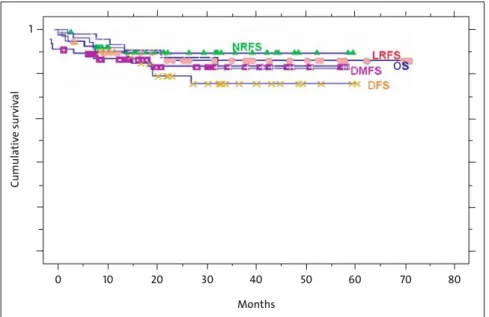
Figure 2. Kaplan-Meier estimate of actuarial 3-year local relapse-free survival (LRFS), nodal relapse-free survival (NRFS), distant metastases-free survival (DMFS), disease-free survival (DFS), and overall survival (OS).
Abbildung 2. Kaplan-Meier-Kurven des aktuarischen 3-Jahres-Überlebens in Bezug auf lo-kale Tumorkontrolle (LRFS), nodale Kontrolle (NRFS), fernmetastasenfreies Überleben (DMFS), krankheitsfreies Überleben (DFS) und Gesamtüberleben (OS).
(77%) completed five to seven concurrent cycles. In patients in whom cisplatin was contraindicated, carboplatin was sub-stituted (n = 3).
Follow-Up
Institutional standards for posttreatment patient assessment included physical examination with additional fiberoptic nasopharyncoscopy at the Department of Head and Neck Surgery approximately every 2 months in the 1st year of fol-low-up, every 3 months in the 2nd year, every 6 months in the 3rd–5th year, and annually thereafter. A baseline MRI scan of the nasopharynx and neck was obtained within 3–6 months. Suspected findings were specified with PET-CT and were his-tologically proven.
Normal-tissue effects were graded according to the Ra-diation Therapy Oncology Group (RTOG)/European Orga-nization for Research and Treatment of Cancer (EORTC) radiation morbidity scoring criteria [10]. Xerostomia was sub-jectively assessed by the patients.
Statistical Analysis
Statistical calculations were performed using StatView®
pro-gram (Abacus Concepts Inc., CA). p-values of ≤ 0.05 were considered statistically significant.
Results
Treatment Outcome and Patterns of Failure
Analysis was based on follow-up data available as of January 1, 2009. The median follow-up was 30 months (range: 8–71 months).
The actuarial 3-year local relapse-free, nodal relapse-free, distant metastases-free and disease-free rates were 86%, 89%, 85%, and 72%, respectively (Figure 2). The 3-year estimate of overall survival was 85%. At the time of analysis, 29 patients were alive with no evidence of disease (75%), four were alive with local and/or distant disease (10%), four died of disease (10%), and two died with intercurrent disease (5%; Table 3).
Prognostic Factors
Univariate analysis was performed to examine the impact of various prognostic factors. Differences in overall survival according to histology were statistically significant with worst prognosis in WHO type 1 [38] compared to WHO type 2/3 (75% vs. 93%; p = 0.03). There was also a trend in favor of WHO type 2/3 regarding local control (74% vs. 94%; p = 0.052).
Differences in 3-year local control rate according to T-stage were statistically significant, favoring T1/T2 lesions compared to T3/T4 (94% vs. 82%; p < 0.001).
Late Toxicity
There was no grade 4 late toxicity observed. The most com-mon late effect was xerostomia. At the 12-com-month postirradia-tion follow-up, xerostomia grade 3 was assessed in three pa-tients (8%), while five papa-tients (13%) experienced xerostomia grade 2. At 24 months, grade 2 xerostomia was observed in four patients (10%). Grade 3 xerostomia insisted in two pa-tients (5%), by whom the D50 values (dose delivered to 50% of the organ volume) to the right/left parotid was 40.6 Gy/49.8 Gy and 35.2 Gy/48.0 Gy, respectively.
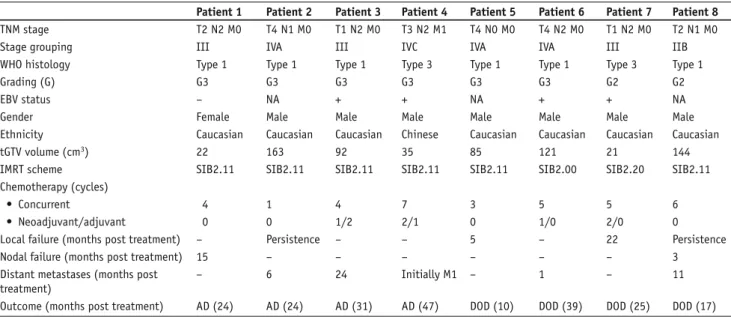
Table 3. Characteristics of failed patients (n = 8). AD: alive with disease; DOD: dead of disease; EBV: Epstein-Barr virus; IMRT: intensity-modulated radiotherapy; SIB: simultaneous integrated boost; tGTV: total gross tumor volume; WHO: World Health Organization.
Tabelle 3. Charakteristika der rezidivierten Patienten (n = 8). AD: Leben mit Erkrankung; DOD: Tod wegen Erkrankung; EBV: Epstein-Barr-Virus; IMRT: intensitätsmodulierte Radiotherapie; SIB: simultan integrierter Boost; tGTV: Gesamttumorvolumen; WHO: Weltgesundheitsorganisation.
Patient 1 Patient 2 Patient 3 Patient 4 Patient 5 Patient 6 Patient 7 Patient 8 TNM stage T2 N2 M0 T4 N1 M0 T1 N2 M0 T3 N2 M1 T4 N0 M0 T4 N2 M0 T1 N2 M0 T2 N1 M0
Stage grouping III IVA III IVC IVA IVA III IIB
WHO histology Type 1 Type 1 Type 1 Type 3 Type 1 Type 1 Type 3 Type 1
Grading (G) G3 G3 G3 G3 G3 G3 G2 G2
EBV status – NA + + NA + + NA
Gender Female Male Male Male Male Male Male Male
Ethnicity Caucasian Caucasian Caucasian Chinese Caucasian Caucasian Caucasian Caucasian
tGTV volume (cm3) 22 163 92 35 85 121 21 144
IMRT scheme SIB2.11 SIB2.11 SIB2.11 SIB2.11 SIB2.11 SIB2.00 SIB2.20 SIB2.11
Chemotherapy (cycles)
• Concurrent 4 1 4 7 3 5 5 6
• Neoadjuvant/adjuvant 0 0 1/2 2/1 0 1/0 2/0 0
Local failure (months post treatment) – Persistence – – 5 – 22 Persistence
Nodal failure (months post treatment) 15 – – – – – – 3
Distant metastases (months post treatment)
– 6 24 Initially M1 – 1 – 11
One patient developed cisplatin-related (five cycles con-currently) grade 3 hearing loss. The D50/Dmax values to the right and left middle/inner ear of the patient were 38.1 Gy/56 Gy and 34.0 Gy/55 Gy, respectively. One patient with T4 N1 disease developed dysphagia grade 3, which still persisted at 24-month follow-up, when he also remained PEG-(percutaneous en-doscopic gastrostomy-)dependent; in this case, the caudal border of PTV1 was at the level of the glottic larynx. One patient presented with positive Lhermitte’s sign at the 12-month clinical evaluation that resolved 4 months later. The D5 (dose delivered to 5% of the organ volume)/D10 (dose delivered to 10% of the organ volume) to the myelon PRV (myelon + 5- to 8-mm margin) were 42.7/39.6 Gy, respectively, while Dmean/Dmax were 58.1/34.5 Gy.
In summary, persistent grade 3 late effects were observed in three patients (8%). There were no cases of temporal lobe necrosis, clinical optic neuropathy, osteoradionecrosis, severe soft-tissue fibrosis, or clinical hypopituitarism.
Dose-Volume Analysis
Tables 4 and 5 show the DVH statistics for the target volumes. The maximum and minimum doses are point doses. Compared to the corresponding values published by others (Table 4) [22, 28]), our GTV mean dose revealed to be ~ 3 Gy lower, while comparable nominal prescription dose was provided. The percentage of the GTV that received
≤ 95% of the prescribed dose remained equal. On the contrary, by the other series, the majority of the GTV re-ceived > 105% of the prescribed dose. This could raise a risk for lower tumor control in our cohort. However, there is no clear evidence for a loss of tumor control so far. Additionally, regarding optimal effective dose, there is a contro-versy in the optimal radiation dose, as, for example, in pediatric NPC, present-ing mainly with WHO type 3 histology, it has been shown that radiation doses > 60 Gy appear necessary to achieve a high rate of locoregional control [41].
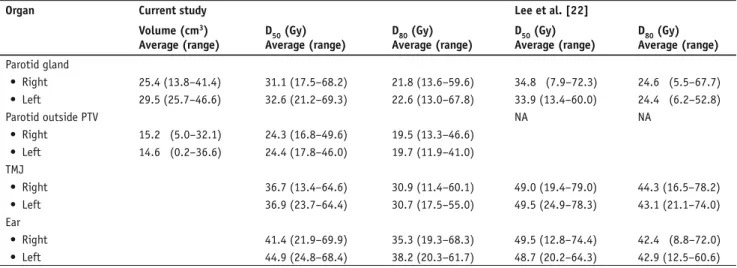
Table 6 shows the DVH statistics for the critical normal structures orga-nized in series, while Table 7 outlines the DVH statistics for the normal tis-sues organized in parallel. Quantita-tive DVH analysis showed that there was significant sparing of the critical structures, a result that was consistent with the clinical observation of excellent treatment tolerance. DVH comparison of the normal structures organized in par-allel showed lower dose values compared to that of Lee et al. [22], which may in part explain the low rate of important late effects in our own series.
Discussion Disease Control
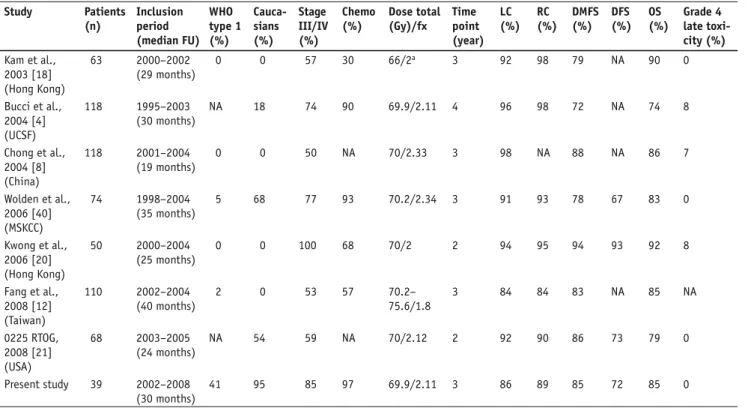
IMRT series with altered fractionation schemes report local control rates of 84–98% and overall survival rates of 74–92%. However, the local failure rate remains still > 10% in patients with T3/T4 tumors [7, 15, 16, 18, 22, 27, 40, 43].
In our study, the locoregional failure as well as disease-free survival and overall survival rates are in the range of Table 4. Dose-volume statistics of all patients derived from dose-volume histograms for gross
tumor volume (GTV) and comparison to other series. NA: not assessable.
Tabelle 4. Dosis-Volumen-Statistiken von Dosis-Volumen-Histogrammen für das Tumorvolu-men (GTV) im untersuchten Kollektiv und Vergleich mit anderen Serien. NA: nicht angebbar.
GTV average (range)
Current study Lee et al. [22] Poon et al. [28] Volume (cm3) 70.0 (10.7–221.0) 104.0 (10.0–669.2) 121.9 (2.3–669.2)
Mean dose (Gy) 70.9 (67.7–73.0) 74.5 (63.3–94.6) 74.4 (69.4–77.3) Maximum dose (Gy) 76.5 (70.8–81.5) 79.3 (65.8–93.8) 80.7 (74.1–87.5) Minimum dose (Gy) 61.8 (48.7–69.4) 49.4 (16.2–71.5) 48.2 (33.1–69.5) % volume receiving ≤ 95%
of the prescribed dose
2.8 (0.0–19.3) 2.7 (0.0–93.0) 1.99 (0.0–6.1) % volume receiving ≤ 90%
of the prescribed dose
0.7 (0.0–11.0) 1.6 (0.0–66.0) 0.99 (0.0–4.1) % volume receiving ≥ 105
of the prescribed dose
17.3 (0.0–72.9) 75.5 (0.0–99.0) 71.5 (40.3–91.2) % volume receiving ≥ 107
of the prescribed dose
5.8 (0.0–56.6) NA NA
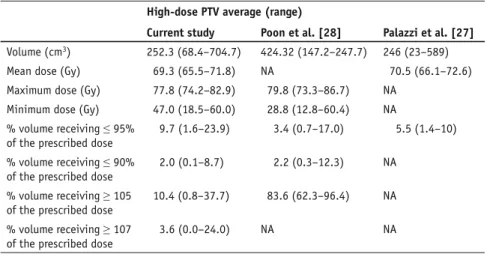
Table 5. Dose-volume statistics of all patients derived from dose-volume histograms for high-dose planning target volume (PTV) and comparison to other series. NA: not assessable. Tabelle 5. Dosis-Volumen-Statistiken von Dosis-Volumen-Histogrammen (DVH) für Hoch-Dosis-Planungszielvolumen (PTV) im untersuchten Kollektiv und Vergleich mit anderen Serien. NA: nicht angebbar.
High-dose PTV average (range)
Current study Poon et al. [28] Palazzi et al. [27] Volume (cm3) 252.3 (68.4–704.7) 424.32 (147.2–247.7) 246 (23–589)
Mean dose (Gy) 69.3 (65.5–71.8) NA 70.5 (66.1–72.6) Maximum dose (Gy) 77.8 (74.2–82.9) 79.8 (73.3–86.7) NA
Minimum dose (Gy) 47.0 (18.5–60.0) 28.8 (12.8–60.4) NA % volume receiving ≤ 95%
of the prescribed dose
9.7 (1.6–23.9) 3.4 (0.7–17.0) 5.5 (1.4–10) % volume receiving ≤ 90%
of the prescribed dose
2.0 (0.1–8.7) 2.2 (0.3–12.3) NA % volume receiving ≥ 105
of the prescribed dose
10.4 (0.8–37.7) 83.6 (62.3–96.4) NA % volume receiving ≥ 107
of the prescribed dose
NPC IMRT series published so far (Table 8), despite the fact that our cohort includes predominantly patients of Caucasian origin (95%), with a consecutively higher per-centage of patients with WHO type 1 histology (41%) and a relatively greater proportion of patients with stage IV disease (54%), except for the study by Kwong et al. (72%) [20].
Postfailure analysis of isodose plans showed that all local recurrences were located within the high-dose volume, sug-gesting that contoured PTVs and the immobilization system were adequate. The absence of local failure in cases with GTV volume < 16 cm3 may suggest adequate dose for small tumors
[34]. A more effective dose may be required for locally ad-vanced disease. Considering the favorable tolerance profile in our cohort, a careful dose increase may be possible (besides of
other theoretical ways to biologically increase effectivity [19, 23]).
All six patients with N0 status remained nodally con-trolled. As previously described [35], in spite of our rather re-strictive elective PTV definition regarding level I, none of the nodal recurrences were located in level I. One has, however, to consider that there was effective dose in level Ib, even in cases where this level was not included in PTV (Table 9).
Evaluation of DVH analysis showed that our GTV DVH curves are slightly left-shifted compared to reported series [22, 27] (Table 4). Lee et al. [22] explained the tumor over-dosage by the fact that the prescribed dose was the minimum dose that encompassed the tumor target volume. Our left shift raises a risk for lower tumor control. However, there is no clear evidence for a loss of tumor con-trol so far.
Comparisons of high-dose PTV DVH values [27, 28] are difficult and of limited meaning, as there are no inter-national standards of IMRT schedules and the nominal doses are delivered us-ing different dose constraints with dif-ferent dose calculations to difdif-ferent re-lated PTV definitions between centers.
Toxicity
IMRT-chemotherapy was well toler-ated (no grade 4 late complications). In comparison to Lee et al. [22], improved sparing of normal structures (parotid, temporomandibular joint, ear) in our study may in part explain the low rate of important late effects. As it has been Table 6. Dose-volume statistics derived from dose-volume histograms for serial critical normal
structures and comparison to the series by Lee et al. [22]. D5: dose to 5% of volume; D10: dose to 10% of volume; NA: not assessable.
Tabelle 6. Dosis-Volumen-Statistik von Dosis-Volumen-Histogrammen für serielle kritische Normalstrukturen im untersuchten Kollektiv und Vergleich mit der Serie von Lee et al. [22]. D5: Dosis in 5% des Volumens; D10: Dosis in 10% des Volumens; NA: nicht angebbar.
Organa Current study Lee et al. [22]
D5 (Gy) Average (range) D10 (Gy) Average (range) D5 (Gy) Average (range) D10 (Gy) Average (range) Brain stem 47.7 (34.9–60.6) 45.2 (31.9–58.2) 46.3 (26.6–67.0) 43.5 (17.6–65.0) Spinal cord 38.4 (33.3–47.0) 36.6 (30.6–45.2) 36.5 (9.8–46.3) 30.0 (1.9–45.7) Chiasm 21.7 (2.4–62.7) 20.4 (1.9–61.4) 28.7 (3.6–55.7) 26.9 (3.5–54.0) Temporal lobes 41.7 (22.5–67.1) 36.6 (10.0–65.0) NA NA Optic nerves • Right 19.2 (2.2–52.9) 18.7 (1.5–50.9) 25.7 (8.0–67.7) 23.3 (2.9–65.8) • Left 22.4 (2.0–72.3) 20.3 (1.5–71.0) 21.5 (7.5–61.8) 20.6 (7.5–62.0)
aAll organs were outlined with an estimated margin of 2–10 mm in three dimensions.
Table 7. Dose-volume statistics derived from dose-volume histograms for parallel normal critical structures and comparison to the series by Lee et al. [22]. D50: dose to 50% of volume; D80: dose to 80% of volume; NA: not assessable; PTV: planning target volume; TMJ: temporomandibular joint. Tabelle 7. Dosis-Volumen-Statistik von Dosis-Volumen-Histogrammen für parallele kritische Normalstrukturen im untersuchten Kollektiv und Vergleich zur Serie von Lee et al. [22]. D50: Dosis in 50% des Volumens; D80: Dosis in 80% des Volumens; NA: nicht angebbar; PTV: Planungszielvo-lumen; TMJ: Kiefergelenk.
Organ Current study Lee et al. [22]
Volume (cm3) Average (range) D50 (Gy) Average (range) D80 (Gy) Average (range) D50 (Gy) Average (range) D80 (Gy) Average (range) Parotid gland • Right 25.4 (13.8–41.4) 31.1 (17.5–68.2) 21.8 (13.6–59.6) 34.8 (7.9–72.3) 24.6 (5.5–67.7) • Left 29.5 (25.7–46.6) 32.6 (21.2–69.3) 22.6 (13.0–67.8) 33.9 (13.4–60.0) 24.4 (6.2–52.8) Parotid outside PTV NA NA • Right 15.2 (5.0–32.1) 24.3 (16.8–49.6) 19.5 (13.3–46.6) • Left 14.6 (0.2–36.6) 24.4 (17.8–46.0) 19.7 (11.9–41.0) TMJ • Right 36.7 (13.4–64.6) 30.9 (11.4–60.1) 49.0 (19.4–79.0) 44.3 (16.5–78.2) • Left 36.9 (23.7–64.4) 30.7 (17.5–55.0) 49.5 (24.9–78.3) 43.1 (21.1–74.0) Ear • Right 41.4 (21.9–69.9) 35.3 (19.3–68.3) 49.5 (12.8–74.4) 42.4 (8.8–72.0) • Left 44.9 (24.8–68.4) 38.2 (20.3–61.7) 48.7 (20.2–64.3) 42.9 (12.5–60.6)
estimated that parotid tolerance is likely a stepwise function [11], our results could suggest that achievement of dose reduc-tion at any dose level may improve the probability of parotid function.
The compliance rate to chemotherapy was similar to other IMRT studies [4, 8, 12, 20, 22, 40], as 69% of our patients com-pleted the chemotherapy regimen protocol. In the Intergroup trial [1], this number reached the proportion of only 55% in the adjuvant part, with the most frequently mentioned rea-son for noncompliance the refusal by the patient to undergo additional treatment and/or toxicity. A high level of compli-ance to chemotherapy seems important, as it has been sug-gested the addition of chemotherapy confers more benefit for WHO type 1 tumors than for type 3 tumors [30].
Conclusion
The somewhat lower dose delivered to the high-dose PTV in our non-Asian NPC patients, presenting with less radioresponsive WHO type 1 histology and predominantly advanced stage, did not translate into a clearly lower disease control, while likely related to the very satisfactory treatment tolerance. As a consequence of the somewhat lower DVH
val-ues resulting from our IMRT dose specification, we changed the standardization of our internal IMRT dose constraints to-ward some higher GTV dosage by normalizing to the GTV (100% prescription of the isodose should surround GTV + 0–5 mm, resulting in a mean PTV GTV of ~ 103%), while the 95% isodoses should still surround the other PTVs.
References
1. Al-Sarraf M, LeBlanc M, Giri PG, et al. Chemoradiotherapy versus radiothera-py in patients with advanced nasopharyngeal cancer: phase III randomized Intergroup study 0099. J Clin Oncol 1998;16:1310–7.
2. Bhattacharyya N. The impact of race on survival in nasopharyngeal carci-noma: a matched analysis. Am J Otolaryngol 2004;25:94–7.
Table 8. Results from selected series treating NPC with intensity-modulated radiotherapy (IMRT) ± chemotherapy (Chemo). DFS: disease-free survival; DMFS: distant metastases-free survival; FU: follow-up; fx: fraction; LC: local control; MSKCC: Memorial Sloan-Kettering Cancer Center; NA: not assessable; OS: overall survival; RC: regional control; UCSF: University of California, San Francisco; WHO: World Health Organization. Tabelle 8. Resultate ausgewählter Publikationen zur intensitätsmodulierten Radiotherapie (IMRT) ± Chemotherapie (Chemo) bei Patienten mit Nasopharynxkarzinom. DFS: krankheitsfreies Überleben; DMFS: fernmetastasenfreies Überleben; FU: Verlaufsbeobachtung; fx: Fraktion; LC: lokale Tumorkontrolle; MSKCC: Memorial Sloan-Kettering Cancer Center; NA: nicht angebbar; RC: nodale Kontrolle; OS: Gesamtüberleben; UCSF: Univer-sity of California, San Francisco; WHO: Weltgesundheitsorganisation.
Study Patients (n) Inclusion period (median FU) WHO type 1 (%) Cauca-sians (%) Stage III/IV (%) Chemo (%) Dose total (Gy)/fx Time point (year) LC (%) RC (%) DMFS (%) DFS (%) OS (%) Grade 4 late toxi-city (%) Kam et al., 2003 [18] (Hong Kong) 63 2000–2002 (29 months) 0 0 57 30 66/2a 3 92 98 79 NA 90 0 Bucci et al., 2004 [4] (UCSF) 118 1995–2003 (30 months) NA 18 74 90 69.9/2.11 4 96 98 72 NA 74 8 Chong et al., 2004 [8] (China) 118 2001–2004 (19 months) 0 0 50 NA 70/2.33 3 98 NA 88 NA 86 7 Wolden et al., 2006 [40] (MSKCC) 74 1998–2004 (35 months) 5 68 77 93 70.2/2.34 3 91 93 78 67 83 0 Kwong et al., 2006 [20] (Hong Kong) 50 2000–2004 (25 months) 0 0 100 68 70/2 2 94 95 94 93 92 8 Fang et al., 2008 [12] (Taiwan) 110 2002–2004 (40 months) 2 0 53 57 70.2– 75.6/1.8 3 84 84 83 NA 85 NA 0225 RTOG, 2008 [21] (USA) 68 2003–2005 (24 months) NA 54 59 NA 70/2.12 2 92 90 86 73 79 0 Present study 39 2002–2008 (30 months) 41 95 85 97 69.9/2.11 3 86 89 85 72 85 0
aAfter IMRT, brachytherapy (4 × 3 Gy) or conformal boost (4 × 2 Gy) was delivered additionally
Table 9. Coverage of level Ib lymph nodes (n = 78; two levels Ib/ patient).
Tabelle 9. Dosierung der Lymphabflussregion Ib (n = 78), zwei Levels Ib/Patient).
Nodal status n Ib contoured
(%) > 50 Gy > 45 Gy 30–45 Gy < 30 Gy
N0 23 (30) 0 0 5 18
3. Bratengeier K. Applications of two-step intensity modulated arc therapy. Strahlenther Onkol 2001;177:394–403.
4. Bucci M, Xia P, Lee N, et al. Intensity modulated radiation therapy for car-cinoma of the nasopharynx: an update of the USCF experience [Abstract]. Int J Radiat Oncol Biol Phys 2004;60:317–8.
5. Burt RD, Vaughan TL, McKnight B. Descriptive epidemiology and survival analysis of nasopharyngeal carcinoma in the United States. Int J Cancer 1992;52:549–56.
6. Chang JT, See LC, Tang SG, et al. The role of brachytherapy in early-stage nasopharyngeal carcinoma. Int J Radiat Oncol Biol Phys 1996;36:1019–24. 7. Cheng JC, Chao KS, Low D. Comparison of intensity modulated radiation
therapy (IMRT) treatment techniques for nasopharyngeal carcinoma. Int J Cancer 2001;96:126–31.
8. Chong Z. Improved local control with intensity modulated radiation therapy in patients with nasopharyngeal carcinoma [Abstract]. Int J Radiat Oncol Biol Phys 2004;60:317.
9. Cooper J, Fleming ID, eds. Head and neck cancer. AJCC manual for staging of cancer, 6th edn. Philadelphia: Lippincott, 2002.
10. Cox JD, Stetz J, Pajak TF. Toxicity criteria of the Radiation Therapy Oncology Group (RTOG) and the European Organization for Research and Treatment of Cancer (EORTC). Int J Radiat Oncol Biol Phys 1995;31:1341–6.
11. Eisbruch A, Ten Haken RK, Kim HM, et al. Dose, volume, and function re-lationships in parotid salivary glands following conformal and intensity-modulated irradiation of head and neck cancer. Int J Radiat Oncol Biol Phys 1999;45:577–87.
12. Fang FM, Chien CY, Tsai WL, et al. Quality of life and survival outcome for patients with nasopharyngeal carcinoma receiving three-dimensional con-formal radiotherapy vs. intensity-modulated radiotherapy – a longitudinal study. Int J Radiat Oncol Biol Phys 2008;72:356–64.
13. Hara W, Loo BW Jr, Goffinet DR, et al. Excellent local control with stereo-tactic radiotherapy boost after external beam radiotherapy in patients with nasopharyngeal carcinoma. Int J Radiat Oncol Biol Phys 2008;71:393–400. 14. Hoppe RT, Goffinet DR, Bagshaw MA. Carcinoma of the nasopharynx.
Eighteen years’ experience with megavoltage radiation therapy. Cancer 1976;37:2605–12.
15. Hsiung CY, Yorke ED, Chui CS, et al. Intensity-modulated radiotherapy ver-sus conventional three-dimensional conformal radiotherapy for boost or salvage treatment of nasopharyngeal carcinoma. Int J Radiat Oncol Biol Phys 2002;53:638–47.
16. Hunt MA, Zelefsky MJ, Wolden S, et al. Treatment planning and delivery of intensity-modulated radiation therapy for primary nasopharynx cancer. Int J Radiat Oncol Biol Phys 2001;49:623–32.
17. Kalogera-Fountzila A, Karanikolas D, Katodritis N, et al. Prognostic factors and significance of the revised 6th edition of the AJCC classification in patients with locally advanced nasopharyngeal carcinoma. Strahlenther Onkol 2006;182:458–66.
18. Kam MK, Chau RM, Suen J, et al. Intensity-modulated radiotherapy in naso-pharyngeal carcinoma: dosimetric advantage over conventional plans and feasibility of dose escalation. Int J Radiat Oncol Biol Phys 2003;56:145–57. 19. Kotas M, Schmitt P, Jakob PM, et al. Monitoring of tumor oxygenation
changes in head-and-neck carcinoma patients breathing a hyperoxic hyper-capnic gas mixture with a noninvasive MRI technique. Strahlenther Onkol 2009;185:19–26.
20. Kwong DL, Sham JS, Leung LH, et al. Preliminary results of radiation dose escalation for locally advanced nasopharyngeal carcinoma. Int J Radiat Oncol Biol Phys 2006;64:374–81.
21. Lee N, Harris J, Garden AS, et al. Phase II multi-institutional study of intensity modulated radiation therapy (IMRT) +/– chemotherapy for nasopharyngeal carcinoma (NPC): preliminary clinical results of RTOG 0225. Int J Radiat Oncol Biol Phys 2008;72:Suppl 1:S98.
22. Lee N, Xia P, Quivey JM, et al. Intensity-modulated radiotherapy in the treatment of nasopharyngeal carcinoma: an update of the UCSF experience. Int J Radiat Oncol Biol Phys 2002;53:12–22.
23. Lee SW, Nam SY, Im KC, et al. Prediction of prognosis using standardized up-take value of 2-[(18)F] fluoro-2-deoxy-d-glucose positron emission tomog-raphy for nasopharyngeal carcinomas. Radiother Oncol 2008;87:211–6. 24. Marks JE, Phillips JL, Menck HR. The National Cancer Data Base report on
the relationship of race and national origin to the histology of nasopharyn-geal carcinoma. Cancer 1998;83:582–8.
25. Mesic JB, Fletcher GH, Goepfert H. Megavoltage irradiation of epithelial tumors of the nasopharynx. Int J Radiat Oncol Biol Phys 1981;7:447–53. 26. Munter MW, Debus J, Hof H, et al. Inverse treatment planning and
ste-reotactic intensity-modulated radiation therapy (IMRT) of the tumor and lymph node levels for nasopharyngeal carcinomas. Description of treat-ment technique, plan comparison, and case study. Strahlenther Onkol 2002;178:517–23.
27. Palazzi M, Orlandi E, Bossi P, et al. Further improvement in outcomes of nasopharyngeal carcinoma with optimized radiotherapy and induction plus concomitant chemotherapy: an update of the Milan experience. Int J Radiat Oncol Biol Phys 2009;74:774–80.
28. Poon I, Xia P, Weinberg V, et al. A treatment planning analysis of inverse-planned and forward-inverse-planned intensity-modulated radiation therapy in naso-pharyngeal carcinoma. Int J Radiat Oncol Biol Phys 2007;69:1625–33. 29. Reddy SP, Raslan WF, Gooneratne S, et al. Prognostic significance of
kerati-nization in nasopharyngeal carcinoma. Am J Otolaryngol 1995;16:103–8. 30. Rischin D, Peters LJ. The local-regionally advanced nasopharyngeal
carci-noma jigsaw puzzle: where does the chemotherapy piece fit? J Clin Oncol 2002;20:1968–70.
31. Salz H, Wiezorek T, Scheithauer M, et al. IMRT with compensators for head-and-neck cancers. Treatment technique, dosimetric accuracy, and practical experiences. Strahlenther Onkol 2005;181:665–72.
32. Sanguineti G, Geara FB, Garden AS, et al. Carcinoma of the nasopharynx treated by radiotherapy alone: determinants of local and regional control. Int J Radiat Oncol Biol Phys 1997;37:985–96.
33. Studer G, Huguenin PU, Davis JB, et al. IMRT using simultaneously integrated boost (SIB) in head and neck cancer patients. Radiat Oncol 2006;1:7. 34. Studer G, Luetolf UM, El-Bassiouni M, et al. Volumetric staging (VS) is
superior to TNM and AJCC staging in predicting outcome of head and neck cancer treated with IMRT. Acta Oncol 2007;46:386–94.
35. Studer G, Luetolf UM, Glanzmann C. Locoregional failure analysis in head-and-neck cancer patients treated with IMRT. Strahlenther Onkol 2007;183:417–23, discussion 424–5.
36. Vikram B, Mishra UB, Strong EW, et al. Patterns of failure in carcinoma of the nasopharynx: I. Failure at the primary site. Int J Radiat Oncol Biol Phys 1985;11:1455–9.
37. Wang CC. Improved local control of nasopharyngeal carcinoma after intra-cavitary brachytherapy boost. Am J Clin Oncol 1991;14:5–8.
38. WHO. International histological classification of tumors, vol 19. Histologi-cal typing of upper respiratory tract tumors. Geneva: WHO, 1978:32. 39. Wiggenraad R, Mast M, van Santvoort J, et al. ConPas: a 3-D conformal
parotid gland-sparing irradiation technique for bilateral neck treatment as an alternative to IMRT. Strahlenther Onkol 2005;181:673–82.
40. Wolden SL, Chen WC, Pfister DG, et al. Intensity-modulated radiation therapy (IMRT) for nasopharynx cancer: update of the Memorial Sloan-Kettering experience. Int J Radiat Oncol Biol Phys 2006;64:57–62.
41. Wolden SL, Steinherz PG, Kraus DH, et al. Improved long-term survival with combined modality therapy for pediatric nasopharynx cancer. Int J Radiat Oncol Biol Phys 2000;46:859–64.
42. Wolden SL, Zelefsky MJ, Hunt MA, et al. Failure of a 3D conformal boost to improve radiotherapy for nasopharyngeal carcinoma. Int J Radiat Oncol Biol Phys 2001;49:1229–34.
43. Xia P, Fu KK, Wong GW, et al. Comparison of treatment plans involving intensity-modulated radiotherapy for nasopharyngeal carcinoma. Int J Radiat Oncol Biol Phys 2000;48:329–37.
44. Yu MC, Yuan JM. Epidemiology of nasopharyngeal carcinoma. Semin Cancer Biol 2002;12:421–9.
Address for Correspondence Dr. Gabriela Studer Radiotherapie, USZ Universitätsspital Zürich Rämistraße 100 8091 Zürich Switzerland Phone (+41/44)255-2931, Fax -4547 e-mail: gabriela.studer@usz.ch