© Polish Academy of Sciences (PAN), Committee on Agronomic Sciences JOURNAL OF WATER AND LAND DEVELOPMENT Section of Land Reclamation and Environmental Engineering in Agriculture, 2019 2019, No. 42 (VII–IX): 49–58 © Institute of Technology and Life Sciences (ITP), 2019 PL ISSN 1429–7426, e-ISSN 2083-4535 Available (PDF): http://www.itp.edu.pl/wydawnictwo/journal; http://www.degruyter.com/view/j/jwld; http://journals.pan.pl/jwld
Received 17.11.2018 Reviewed 20.12.2018 Accepted 06.01.2019 A – study design B – data collection C – statistical analysis D – data interpretation E – manuscript preparation F – literature search
Experimental versus theoretical study
of reverse osmosis pilot scaling:
The case of Algerian brackish water desalination
Abderrezak BOUCHAREB
ABCEF , Mehdi METAICHE
DEF,
Hakim LOUNICI
DEFBouira University,Faculty of Sciences and Applied Sciences, Department of Chemistry, 10000 Bouira, Algeria;
e-mail: [email protected], [email protected], [email protected]
For citation: Bouchareb A., Metaiche M., Lounici H. 2019. Experimental versus theoretical study of reverse osmosis pilot scaling: The case of Algerian brackish water desalination. Journal of Water and Land Development. No. 42 (VII–IX) p. 49–58. DOI: 10.2478/jwld-2019-0044.
Abstract
In recent years, the increasing threat to ground water quality due to human activities has become a matter of great con-cern. The ground water quality problems present today are caused by contamination and by over exploitation or by combi-nation of both. Reverse osmosis (RO) desalicombi-nation is one of the main technologies for producing fresh water from sea water and brackish ground water.
Algeria is one of the countries which suffer from the water shortage since many years, so desalination technology be-comes inevitable solution to this matter.
In this study, a comparison is provided of results of reverse osmosis desalination for three different qualities of brack-ish water from the central-east region of Algeria (Bouira and Setif Prefectures), wherein they cannot use it as human drink-ing or in irrigation systems. The main objective of our study is to establish a comparison of the reverse osmosis membrane TW30-2540 performances in the term of (permeate flow, recovery rate, permeate total dissolved solids – TDS and salts re-jection) under different operation pressures (each one takes a time of 720 second for pilot scaling). In order to make an overview comparison between the experimental and the simulated results we used ROSA (Reverse Osmosis System Analy-sis) software.
At the end of this study we noted that, the simulated results are lower than the pilot scaling values and the most re-moved salts are the sodium chlorides with 99.05% of rejection rate.
Key words: ions salts rejection, reverse osmosis (RO), ROSA software, salt passage (B), spiral wound membrane (SWM)
INTRODUCTION
According to the world population clock, the popula-tion exceeds 7 billion and will reach 10 billion by 2050. Pure drinking water would be a major problem for the de-veloping countries in the world. The improvement in the efficiency and cost of water treatment is a major challenge to overcome the scarcity of portable water [LALIA et al. 2013]. Due to multitude human activities from the industry to agriculture without forgotten the natural disasters; now-adays the demand of high quality ground water it became inevitable necessary, this to reduce the spread of epidemics
as well as satisfying the popular needs. Declining resources of potable water are social and political as well as econom-ic problem in many parts of the world. In addition, the re-quirements for the quality of the water are getting stricter and generally include wide range of needed analyses [MALCZEWSKA 2016].
There are 26 countries that do not have sufficient wa-ter resources to sustain agriculture and economic develop-ment, and approximately one billion people lack access to safe drinking water. Particular regions with water scarcity include a significant portion of the Middle East, North Af-rica, eastern Australia, parts of Central and South Asia, and
the south-western areas of North America. In addition, the projected 40–50% growth in human population over the next 50 years, coupled with industrialization and urbaniza-tion, will result in an increasing demand on the available water resources. While economic use and recycling of wa-ter for human and animal consumption can mitigate the problem to some extent, alternative sources of clean water are required to address this growing need [ELKHARAZ et al. 2012].
Algeria is one of the countries in the world with water resources that are well below the threshold adopted by the World Bank. The situation is aggravated by the fact that there is a wrong spatial distribution of the water, seasonal and inter-annual irregularities of the rainfall, filling up of the reservoirs with sediment, vast losses of water due to the aging of the municipal distribution networks, bad manage-ment of the resources, pollution, insufficient infrastructure, and a lack of maintenance. The shortage of water affects both the drinking water supplies for the population and the supply of irrigation water for the farmers [World Bank 2004]; Algeria is one of the countries which they suffer from the water shortage since many years, so desalination technology became inevitable solution to this matter.
Desalination is used to separate salt from raw water for a different use specially in production of potable water, the process is carried out through distillation (evaporation, multi effect vapour compression) or membrane process such as reverse electro-dialysis reversal, nano-filtration and reverse osmosis (RO) [SUBRAMANI, PANDA 2014]. For the desalination of brackish water, RO is the method that is mainly used, as it is the most economic. Brackish water total dissolved solids (TDS) which can vary from 2 g∙dm–3
to approximately 10 g∙dm–3, affects the cost of water
pro-duced in general ranges the range vary from 0.26 to 0.54 $∙m–3. When small units of 1000 m3∙(24 h)–1 cost can vary
between 0.78 to 1.33 $∙m–3.
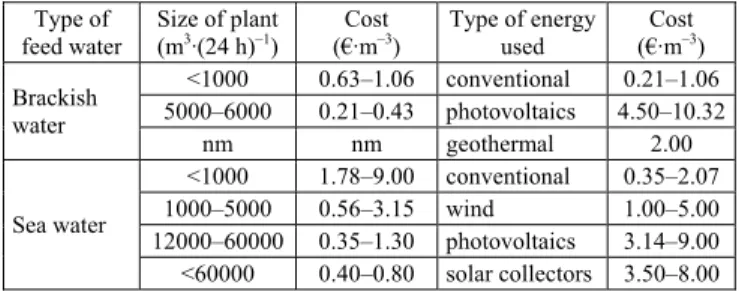
Desalination systems can be divided in two categories: those which use a conventional source of energy and those powered by renewable energy sources (wind, solar, etc.); is well known that the cost of water produced from desalina-tion systems using a convendesalina-tional source of energy (gas, oil, electricity) is much lower that the systems with renew-able energy sources. In Trenew-able 1 we show the different cost between brackish and seawater desalination in term of unit capacity and energy sources [KARAGIANNIS, SOLDATOS 2008]. From this table we noticed that the renewable ener-gy source provide high desalination cost compared to a conventional and was limited only for small units.
Membrane process represent one of the most feasible option for water shortage alleviation and water supply augmentation such examples includes micro-filtration (MF) and ultra-filtration (UF) for membrane bioreactor in waste water treatment and pretreatment in sea water desal-ination as well as nano-filtration (NF) and reverse osmosis (RO) in brackish water and sea water desalination [BONG -CHUL et al. 2014].The membranes play a key role in mem-brane-based water treatment processes and determine the technological and economic efficiency of the aforemen-tioned technologies; membrane improvement can greatly affect the performance of current technology.
Table 1.The different cost between brackish and seawater desali-nation in term of unit capacity and energy sources
Type of feed water
Size of plant
(m3∙(24 h)–1) (€∙mCost –3) Type of energy used (€∙mCost –3)
Brackish water <1000 0.63–1.06 conventional 0.21–1.06 5000–6000 0.21–0.43 photovoltaics 4.50–10.32 nm nm geothermal 2.00 Sea water <1000 1.78–9.00 conventional 0.35–2.07 1000–5000 0.56–3.15 wind 1.00–5.00 12000–60000 0.35–1.30 photovoltaics 3.14–9.00 <60000 0.40–0.80 solar collectors 3.50–8.00 Explanation: nm = not mention.
Source: own elaboration based on KARAGIANNIS andSOLDATOS [2008]. Reverse osmosis, is a well-known membrane technol-ogy for treatment of wastewater and production of potable or irrigation water; most industries, especially oil and gas refineries, utilize RO plants to provide highly purified wa-ter for various plants and equipment, such as reboilers [TAHERIFAR et al. 2015]. The RO membrane is a versatile method that has been widely adopted in water treatment applications such as desalination process is currently the undisputed leading method, this method has been estab-lished to be the most economical technology for the desali-nation of brackish and sea water. RO membranes are capa-ble of rejection most ions and even mono-valent ion such
as Na+ and Cl– present in sea water with 99% rejection
rate; the spiral wound membrane (SWM) module the basic component for building a very broad range of water treat-ment facilities, for sea- and brackish-water desalination as well as purification of assorted effluents for reuse. Have presented an illuminating account of technological devel-opments and industrial requirements that have led to the dominance of SWM modules in desalination and water
treatment applications by JOHNSON and BUSH [2010] and
HCHAICHI et al. [2014].
A membrane envelope is made of two sheets, glued at the three edges, with a fabric filling the permeate channel. The open permeate-side of this envelope is fixed on a per-forated inner tube where the permeate is collected. Several envelopes, separated by relatively thin net-type spacers, are tightly wrapped around the perforated inner tube. The morphology of commercial elements, including the recent-ly developed large (0.4064–0.4572 m) elements, has re-mained essentially unchanged. Moreover, plans for even larger (0.6096 m) module, are apparently based on the same SWM morphology. During recent decades, very significant improvements in SWM performance were due
to improved membrane surface characteristics by [ELIME
-LECHM,PHILLIP 2011; KURINAHARA,HANAKUWA 2013]. In the compact design of SWM modules, packing a large membrane surface area per unit volume leads to very narrow spacer-filled flow channels (of gap less than 1 mm, which tend to aggravate operating problems, i.e. friction losses, membrane fouling and scaling. Moreover, this design poses serious challenges to investigators aiming to study in detail SWM module performance. Specifically, despite recent progress e.g. detailed/local non-invasive measurements inside real modules are almost impossible to make, thereby depriving investigators of essential
The purpose of this paper is to achieve a global com-parison between reverse osmosis pilot scaling and software (ROSA – reverse osmosis system analysis) simulation re-sults in the terms of (permeate flow, recovery rate, perme-ate TDS and salts rejection), in this context were used three different brackish water from the Central-East of Algeria (Bouira and Setif prefectures) in which they suffer from the high salinity of water quality as well as the water short-age, under a commercial membrane TW30-2540 which represents the inexpensive membrane module in the range of brackish water desalination, thus is available for all users.
During this study were worked with five different op-eration pressure each of them took a time of 720 s, in order to study the effect of those pressures on the evolution of (permeate and feed) conductivity, permeate flow, recovery rate and ions salts rejection.
METHODS AND MATERIALS
FEED WATER CHARACTERIZATION
The feed water came from three different wells from inland region (Bouira and Setif prefectures) of Algeria. The characteristics of the feed water are given in Table 2. It should be noted that all feed water took a conventional pretreatment before they passed by RO pilot, this pretreat-ment is based on chemical coagulant/flocculent the ferric chloride hexa-hydrate (FeCl3∙6H2O) and cationic polymer
(bentonite) from Canada.
Table 2. Feed water characteristics
Characteristic Measurement unit Well I (Setif) (Bouira) Well II (Bouira)Well III
pH – 7.75 6.95 7.05 Temperature °C 17.3 19 19 Conductivity mS∙cm–1 6.46 3.77 4.65 Calcium mg∙dm–3 560.88 228 280 Sodium mg∙dm–3 1360 680 1020 Magnesium mg∙dm–3 106.27 43.20 54.72 Potassium mg∙dm–3 1.42 15.90 2.10 Chloride mg∙dm–3 2680 1340 2000 Bicarbonate mg∙dm–3 549 427 219.6 Sulphate mg∙dm–3 85 85 98 Carbonate mg∙dm–3 0.53 0.33 1.66
Source: own elaboration.
REVERSE OSMOSIS MEMBRANE
The cartridge type RO membrane used in this study was commercial membrane TW30-2540. The membranes are spiral wound modules each with a surface area of 2.6 m2 and allowing a permeate flow of 3.2 m3∙(24 h)–1
with a salt rejection of 99.5%. The operating characteris-tics of the membrane are as follows in Table 3.
REVERSE OSMOSIS PILOT
A multi-cellular centrifugal pump high pressure (16∙105 Pa, 800 dm3∙h–1) feeds a circuit including a RO
Table 3. Sheet TW30-2540 membrane characteristic Specification Characteristic Membrane type polyamide thin-film composite Maximum operating temperature a 113°F (45°C)
Maximum operating pressure 600 psig (41∙105 Pa)
Maximum feed flow rate 6 gpm (1.4 m3∙h–1)
Maximum pressure drop 13 psig (0.9∙105 Pa)
pH range, continuous operation 2–11 pH range, short-term cleaning (30 min)b 1–13
Maximum feed silt density index SDI 5 Free chlorine tolerance c <0.1 10–3 g∙dm–3
Explanations: a = maximum temperature for continuous operation above pH 10 is 95°F (35°C); b = Refer to Cleaning Guidelines in specification sheet 609-23010; c = under certain conditions, the presence of free chlo-rine and other oxidizing agents will cause premature membrane failure. Source: Dow [undated].
cartridge. This circuit consists of a power supply, a dis-charge and permeate.
The tank containing the solution to be treated is 100 dm3 capacity; the drip tray has a capacity of 20 dm3. They
are both transparent PVC. The feed tank is filled via a filter 25∙10–6m and an active carbon filter (5∙10–6 m). The driver
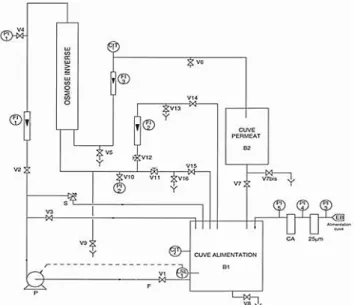
can thus operate independently from the input tray. The pump stops automatically when the low level of the tank is reached. In Figure 1 we show the principal layout of re-verse osmosis pilot.
Fig. 1. Schematic diagram of reverse osmosis MP20 device; source: own elaboration
Lists instrumentation and controls included in the sys-tem are presented in Table 4.
Table 4. Pilot instrumentations
Purpose Model number
Pump e-SV K 3
Flow PDP/731
Pressure D100-MEX5
Conductivity and temperature M CLM 223 Source:own elaboration.
PILOT CONFIGURATION
Single stage (continuous) reverse osmosis
Most exiting RO systems operate in single-stage (or single-pass) configuration. In a single-stage RO, the feed solution concentration along the membrane channel in-creases as water permeates across the semi-permeable membrane under an applied hydraulic pressure that is higher than the local osmotic pressure (Fig. 2).
Fig. 2. Schematic representation of the single stage reverse
osmosis process; PF = feed pressure, QF = feed flow, CF = feed
pressure, QB = brine flow, Cr = retentate concentration,
Po = atmospheric pressure, Qp = permeate flow, Cp = permeate
concentration; source: own elaboration
Batch reverse osmosis
In a closed-circuit (batch-RO) process, the retentate (brine) solution of the module (stream S3 in Figure 3)
re-circulates in closed circuit where it mixes with the feed solution of the system (S1) to become the influent solution
to the module (S2).
Here, the feed solution of the system (S1) represents
the source water to be desalinated, which has an osmotic pressure of π0. The influent solution to the module (S2),
resulting from mixing the retentate solution (S3) with the
feed water (S1), has an increasing osmotic pressure as the
solutes accumulate in the circuit. To maintain a positive driving force across the membrane, the applied hydraulic pressure must be increased along with the increasing os-motic pressure.
Fig. 3. Schematic representation of the batch reverse osmosis
process; S1 = feed stream, S2 = mixture of (feed + brine) stream,
S3 = permeate stream; source: own elaboration
GOVERNING EQUATIONS
The RO membrane model is developed based on the following basic assumptions [GERALDES et al. 2005; VAN DER MEER, VAN DIJK 1997]:
1) pressure drop along the permeate channel is ne-glected; this assumption is reasonable for 20.32 cm. Spiral
wound module that has 37 membrane leaves with a length of 1 m;
2) the feed channels of spiral wound element are flat; feed stream flow along the channel parallel to the central line of the module and the curvature of membrane module was reported to have in-significant effect on system’s per-formance; therefore, an un-wound flat sheet membrane with same channel height and spacers would adequately represent characteristics of the corresponding spiral wound RO module; water and salt fluxes via the membrane is es-timated by Kimura–Sourirajan model.
Regarding to the main objective of this study we choose some theoretical simplifications based on the works of BOUROUNI [2012], CHAPMANE [2013], Dow [undated].
The water flow rate Qp product by RO membrane was
calculated as Equation (1):
𝑄 𝐴 ∙ 𝑆 ∙ 𝑇𝐶𝐹 ∙ 𝐹 ∙ ∆𝑃 ∆𝜋 (1)
Where: A is the membrane pure water permeability, TCF is the temperature correction factor, F is the membrane foul-ing factor (0.8 = F = 1) in our case we suppose the F = 1, ΔP is the applied trans-membrane pressure and Δ is the trans-membrane osmotic pressure, S membrane active sur-face (m2).
The osmotic pressure in the different elements of RO unit is given by Equation (2):
𝜋 0.002654 𝑇 273 𝐶 (2)
Where C is the salt concentration.
The temperature correction factor TCF is established by the Dow [undated] as Equations (3) and (3’):
𝑇𝐶𝐹 exp 2640 , 𝑇 25°C (3)
𝑇𝐶𝐹 exp 3020 , 𝑇 25°C (3’)
The average pressure dropP between the first and the last element is given by Equation 4:
𝑃 𝑃 𝑃 (4)
∆𝑃 represents the pressure drop between feed and discharge of a single element, it’s given as Equation (5):
∆𝑃 0.01 𝑄 / (5)
The recovery rate Y is given by Equation (6):
𝑌 (6)
The product concentration Cp is function of recovery
rate and salt rejection (Eq. 7); the Brine concentration Cc of
RO element is calculated from the Equation (8):
𝐶 1 𝑌 𝐶 ∙ 𝑃 ∙ 𝑇𝐶𝐹 (7)
𝑄 ∙ 𝐶 𝑄 ∙ 𝐶 𝑄 ∙ 𝐶 (8)
𝑉 𝐴 (9)
Where Ax is the cross section area of the space between
membrane envelopes in the modules calculated as the
length of a module leaf (estimated at 1.016 m) times the
number of leaves times the spacer thickness.
The salts passage B (dimensionless) is given by Equa-tion (10):
𝐵 (10)
We were using the Equation (11) to calculate the rejec-tion ratio R:
𝑅 1 (11)
Concentration polarization CP on membrane surface phenomenon may be described using the film theory [MICHAELS 1968] as function of mass transfer coefficient:
𝐶𝑃 exp (12)
ROSA SOFTWARE
In this study we were used software namely (Reverse Osmosis System Analysis – ROSA), this software has a sophisticated design program that predicts the perfor-mance of membranes in user specified systems, in which has incorporates a model for both process RO/NF. The software has been used with success for the analysis of the performance of membranes, energy requirements and cost for desalination.
In most cases, optimization during the pilot phase is mostly based on the empirical method, involving the spe-cial know-how of the user. This also results in a lengthy period of process development.
The software allows virtual creation of the basic RO/NF design with the choice of feed water composition, feed water flow rate, feed water pressure, temperature and pH. Then, a configuration of the number of membranes, pressure vessels, type of membrane, feed and booster pumps is determined. The software has been used in many research papers for our case we using ROSA 9 by ELA -ZHAR et al. [2013].
In this paper were used a batch configuration for all our experiments for reason to give a better understanding to the phenomena in the term of (time process, trans-mem-brane pressure and recovery rate), in which were worked with five different operation pressures each one took 720 s for pilot scaling, after varying and registering the different parameters, in the next section were discussed the results based on the theoretical equations as well as the software (ROSA) values which will be taken as a reference.
RESULTS AND DISCUSSION
CONDUCTIVITY REMOVAL
As the principal objective of reverse osmosis desalina-tion for both brackish and sea water is to remove the max-imum hardness for get a water sample which satisfy the needs.
In our case and in this section were used three different brackish water to studied the evolution of (permeates and feeds) conductivity related to difference trans-membrane pressure during 3600 s of pilot scaling.
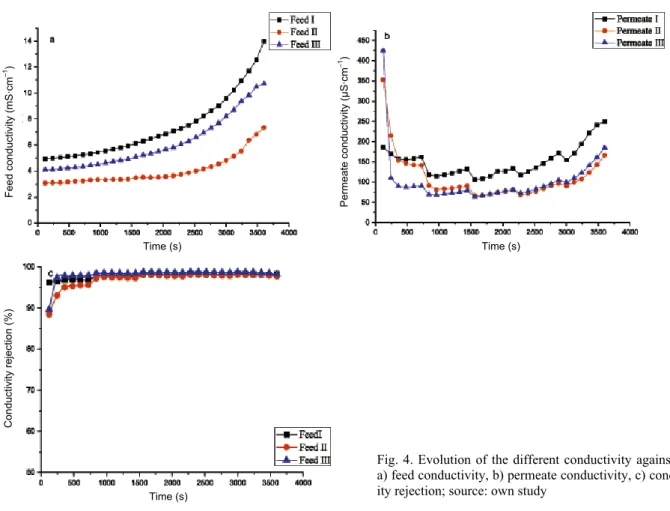
In order to pass to high pressure level each 720 s, with the aid of Endress+Hauser instrument were registered the different values of (feeds and permeates conductivity) as presented in Figure 4.
According to this figure it is clear that the feed con-ductivity increased as the time passed beside the permeate conductivity which remains decreasing in each operation pressure.
As were mentioned above that in this study, were worked with batch process (as indicated in Fig. 3), for rea-son to get a good amount in permeate as well as sufficient time to understand the phenomena.
Under this process, the increase of feed conductivity was explained by the effect of the mixture (feed + brine) in the osmotic pressure values which are increased.
Generally, were confirmed that this membrane under those conditions, could be removed the maximum conduc-tivity with a rate of (97–98%).
PILOT SCALING VERSUS ROSA SIMULATION
In this section was presented the different evolutions which depend on the reverse osmosis theory and based on the experimental test (pilot scaling) and ROSA software simulation, were listed the different results in the Table 5.
EFFECT OF THE OPERATION PRESSURE ON PERMEATES FLOW
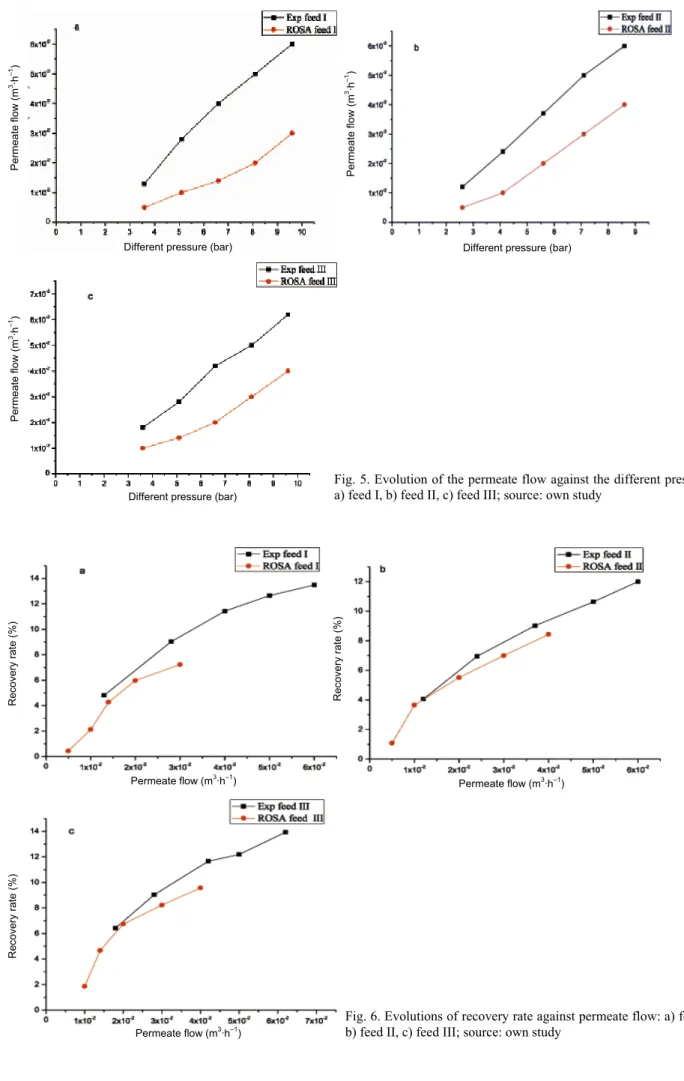
In this section were interested by comparing between the laboratory test (pilot scaling) and the software (ROSA) simulation, in which were presented the effect of the dif-ferent operation pressure on the permeate flow, according to the RO theory (Eq. 1), the permeate flow increase simul-taneously as operation pressure increased, as Figure 5 and Table 5 show, were noticed a constantly increase of the permeate flow followed by an increase in operation pres-sure for both (pilot scaling and ROSA simulation) values which in turn match with RO theory and confirm the pre-vious equation (Eq. 1), knowing that were observed that the simulated results are lower than the experimental val-ues; was explained this decline by the term of the fouling
Table 5. The evolution of different operation pressure P, permeate flow Qp, recovery rate Y and permeate TDS between the pilot scaling and ROSA Software simulation results
Parameter Test Feed I Feed II Feed III
Different operation pressure ΔP (Pa) pilot 36∙104 51∙104 66∙104 81∙104 96∙104 26∙104 41∙104 56∙104 71∙104 86∙104 36∙104 51∙104 66∙104 81∙104 96∙104 ROSA 36∙104 51∙104 66∙104 81∙104 96∙104 26∙104 41∙104 56∙104 71∙104 86∙104 36∙104 51∙104 66∙104 81∙104 96∙104 Permeate flow Qp (m3 ∙h–1 ) pilot 13∙10–3 28∙10–3 4∙10–2 5∙10–2 6∙10–2 12∙10–3 24∙10–3 37∙10–3 5∙10–2 6∙10–2 18∙10–3 28∙10–3 42∙10–3 5∙10–2 62∙10–3 ROSA 5∙10–3 10–2 1.4∙10–2 2∙10–2 3∙10–2 5∙10–3 10–2 2∙10–2 3∙10–2 4∙10–2 10–2 14∙10–3 2∙10–2 3∙10–2 4∙10–2 Recovery
rate Y (%) ROSA pilot 4.810.44 9.032.12 11.43 4.27 12.655.97 13.487.23 1.084.06 3.656.95 9.025.51 10.636.99 8.4312 1.866.42 4.679.03 11.666.74 12.198.22 13.939.57 Permeate
TDS
(mg∙dm–3)
pilot 135.116 90.82 102.52 81.43 74.68 111.553 78.47 83.49 132.37 74.13 143.57 106.24 93.78 103.41 77.34 ROSA 1112.35 250.62 117.66 77.81 58.98 278.48 78.84 46.37 33.68 27.05 238.62 94.02 59.02 44.27 35.94 Source: own elaboration.
factor (F) we take F = 0.85 (standard value of ROSA) and the temperature correlation factor (TCF) from Equations (3) and (3’), (Tfeed> 25°C) the (TCF> 1) or (Tfeed< 25°C)
the (TCF = 1) in our case were worked with temperature lower than 25°C so TCF it’s always less than the unity; those values are the responsible for the decrease of perme-ate flow case of ROSA.
EFFECT OF THE PERMEATE FLOW IN THE RECOVERY RATE
From the RO theory background the evolution of the recovery rate against the permeate flow was managed by the two equations (Equations. 1 and 6), according to the Figure 6 and Table 5 were noticed the same evolution of the recovery rate against the permeate flow for all brackish
permeate flow) in which the recovery rate increase from (4–15%) as the operations pressure varying from (4.105
to106 Pa) that explain by the pilot characteristic (1 pass per
1 stage).
As the ROSA software characteristic (doesn’t take into account batch process) and their values were managed by the correlation factors (fouling and temperature) we ob-served diminution in their results compared with the pilot scaling values.
EFFECT OF THE RECOVERY RATE IN THE PERMEATE QUALITY
The term who specifies the permeate quality is known as TDS, in our case the initial TDS for our feeds water was measured as 3.852, 2.262, 2.790 g∙dm–3 which represent
Feed co nducti vity ( m S∙cm –1 ) Permeate condu cti vity (μS∙cm – 1) Condu ctivi ty re jecti on (%) Time (s) Time (s) Time (s)
Fig. 4. Evolution of the different conductivity against time: a) feed conductivity, b) permeate conductivity, c) conductiv-ity rejection; source: own study
Fig. 5. Evolution of the permeate flow against the different pressure: a) feed I, b) feed II, c) feed III; source: own study
Fig. 6. Evolutions of recovery rate against permeate flow: a) feed I, b) feed II, c) feed III; source: own study
Permeate
fl
ow (m
3∙h –1)
Different pressure (bar) Different pressure (bar)
Different pressure (bar)
Permeate fl ow (m 3∙h –1) Permeate fl ow (m 3 ∙h –1 ) Permeate flow (m3∙h–1) Permeate flow (m3∙h–1) Permeate flow (m3∙h–1) Re cove ry ra te (%) Re cove ry ra te (%) Re cove ry ra te (%)
In this section were represented the effect of recovery rate on the permeate quality.
According to the RO theory and based on the Equa-tions (1), (6) and (7), was noted that the increasing values of the recovery rate followed by decline in permeate TDS values.
As Table 5 and Figure 7 shown for both (pilot scaling and ROSA simulation values) increasing in recovery rate value followed by decline in TDS value which satisfied the RO theory background.
As was indicated above that, in this study we were choosing batch process for our experiment, for this were observed slightly increase in the scaling values, due to the instantaneous increase of osmotic pressure.
THE SALTS PASSAGE (B)
As were calculated the water and the salts permeability for a specific membrane TW30-2540 were found that wa-ter permeability AW = 8.31∙10–12 m∙s–1∙Pa–1 and the salts
permeability B = 4.19∙10–12 m∙s–1∙Pa–1.
With the aid of ionic analysis, in this section were in-terested about ions salt passage during RO operation as we shown in Figure 8.
Equation (10) indicated that the salts passage is direct-ly related to the recovery variation. According to figure 8 were observed that all ions are restricted in the range of [0–0.35].
Regarding to the ions who formed the major salt in water (sodium Na+ and chloride Cl–) they restricted in the
range of [0–0.05], which correspond to the most restricted
ions compared to potassium (K+) and sulphate (SO
42–) who
correspond the most ions penetrate with range of [0.15– 0.35].
According to this were confirmed that the RO mem-brane is more effective with the mono ions such as (Na+)
and (Cl–).
Fig. 8. Salts passage evolution during RO operation for each ions salts; source: own study
A TW30-2540 PERFORMANCE IN IONS SALTS REJECTION
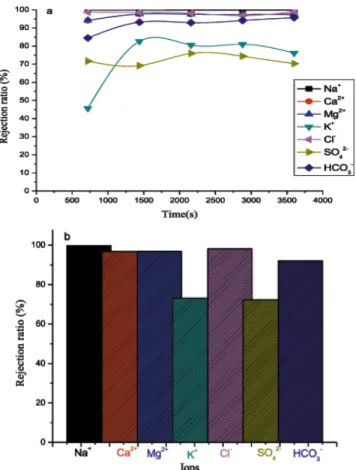
As the manufacturer file for brackish water RO mem-brane (TW30-2540) the rejection ratio for NaCl salt is about 99.5 %, according to RO theory (Eq. 11), in this sec-tion were measured the rejecsec-tion ratio for each ions salts, as were illustrated in Figure 9. The ions are ordered ac-
Fig. 7. The permeate total dissolved solids (TDS) against the re-covery rate: a) feed I, b) feed II, c) feed III; source: own study Recovery rate (%) Recovery rate (%) Recovery rate (%) Permeate TD S (m g∙dm –3) Permeate TD S (m g∙dm – 3) Permeate TD S (m g∙dm –3) Salt passage Time (s)
Fig. 9. Evolution of each ions rejection: a) during operation time, b) final rejection rate of each ions; source: own study
cording to their rejection rate value as: sodium> chloride > magnesium > calcium > bicarbonate > potassium > sul-phate.
The low rejection value for the case of potassium, de-spite being among the mono ions, was explained by the low initial concentration and the competition at the mem-brane surface.
According to those results presenting above, which represented a comparative study between the experimental and simulated results in terms of brackish water reverse osmosis desalination, and based on the reverse osmosis theory background, we provide our discussion as follow: – the preliminary step to determinate the reverse osmosis
membrane performance it based on the conductivity re-moved as were noted above, TW30-2540 had maximum rate for all feed water we took was 98% when the opera-tion pressure attain the 9∙105 Pa;
– in this phase the majority of ions exist in water are re-tracted by the membrane, according to the solution-diffusion mechanism case of reverse osmosis mem-brane;
– in spite of that this study will remain insufficient to de-termine the membrane performance, which implies to add new factors who specified by the rejection of each ion salts in term of his permeability;
– it well known that the water is composed of several salts depend on their ions (mono-ions as well as di-ions) with a various fractions;
– in this work were chosen seven ions (four cation and three anion), as were showed above the maximum ions
rejected by this membrane are the sodium and the chlo-ride thus responsible of the major salt in water (sodium chloride) compared with di-ions which they had the high diffusivity (minimum rejection rate);
– according to this we confirmed that the RO membranes are more efficiency on the mono-ions than the others).
As were mentioned in the aim of this study, we pro-vide a comparison between the simulated and the experi-mental results based on ROSA software and RO pilot scaling.
In this section we took the evolution of three factors (operation pressure on the permeate flow, the permeate flow on the recovery rate and the recovery rate on the per-meate quality).
Based on the RO theory and the configuration choose in this study (batch process), were observed in despite of the same evolution between the experimental and the simu-lated results for all factors, were should be noted that we have a gap on values between them, which explain by the deficient of ROSA Software in case of batch process, real water sample and multivariate condition.
CONCLUSIONS
After making this comparison between the pilot scal-ing and ROSA software simulation, were ended this study by those remarks:
– for ROSA software were noticed that we could not fig-urate all the process (case of batch process) only the single stage configuration which could process it; – their results was lower than the realistic (case of pilot
scaling results) due to the correlations factors (fouling and temperature) in despite were had the same evolution between those results and pilot scaling results;
– about ions salts passage for the TW30-2540 membrane we found that sodium and the chloride are the most re-moved against the sulphate and the potassium which are the most diffuse, as the reverse osmosis principal (re-moving mono salts);
– for the rejection salt, we have a value of 99.05% for the NaCl salt compared with the manufacturer value.
REFERENCES
BONGCHUL K., SANGYOUP L., SEUNGKWAN H. 2014. A novel analysis of reverse draw and feed solute fluxes in forward osmosis membrane process. Desalination. Vol. 352 p. 128– 135.
BOUROUNI K. 2012. Optimization of renewable energy systems: The case of desalination. Modeling and Optimization of Re-newable Energy Systems. Vol. 298 p. 90–116.
CHAPMANE M. 2013. Evaluation of high productivity brackish desalination membrane. Desalination. Vol. 308 p. 41–46. Dow undated. DOW FILMTEC™ Membranes. DOW FILMTEC
tape-wrapped 2540 elements for commercial applications. Product data sheet. Dow Chemical Company pp. 3.
Dow undated. DOW FILMTECTM MEMBRANES. Dow Water
and Process Solutions. Technical Manual. Dow Chemical Company pp. 181.
ELAZHAR F., ELHARRAK N., ELAZHARM., HAFSI M., ELMIDAOUI A. 2013. Feasibility of nanofiltration process in dual stage in
desalination of the seawater. Journal of Applied Chemistry IOSR. Vol. 5 p. 35–42.
ELIMELECHM M., PHILLIP W.A. 2011. The future of sea water desalination: Energy, technology and environment. Science. Vol. 333 p. 712–717.
ELKHARAZ J., ELSADEK A., GHAFFOUR N., MINO E. 2012. Water scarcity and drought in WANA contries. Procedia Engineer-ing. Vol. 33 p. 14–29.
GERALDES V., PEREIRA N.E., DEPINHO M.N. 2005. Simulation and optimization of medium-sized seawater reverse osmosis processes with spiral-wound modules. Industrial and Engi-neering Chemistry Research. Vol. 44 p. 1897–1905.
HCHAICHI H., SIWAR S., ELFIL H., HANNACHI A. 2014. Scaling prediction in sea water reverse osmosis desalination. Mem-brane Water Treatment. Vol. 5 p. 221–233. DOI 10.12989/ mwt.2014.5.3.221.
JOHNSON J., BUSH M. 2010. Engineering aspect of reverse osmo-sis module design. Desalination and Water Treatment. Vol. 15 p. 236–248.
KARAGIANNIS I.C., SOLDATOS P.G. 2008. Water desalination cost literature: Review and assessment. Desalination. Vol. 22 p. 448–456.
KARABELAS A.J., KOSTOLOGOU M., KOUTSOU C.P. 2015. Model-ing of spiral wound membrane desalination modules and plants-review and research priorities. Desalination. Vol. 356 p. 165–185.
KURIHARA M., HANAKAWA M. 2013. Mega-Ton Water System: Japanese National research and development project on sea
water desalination and west water reclamation. Desalination. Vol. 308 p. 131–137.
LALIA B.S., KOCHKODAN V., HASHAIKEH R., HILAL N. 2013.
A review on membrane fabrication: Structure, properties and performance relationship. Desalination. Vol. 326 p. 77–95. MALCZEWSKA B. 2016. Evaluation of effectiveness of natural
organic compounds removal from water in hybrid processes. Journal of Water and Land Development. Vol. 30 (VII–IX) p. 81–85. DOI 10.1515/jwld-2016-0024.
MICHAELS A.S. 1968. New separation technique for the chemical process industries. Chemical Engineering Progress. Vol. 64 p. 31–43.
SUBRAMANI S., PANDA R.C. 2014. Statistical regression and mod-eling analysis for reverse osmosis desalination process. De-salination. Vol. 351 p. 120–147.
TAHERIFAR H., REZVANTALAB S., BAHADORI F., SADRWADEK
KHOEI O. 2015. Treatments of reverse osmosis concentrate
using natural zeolites. Journal of Water and Land Develop-ment. No. 25 (IV–VI) p. 41–46. DOI 10.1515/jwld-2015-0012.
VAN DER MEER W.G.J., VAN DIJK J.C. 1997. Theoretical optimi-zation of spiral-wound and capillary nanofiltration modules. Desalination. Vol. 113 p. 129–146.
World Bank 2004. Seawater and brackish water desalination in the Middle East, North Africa and Central Asia: A review of key issues and experience in six countries. Vol. 2. Annex 1 – Algeria pp. 38 [online]. [Access 10.10.2018]. Available at: http://documents.worldbank.org/curated/en/42116146819192 7352/Annex-1-Algeria
Abderrezak BOUCHAREB, Mehdi METAICHE, Hakim LOUNICI
Eksperymentalne i teoretyczne badania odwróconej osmozy: Przykład odsalania słonawych wód Algierii STRESZCZENIE
Rosnące zagrożenie dla jakości wód podziemnych w związku z działalnością człowieka rodzi w ostatnich latach po-ważne obawy. Obecne problemy z jakością wód gruntowych są spowodowane zanieczyszczeniem i nadmierną eksploatacją albo obiema przyczynami łącznie. Odsalanie metodą odwróconej osmozy jest jedną z głównych technologii, mających na celu produkcję wody słodkiej z wody morskiej lub ze słonawych wód podziemnych.
Algieria jest jednym z krajów, które od wielu lat cierpią na niedostatek wody. Odsalanie jest więc nieuniknionym roz-wiązaniem.
Przedstawione badania ukazują porównanie wyników odsalania trzech wód słonawych o różnej jakości pochodzących ze środkowowschodniego regionu Algierii (prefektury Bouira i Setif), gdzie wód tych nie można stosować ani do zaopa-trzenia ludności, ani do nawodnień. Głównym celem badań było porównanie działania membrany TW30-2540 mierzonego przepływem, tempem odzysku, przepuszczalnością rozpuszczonych soli i usuwaniem soli w warunkach stosowania różne-go ciśnienia (w pilotowym teście każdy wariant trwał 720 s). Do porównania wyników eksperymentalnych i symulowa-nych użyto programu ROSA (Reverse Osmosis System Analysis).
Wartości symulowane były mniejsze niż eksperymentalne wyniki testu pilotażowego, większość usuwanych soli sta-nowił chlorek sodu. Efektywność jego usuwania wyniosła 99,05%.