HAL Id: hal-03083046
https://hal.archives-ouvertes.fr/hal-03083046
Submitted on 22 Dec 2020HAL is a multi-disciplinary open access archive for the deposit and dissemination of sci-entific research documents, whether they are pub-lished or not. The documents may come from teaching and research institutions in France or abroad, or from public or private research centers.
L’archive ouverte pluridisciplinaire HAL, est destinée au dépôt et à la diffusion de documents scientifiques de niveau recherche, publiés ou non, émanant des établissements d’enseignement et de recherche français ou étrangers, des laboratoires publics ou privés.
Methoni Mw 6.8 rupture and aftershocks distribution
from a dense array of OBS and land seismometers,
offshore SW Hellenic subduction
Maria Sachpazi, Vasilis Kapetanidis, Marinos Charalampakis, Mireille Laigle,
Edi Kissling, Anna Fokaefs, Elena Daskalaki, Ernst Flueh, Alfred Hirn
To cite this version:
Maria Sachpazi, Vasilis Kapetanidis, Marinos Charalampakis, Mireille Laigle, Edi Kissling, et al.. Methoni Mw 6.8 rupture and aftershocks distribution from a dense array of OBS and land seismometers, offshore SW Hellenic subduction. Tectonophysics, Elsevier, 2020, 796, pp.228643. �10.1016/j.tecto.2020.228643�. �hal-03083046�
1
Methoni Mw 6.8 rupture and aftershocks distribution from a dense array of OBS
1
and land seismometers, offshore SW Hellenic subduction
2
3
Maria Sachpazia*, Vasilis Kapetanidisb, Marinos Charalampakisa, Mireille Laiglec, Edi Kisslingd,
4
Anna Fokaefsa, Elena Daskalakia, Ernst Fluehf, Alfred Hirng
5
a
Institute of Geodynamics, National Observatory of Athens, Athens, Greece,
6
b
Department of Geophysics-Geothermics, Faculty of Geology and Geoenvironment, National and
7
Kapodistrian University of Athens, Athens, Greece
8
c
Université Nice Sophia Antipolis, CNRS, IRD, Observatoire de la Côte d’Azur, Géoazur, Valbonne,
9
France,
10
d
Institute of Geophysics, ETH Zurich, Zürich, Switzerland,
11
f
GEOMAR Helmholtz Centre for Ocean Research, Kiel, Germany
12
g
Institut de Physique du Globe de Paris, Sorbonne Paris Cité, Paris VII – Denis Diderot University,
13
Paris, France
14
* Corresponding author: m.sachp@noa.gr
15
16
Abstract
17
Along the south-western offshore Hellenic subduction zone, the overriding Aegean upper plate above
18
the Mediterranean oceanic lithosphere generates uncommon large earthquakes on the offshore
19
megathrust fault. The largest subduction thrust event, for half a century, has been the 14 February
20
2008 Methoni earthquake (Mw=6.8) that occurred offshore of the southwest coast of Peloponnesus.
21
We conducted micro-seismicity experiments around the rupture area and forearc domain -between
22
Peloponnesus and Crete- using ocean bottom seismometers (OBS) jointly with land-based
23
seismological stations. Our first experiment in 2006, had revealed an association of the Matapan
24
Trough, a 400-km-long forearc basin, with local seismicity clustering and a possible gap in activity
25
over the later Methoni rupture area. Here we present new data of post-Methoni seismic activity,
26
recorded during a time-span of 11 months, beginning in October 2008 within the period of proposed
2
afterslip on the megathrust, by an extended and dense seismic array consisting of up to 33 OBS. A
28
minimum 1D velocity model was constructed for the region to provide better constraints on absolute
29
locations and double-difference relocation was applied to produce an enhanced image of the spatial
30
distribution of hypocenters. The high resolution earthquake locations confirm correlation of the
31
Matapan Trough with local seismicity as a regional feature, also filling up the previously observed
32
gap. Over the Methoni rupture area, we constrain seismicity to be located mainly within the upper
33
plate. Hypocenters are also resolved above the updip and downdip edges of the rupture area,
34
respectively. Seismic activity provides hints of upper plate structures which were activated in response
35
to post-seismic deformation spreading within the forearc crust. Our findings highlight the
36
characteristics of a megathrust domain which is related with a highly deformable overriding plate and
37
controlled by a segmented lower plate topography.
38
Keywords: Methoni earthquake, SW Hellenic subduction, Aftershocks, Afterslip, Upper plate
39
deformation.40
41
1. Introduction42
The southwestern offshore megathrust domain of the Hellenic subduction has hosted the largest
43
earthquake of the Mediterranean area, a magnitude 8-8.5 tsunamigenic event in 365 AD (Papazachos
44
and Papazachou, 2003; Stiros and Papageorgiou, 2001). Yet, only five interplate events with moderate
45
magnitudes (~6.5-7.0) occurred during the instrumental period (1965-present) (Fig.1a), and only three
46
such events occurred during the earlier period in the 19th to early 20th century (Papazachos and
47
Papazachou, 2003).
48
On 14 February 2008, a Mw = 6.8 subduction thrust event occurred, 50 km offshore of the
49
southwest coast of Peloponnesus, known as the Methoni earthquake (Fig.1a). Despite its moderate
50
magnitude, it is the largest event, for half a century, in the 400 km long part of the Hellenic
51
subduction, from the Cephalonia Transform Fault CTF) to Crete. The Methoni event ruptured a ~ 30
52
km x 30 km thrust area along the plate interface between the southwestward overriding Aegean plate
53
and the Ionian oceanic crust (Roumelioti et al., 2009). Geodetic measurements (continuous GPS time
54
series) have shown that post-seismic slip continued for ~3 years and the total displacement is of
3
comparable magnitude as co-seismic slip (Howell et al., 2017a). The post-seismic displacements are
56
attributed to afterslip on the subduction interface, distributed over a 100kmX120 km wide region
57
including the co-seismic rupture with its greatest values observed where elevated levels of seismicity
58
were detected following the earthquake (Howell et al., 2017a) (Fig.1b).
59
Afterslip occurs as a widespread post seismic process in subduction zones, complementary to the
60
large coseismic slip zone (e.g. Cattania et al 2015; Yagi et al., 2003; Ozawa et al., 2012) and it is
61
considered as playing an important role in promoting aftershock earthquakes on the subduction
62
interface (Hsu et al., 2006) and the upper plate as well (Hayes et al., 2014a).
63
In this paper, we present observations collected from 9 to 21 months after the Methoni earthquake
64
by a dense array of Ocean Bottom Seismometers (OBS) and seismic stations in the close onshore. We
65
investigate post-Methoni seismicity with respect to the shape and extension of the rupture area as well
66
as the widely distributed post seismic deformation. We combine seismic activity, focal mechanisms
67
and structural data to characterize the pre-, co- and post-seismic behavior of the megathrust boundary
68
over the Methoni rupture area, as well as the regional seismicity.
69
70
71
72
4
73
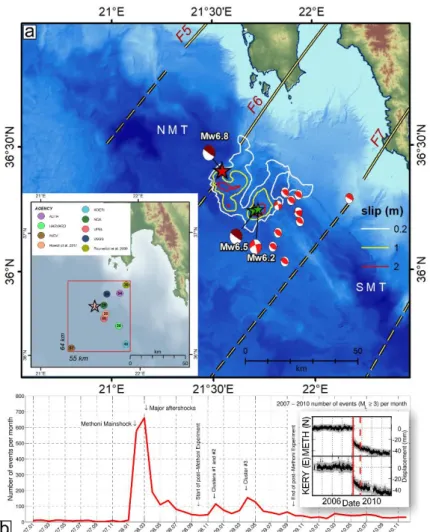
Fig.1. SW Hellenic subduction region. Background bathymetric data, here and in subsequent figures
74
are from Brosolo et al., 2012 and Vitard et al., 2015. (a) Black triangles: the onshore-and offshore
75
seismological stations of the Thales Was Right “TWR” project. The 14 February 2008 Mw 6.8
76
Methoni earthquake location (indicated by its CMT Harvard focal mechanism beachball) is from
77
Sachpazi et al. (2016b). Focal mechanisms for subduction thrust events of Mw 6.0 or greater during
78
the instrumental period are from the CMT Harvard catalogue, except for the Crete 2013 event
79
(Howell et al., 2017a). Earthquake locations of these events are from the National Observatory of
80
Athens (NOA) catalogue. Here and in subsequent figures: Double-lines: Slab along-dip faults from
81
Sachpazi et al. (2016a), labelled F5 to F9. Dashed double lines: offshore extensions of mapped
82
onshore slab faults from Sachpazi et al. (2016b). Colored lines: isobaths of slab Moho with depth
83
denoted in kilometres (Sachpazi et al., 2016a,b). NMT and SMT: the Northern and Southern Matapan
84
Trough. Black barbed line: outer limit of backstop, thrust contact of the accretionary wedge of the
85
Mediterranean Ridge over it. Black dashed NW-SE trending line: Inner limit of the backstop at the
86
transition between the Matapan Trough to the SW and the Hellenic continental margin to the NE from
5
Le Pichon et al. (2019). (b) Distribution of post-seismic slip over the offshore forearc as afterslip
88
according to geodetic data modeling (Howell et al., 2017a) with the higher >0.2 resolution area
89
marked by a green rectangle. (c) Sketch of the Hellenic subduction zone in the wider East
90
Mediterranean context with GPS-derived velocities with respect to Eurasia (Kahle et al., 2000). Black
91
barbed lines with triangles pointing towards opposite directions represent the external limit of the
92
Mediterranean Ridge (MR) over the Ionian oceanic basin and the outer limit of the backstop (BS)
93
from SW to NE respectively.
94
95
2. Geodynamical background and previous studies
96
The Hellenic subduction zone is marked in the southwestern part by subduction of the oldest
97
oceanic lithosphere of the Mediterranean/Ionian Sea, at the edge of the African plate and the
98
southwestwards fast advancing of the Aegean continental domain (~4cm/yr) (Kahle et al., 2000;
99
Nocquet 2012) (Fig.1c). The Africa/Europe convergence vector is highly oblique to the margin and
100
responsible for strain partitioning at the backstop edge (Chamot-Rooke et al., 2005).
101
Seismic coupling in this region has been questioned since the mid-1970s, with numerous studies
102
concluding that the plate interface accommodates up to 80% of the convergence through aseismic slip
103
(North, 1974; Jackson and McKenzie, 1988a,b; Baker et al., 1997; Shaw and Jackson, 2008; Shaw et
104
al., 2010; Reilinger et al., 2010; England et al., 2016), with earthquakes of Mw ~7 rupturing isolated
105
locked patches (Howell et al., 2017a; Vernant et al., 2014). However, in the absence of offshore
106
geodetic observations the size and location of these locked patches are poorly constrained.
107
Furthermore, local offshore seismicity is not sufficiently constrained by land-based permanent
108
stations to provide insight on the seismogenic patterns of the interplate thrust boundary or a robust
109
and well constrained velocity model for the area.
110
Local scale earthquake studies on the island of Crete with onshore seismological stations provided
111
constraints on the distribution of seismic activity associated with the subduction beneath southern
112
Crete (Meier al., 2004). For the region offshore southwest Crete and the southern Peloponnesus
113
however, hypocenters lack offshore constraints. A year and half before the 2008 Methoni earthquake,
114
in May-October 2006, we conducted a pilot study over that offshore domain by deploying 5 OBS
6
jointly with coastal stations in order to better constrain the seismicity location. That study has
116
revealed that the recorded hypocenters along the 250-km- long segment of the southwest Hellenic
117
subduction zone occur mostly at 10–15 km depth, in the upper plate’s crust (Sachpazi et al., 2016b).
118
This first well-constrained local seismic activity was shown to correlate with an Aegean fore-arc
119
specific feature, the Matapan Trough (MT) which has not previously been considered as a seismically
120
active region.
121
This major -400 km long- linear depression, reaching the greatest water depth (5km) for the
122
Mediterranean Sea, has long been considered as the Hellenic plate boundary trench (e.g., Jongsma,
123
1977) and is still called the Hellenic Trench. It is a 4-5 km deep forearc basin which marks the
124
transition between the inner forearc to the NE and the backstop to the SW (Le Pichon et al., 2019, Part
125
2) (Fig.1a). Despite marine seismic studies, the tectonic origin of this bathymetric feature of the
126
Aegean plate remains controversial. Once the Mediterranean Ridge was recognized as an accretionary
127
prism (Le Pichon et al., 1982), Huchon et al. (1982) and Le Pichon et al. (1982) interpreted the
128
Matapan Trough as a narrow deep forearc basin. Based on Sea-Beam data and early seismic profiles,
129
Lallemant et al. (1994) proposed that the MT is dominated by the along-arc extension. Based on
130
seismic velocities and structure, and estimated time evolution of the Hellenic subduction zone, Le
131
Pichon and Lallemant (2002) proposed that the backstop consists of a pile of Hellenic nappes. Shaw et
132
al., 2010 considered instead the scarp of the Matapan Trough as the trenchward edge of the backstop
133
to the deformed accretionary prism. This scarp would be the surface expression of a reverse fault,
134
splaying off the deeper underlying thrust interface of the subduction zone. The authors propose that
135
this fault, rather than the seismically low coupled plate interface, would be the causative fault that
136
hosted the 365 AD Mw=8-8.5 tsunamigenic mega-event.
137
The few low-angle thrust events of the instrumental period highlighting the seismogenic portion of
138
the mega-thrust subduction fault occurred mainly arcward of the Matapan Trough (Laigle et al., 2004;
139
Shaw et al., 2010). Even though the seismogenic interplate boundary lies offshore and is accessible by
140
seismic reflection profiling, its imaging was hindered by its significant depth (over 15 km), the
141
presence of the sub-surface evaporites(Chaumillon et al., 1996 ; Reston et al., 2002b) plus the stacked
142
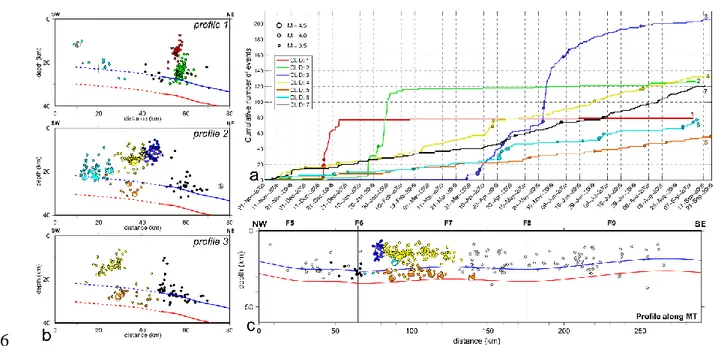
alpine nappes of the upper plate’s crust (Le Pichon and Lallemant, 2002).
7
Teleseismic receiver function (RF) imaging on a dense 2D seismic array has revealed the Moho of
144
the subducting plate, below the onshore forearc, to exhibit along-strike steps (Sachpazi et al., 2016a).
145
The authors showed that the slab is segmented into subducting panels by a series of nine along-dip
146
faults. Extending the imaging further offshore by 5 OBS, Sachpazi et al. (2016b) proposed that
147
segmentation continues below the 8-10 km thick backstop to its outer limit (Fig.1a). They further
148
suggested that these faults control the size and location of earthquakes in the megathrust boundary,
149
such as the Methoni earthquake. This event was recorded by a nearby dense land network (Thales Was
150
Right “TWR” Experiment) and hence could be located with the highest resolution ever obtained in
151
that area for an event of this order of magnitude (Sachpazi et al., 2016b). The Methoni earthquake was
152
initiated along the offshore prolongation of the intra-slab fault F6 (Fig.1a). Its focal mechanism shows
153
a typical subduction thrust event on a N35°E dipping plane.
154
The source process, studied by teleseismic and regional broad band waveform modeling
155
(Roumelioti et al., 2009), showed that the rupture extended unilaterally towards the SE along the ~2/3
156
of the F6F7 panel, in two areas of high coseismic slip (Fig.2a). Two hours after the mainshock, a large
157
interplate event (Mw=6.5) occurred at the southeastern border of the main rupture’s slip extent. One
158
week later, another strong event (Mw=6.2) occurred in the overriding plate directly above the Mw 6.5
159
hypocenter with a strike slip mechanism. Significant aftershock activity continued within the
160
overriding plate over the next four months, but was manifested as a series of reverse faulting
161
earthquakes (Mw between 4.6 and 5.4) (Fig.2a). Their hypocenters were located across the remaining
162
eastern part of the F6F7 panel which has not slipped co-seismically. On the other hand, no such
163
significant aftershock activity occurred at the western part of the panel. The pronounced effect of this
164
strong activity on seismicity rate is visible as the large first peak in Fig.2b. After a relatively quiet
3-165
months period, two bursts of activity mark the 2nd phase of earthquake clustering and seismicity rate
166
increase which corresponds to the observations discussed in this paper.
167
168
8
169
Fig. 2. Overview of the 14 February 2008 Methoni earthquake sequence and slip history. (a)
170
Coseismic slip distribution area after Roumelioti et al. (2009) with the epicenters of the mainshock
171
and stronger aftershocks 4.5≤Mw≤6.5 (February to June 2008) from Sachpazi et al. (2016b). The
172
mainshock, the Mw=6.5 interplate aftershock and the Mw=6.2 shallow aftershock locations are
173
represented by stars. CMT (Harvard) focal solutions of the mainshock and the Mw=6.5 aftershock are
174
drawn with dark red beachballs placed in the position of the epicenters while other significant
175
aftershocks are colored in light red. Inset map: Comparative map of the Methoni hypocenter locations
176
by various agencies (circles) and by Sachpazi et al. (2016b), (star) with focal depths (in km) denoted
177
by numbers inside the respective symbols. (b) Monthly seismicity rate of the area of Fig.2a, from
178
NOA earthquake catalogue during 1 year before and 3 years after the Methoni earthquake occurrence
179
(3.0≤M≤6.8). Panel to the right side of b) shows GPS time series of stations METH and KERY (north
180
-N- and east-E- component, respectively) from Howell et al. (2017a). The date of the start of our
post-181
Methoni experiment is marked by dashed red line.
9
183
3. Data and Method
184
We deployed a total of 33 three-component ocean bottom seismometers (OBS) in the
185
southwestern part of the Hellenic subduction zone, during a period of over 11 months, (October
186
2008-September 2009) (Fig.1a). The OBS array was complemented by 15 onshore instruments. We
187
refer to this campaign as the “post-Methoni experiment”, and to previous experiment (May
2006-188
October 2006) as the “pre-Methoni experiment”. Both campaigns were part of a major
189
onshore/offshore experiment (“TWR” EU project 2006-2011), which also involved the collection of
190
teleseismic data used for receiver function studies across the Peloponnesus (Sachpazi et al., 2016a)
191
and its adjacent offshore domain (Sachpazi et al., 2016b). Observations from more than 2000 events
192
were manually picked and the hypocenters were initially located using a simple 3-layer velocity
193
model (Sachpazi et al., 2016b) and the Hypo71 code (Lee & Valdes, 1989). To improve locations,
194
we constructed a minimum 1D P-wave velocity model using the VELEST code (Kissling, 1995;
195
Kissling et al., 1994), which jointly inverts for the velocity model along with the respective station
196
delays and hypocenter coordinates using a damped least squares iterative inversion scheme. The
197
procedure was performed on a selected dataset of 1104 well-locatable events with at least 7
P-198
observations and azimuthal gap <180. There are many fewer events with enough S-wave picks and
199
small gap (146 events with at least 5 P- and 5 S-wave picks on common stations, with gap < 180)
200
and their seismic ray coverage is very sparse over most of the study area. We regarded this S data set
201
as too small and not adequate to allow the independent construction of an 1D velocity model for
S-202
waves. The procedure of converging towards the final 1D P-velocity model with minimum RMS
203
error, including a series of tests to assess the stability of the produced hypocentral solutions are
204
analytically described in Section 1 of the supplementary material.
205
Our final 1D P-wave velocity model (Table 1) has a fairly constant velocity in the uppermost
206
28km of the overriding crust (probably mixture of mostly upper continental crustal material with
207
some underplated material). Below that depth, the effect of the 2D dipping plate interface and the
208
oceanic Moho becomes apparent. A more pronounced step in the velocity depth function would be
10
expected if, across the study region, there was a Moho with some limited topography, appearing
210
roughly sub-horizontal on a regional scale, and well sampled by the available data. On the other
211
hand, if there is a consistently dipping Moho interface with limited 3D topography, the velocity
212
variation from normal crustal velocities to typical mantle velocities is expected to be spread across a
213
depth range more widely than typical for a Moho. Our final model supports the latter case for the
214
geometries in the study region.
215
We further reduce the relative location uncertainties in the post-Methoni 2008-2009 seismicity by
216
applying a double-difference relocation procedure. We incorporate the hypocenters and corrected
217
travel-times from the results of the minimum 1D model along with differential travel-times from
218
waveform cross-correlations (see supplementary material for a detailed description of the procedure).
219
Finally, we have taken advantage of the newly constructed 1D velocity model, including
station-220
corrections, where available, to relocate the pre-Methoni 2006 sequence as well, in order to discuss
221
the results in conjunction with the relocated catalogue of the 2008-2009 experiment. The hypocentral
222
location of the 2008 Methoni mainshock and major aftershocks are also revisited, in light of the new
223
velocity model.
224
225
Table 1: Final 1D P-wave velocity model for the study region. Note the typical continental crustal
226
velocities down to 28 km. Between that depth value and 43 km depth we obtain a velocity gradient
227
reflecting the spatial variation of the depth of the Moho, which is dipping under the area (see text).
228
Depth (km) Vp (km/s) -3.0 5.80 5.0 5.90 10.0 5.92 15.0 6.26 21.0 6.29 28.0 6.93 35.0 7.2711
43.0 7.95 51.0 8.00 75.0 8.10 105.0 8.20229
4. Results230
Hypocenter Locations of the pre-Methoni and post-Methoni seismicity
231
Post-Methoni seismic activity is observed along the strike of the subduction zone (WNW-ESE) for
232
over 300 km, from west of the Peloponnesus up to the south-western coast of Crete (Fig.3a). Most of
233
the seismicity is localized within a 10-30 km wide band beneath the Matapan Trough (MT) region. A
234
similar pattern was observed for the pre-Methoni period (Fig.3b). To the SE, along the deepest part of
235
the MT, earthquakes are distributed along both sides of the depression, with most events remaining
236
along its southern border. Towards Crete, seismicity is more scattered and the seismic rate is
237
comparable during the time of the two experiments.
238
239
Fig. 3. Map view of seismic activity beneath the offshore forearc domain of the (a) post and (b) pre-
240
Methoni experiments. Earthquakes of both periods are located using the plotted (c) minimum 1D
12
wave velocity model determined by the present study. The epicenters are marked by circles, scaled
242
by their magnitude with events of azimuthal gap <180 colour-coded according to their focal depth
243
(gray ones have gap>180). The black dashed line drawn in the along-Matapan NW-SE direction in
244
panel (a) is used for the cross-section of Fig.A.1c. Inset maps: a zoomed view of panel F6F7, marked
245
by a white dashed rectangle in the main figures. Methoni coseismic slip is superposed while the star
246
denotes the epicenter of Methoni earthquake.
247
248
Post-Methoni seismic activity is more sustained along the panel F6F7, especially in its
249
northwestern part (Fig.3a Inset). This contrasts with the pre-Methoni period when the Methoni
250
coseismic slip area is nearly devoid of seismic activity (Fig.3b). The quiescent area includes the part of
251
fault F6 where the mainshock initiated. Instead, the fault is very active downdip of the rupture extent,
252
with a large number of earthquakes located along this structure. To the SW, a stripe of earthquakes
253
striking WNW is located along the updip border of the rupture (Fig.3a).
254
Integration of the existing information on the plate interface depth and geometry enables the
255
characterization of the hypocenters with respect to the two plates. We hereafter focus on panel F6F7
256
which hosted the Methoni earthquake. RF imaging provides constraints on the depth of the slab Moho
257
downdip the rupture (Sachpazi et al., 2016 a,b). However, the depth of the plate interface further
258
updip, hence along the coseismic domain is unknown. Hypocentral locations of subduction thrust
259
earthquakes such as the Methoni event may potentially provide a first order estimate of the depth of
260
the interplate boundary. However in the present case reported hypocenters, are based mainly on distant
261
observations, and spread over more than 40 km both horizontally and in depth (Fig.2a Inset map).
262
Sachpazi et al. (2016b), used phase-arrival data from the TWR land array, in addition to permanent
263
stations, to determine hypocentral locations for the Methoni mainshock and its largest aftershocks by
264
a simple 3-layer model with Vp/Vs=1.75. This resulted in a focal depth of 15km for the mainshock,
265
which the authors proposed as the plate interface depth. We re-examine the mainshock’s hypocentral
266
location, using the 1D P-wave velocity model obtained from this study. For the construction of the
267
minimum 1D Vp model, besides OBS, we have also employed data from land-based stations (see Fig.
13
B.1 in the supplementary material). Many of these have available data for the 2008 mainshock. The
269
main reason the focal depth for this earthquake is so unstable is due to the fact that there were no local
270
stations (OBS) at that time and there are significant azimuthal gaps. Thus, the trade-off between the
271
hypocentral and velocity model parameters results in unrealistically small RMS and uncertainty
272
estimates. In this study, we investigate the resulting range of focal depths for the mainshock by
273
changing the only parameters for which we have control, i.e. the velocity model and distance
274
weighting. In contrast to the seismicity of the post-Methoni experiment which was located using only
275
P-wave data and the minimum 1-D Vp model, in the case of the mainshock we also employ a constant
276
Vp/Vs ratio, in order to take advantage of the available S-wave arrivals, and examine how different
277
Vp/Vs values affect the RMS error and the resulting depth. We take all these parameters into account
278
to estimate a possible range for the focal depth of the mainshock. The resulting focal depth for the
279
mainshock ranges from 26.5 km to31.0 km, depending mainly on the selection of Vp/Vs and the
280
incorporation of distant stations. We obtained lower RMS values (0.27-0.28s) when limiting the
281
distance weighting to 50-200km. Vp/Vs=1.83 yields the smallest RMS=0.27s which is also the value
282
supported by the Chatelain (1978) diagram for the available 2008-2009 OBS data, resulting in a focal
283
depth of 27 km for the mainshock. Additional tests of single-event location of the 2008 mainshock
284
with VELEST, with or without taking into account S-wave arrivals, resulted in greater focal depths
285
(30.5-32.0km), but the RMS was also higher (0.42-0.45s). The epicentral location of the mainshock
286
does not vary significantly in the various tests. It is clear that these various tests do not provide a way
287
to control quantitatively the hypocenter, however, the 1D P-wave velocity model of this study is an
288
improvement over the crude 3-layer model that was used before (model Y in Fig. B.3a in the
289
supplementary material). Note that all the starting models (including Model Y) follow a roughly
290
similar profile with depth (Fig. B.3a). However, starting model Y yielded the worst results (Fig. B.2,
291
test Y2DS3). Following the above mentioned estimates we adopt a mean focal depth of 23km for the
292
2008 mainshock with an uncertainty of ±5km.
293
Spatiotemporal analysis of post-Methoni seismic activity outlines 7 groups within panel F6F7 that
294
characterize different parts of the activated region (Fig.4a, b). The distribution of the hypocenters
295
jointly with their evolution in time and the part of the subduction system where these occur are
14
analytically discussed in the Appendix A. The constrained focal mechanisms (Fig.4c) and their P, T
297
principal axes (Figure S1) also allow for several interesting observations and are hereafter jointly
298
discussed.299
300
5. Discussion301
In this work, offshore seismicity has been constrained both horizontally and in depth by our dense
302
local array of OBS stations, during a period between 9 and 21 months after the Methoni mainshock.
303
Despite its moderate magnitude in comparison to megathrust earthquakes in other subduction
304
zones, the Methoni earthquake, is the largest interplate earthquake within the 400 km long western
305
Hellenic subduction zone for over a half-century and was followed by post-seismic slip, as large as the
306
coseismic slip, during the 3 year period after the mainshock. According to geodetic data modeling by
307
Howell et al. (2017a), the afterslip area was twelve times larger than the coseismic patch, over a
100-308
km-wide segment spanning through the two panels F5-F6 and F6-F7, centered on the Methoni rupture
309
(Fig.1b). The poorly constrained geodetic updip and downdip limits have been chosen to correspond to
310
the forearc backstop trenchward edge and the 35 km depth respectively. The latter is roughly located
311
below the Messenia and Mani capes.
312
Here we investigate the geometry and character of the post-Methoni seismicity within panel F6F7
313
(Fig.4a, b). We discuss it with respect to the shape and extension of the rupture area as well as the
314
widely distributed post seismic deformation.
315
Two clusters (#6 in cyan and #7 in black) are located at depths above the updip and downdip edges
316
of the rupture area, respectively (Fig.4b). Hypocenters extend through a 10 km thick layer above the
317
interplate fault with only few events reaching shallower depths. These events have not been observed
318
by our pre-Methoni offshore-onshore deployment, which is also the case for the other clusters
319
discussed hereafter.
320
There is a complete lack of interplate activity between cluster #6 and #7 over a downdip width of
321
about 30 km corresponding to the Methoni rupture area (Fig.4b and Fig.A.1b Profiles 1,2). It has been
322
observed for many of the M>8 earthquakes such as Sumatra (Hsu et al., 2006), Chile (Hayes et al.,
323
2014b; Li et al., 2016), and Tohoku (e.g Asano et al., 2011) that large co-seismic slip areas tend to
15
have little interplate seismicity after the mainshock rupture. The distribution of hypocenters, 9-21
325
months after the moderate Mw=6.8 Methoni earthquake shows a similar feature. In addition, we
326
observe that the surrounding deep upper plate volume, right above the plate interface is similarly quiet
327
(Fig.4b).
328
There is a strong concentration of hypocenters along the slab fault F6 (Fig.4a, clusters #1 (red) and
329
#2 (green). Coseismic slip occurring on the megathrust fault plane which is here laterally bordered by
330
a vertical fault zone located in the upward extent of the intraslab F6 fault, may induce earthquake
331
swarms by micro-faulting. The present study area is located at shallower depths than the Moho of the
332
overriding plate which is identified at ~30 km depth beneath Messiniakos gulf (Sachpazi et al., 2016a).
333
The overlying portion of the Aegean plate is thus largely crustal. The fact that the clusters #1 (red) and
334
#2 (green) occur in the upper-plate crust (Fig.4b) within a vertical plane above the intra-slab fault F6,
335
may highlight a process that triggers activity through fluid migration in a pre-stressed region above.
336
Though, this activity is located downdip and not over the co-seismic area along the fault F6 due to
337
post-seismic stress relaxation (see Fig. 5b Lin and Stein, 2004) and/or due to lateral variation of fluids
338
in the crustal material above the fault region. In fact, many causes might contribute to the observed
339
spatio-temporal evolution.
340
The slab faults have already been shown to correlate with clustered seismicity, but this occurred at
341
the 60-80 km slab depth within the subducting crust further downdip, beneath NE Peloponnesus and
342
have been proposed to channel slab dehydrating fluids (Sachpazi et al., 2016a). Recent results,
343
focusing on Greece but extended also to other subduction zones, proposed that fluids may migrate
344
along the slab further updip and upwards, towards the overriding crust to trigger upper plate
345
seismicity (<40km depth) (Halpaap et al., 2019). Our spatio-temporal analysis has shown that the
346
shallower cluster along the fault F6 (cluster #1, red) precedes the deeper one (cluster #2, green)
347
(Fig.A.1a), thus the fore-mentioned mechanism looks unlikely for our observations. Yet, it is possible
348
that dehydration occurs locally at depth and that the deeper cluster is diagnostic of the upwards
349
channelling of fluids.
350
Landwards, geodetic modelling is better constrained by the GPS stations and shows significant
351
afterslip (Howell et al., 2017a) (Fig.1b). This is where seismicity downdip of the coseismic rupture
16
(group #7, cluster in black) is located right above and on top of the plate interface (Fig.4b). This is
353
still located in the crust-to crust contact and the interplate is not yet under the mantle of the upper
354
plate. So we can think of these aftershocks as essentially being driven by brittle creep as proposed by
355
Perfettini & Avouac (2004) for deep afterslip. Slow slip in the downdip part of the slab fault F6 may
356
be an alternative mechanism to explain the earthquake clustering and induced deformation within the
357
upper plate (clusters #1, #2). This would be due to the differential motion between the slab panels
358
along this fault.
359
5.1 Focal mechanisms and the nature of seismic deformation with respect to the plate interface
360
Cluster #6 (cyan), located updip of the rupture area and just above the interplate boundary, is
361
related with reverse and strike slip events (20-23km depth) with a P axis striking NE-SW (Fig. 4c and
362
Fig. S1), consistent with the mainshock and major aftershocks (Fig.2a). Cluster #5 orange, located
363
instead beneath the rupture area and within the subducting crust (Fig.4b) contains normal-faulting
364
events with a T-axis trending between N-S and NE-SW (26-30km depth) (Fig. 4c and Figure S1). This
365
type of faulting is also observed in events located at the same depths in the nearby region of panel
366
F7F8 with a T-axis trending roughly WE (Fig.4c).
17
368
Fig. 4. (a) Seismicity of panel F6F7 with relocated epicenters using the double-difference method.
369
Colors and numerical labels correspond to the 7 spatial groups discussed in the main text and
370
Appendix A. Methoni coseismic slip is superposed. Profiles 1-3 (black dotted lines), drawn in a
371
N35E direction are used for the cross-sections of figure A.1.b. (b) Cross-section of the relocated
372
seismicity in a N35E direction covering the whole width of panel F6F7. Beachballs present the
far-373
hemisphere projections of selected focal mechanisms, with their compressive quadrants following the
374
same colour-coding as the hypocenters of the respective 7 spatial groups except for those with gray
375
colour which do not belong to them. Hypocenters locations of the Methoni mainshock (red star) and
18
stronger aftershocks (green stars) of the first period (Fig.2b) are from the present study. Areas with
377
light and dark gray shading represent the upper and lower plate, respectively. The bold black line
378
shows the plate interface with the two white vertical ticks denoting the 30-km-long downdip
379
mainshock rupture width along the western part of the panel. The bold orange line is the slab Moho
380
assuming an 8km thick oceanic crust (Gesret et al., 2010) (c) Focal mechanisms for events within
381
panel F6F7 and its vicinity. Beachballs with black and gray compressive quadrants correspond to
382
events at depths related to the upper and lower plate, respectively.
383
384
In the offshore domain between the southwest Peloponnesus and Crete, focal mechanisms of the
385
most significant earthquakes in the last 40 years show that the regional stress field corresponds to two
386
types of faulting. The first, reverse and low-angle thrust faulting with a NE horizontal compressive
387
axis, has been considered to reflect the SW overriding of the Aegean domain over the Ionian oceanic
388
crust causing also the large inter-plate subduction earthquakes (Shaw and Jackson, 2010; Benetatos et
389
al., 2004; Kapetanidis and Kassaras, 2019). The second, reverse faulting within the lower plate with a
390
trench parallel compressive axis is proposed to correspond to along-arc shortening of the subducted
391
slab (Shaw and Jackson, 2010).
392
However, at the NW part of the subduction, in the Ionian Islands, small normal-fault earthquakes
393
with a W-E trending T-axis have been resolved at shallow depths within the slab crust, by an early
394
OBS and land-based network (Sachpazi et al., 2000). These events found trenchward of a change in
395
the dip of the interplate boundary (Hirn et al., 1996), were interpreted as reflecting the bending of the
396
lower plate. These types of events have also been found along the Japan trench and similarly attributed
397
to bending-related faulting of the subducting crust (Gamage et al., 2009). In the Ionian islands, in
398
addition to the lower plate extensional earthquakes, reverse-faulting events have been located in the
399
upper plate above the interplate boundary, exhibiting a NE striking P-axis. The contrasting focal
400
mechanisms on either side of the seismically imaged refelctor -at 15km depth- were evidence it was
401
the plate interface. We suggested that lower plate bending was due to the load of the southwestwards
402
overriding upper plate which thickens landwards.
19
Our findings in the present study of the southwestern part of the subduction zone are consistent
404
with these characteristics of background seismicity of the Ionian Islands. The normal fault earthquakes
405
are in the lower plate crust and trenchwards of the thickened Hellenic continental margin and may
406
mark the lower plate bending to underthrust the southwestwards advancing upper plate (Le Pichon et
407
al., 2019). The plate interface may be thus defined as the boundary (at the 24-25km depth range)
408
between the two groups of different focal mechanisms, with those around 20-23 km depth being at the
409
base of the overriding upper plate, consistently with the proposed Methoni mainshock’s hypocenter at
410
23km depth.
411
5.2 Seismic activity within the shallow upper plate
412
The third group (cluster #3, blue) in the shallower part of the upper plate is located 10 km above
413
the plate interface and above the downdip coseismic border region (Fig.4b). It displays reverse
414
faulting events with an along-arc P-axis (Fig.4c and Figure S1) that differs significantly from the
415
regional NE striking horizontal compressive axis. It is possible that this seismic swarm in the hanging
416
wall, which occurred 13 months after the mainshock, is associated with Coulomb stress transfer above
417
the lateral variation of rupture imposed on an obliquely orientated structure (Vallage et al., 2014).
418
Cluster #4 (yellow) exhibits a tight geographical association with the Matapan Trough. Such
419
relation has already been noted during the pre-Methoni period, in the wider offshore forearc, though
420
MT associated activity was not continuing into panel F6F7 (Fig.3b). During the post-Methoni period,
421
MT is seismically active at the 10-15 km depths range into panel F6F7. This suggests the presence of
422
deep active faults controlling its morphological expression at the sea bottom within the outer forearc
423
crust, which have been seismically activated in the post-Methoni period (Fig.3a). The focal
424
mechanisms we could constrain for two events at 15 km depth beneath MT (panel F7F8) display
425
reverse and strike slip faulting respectively with a NE trending P-axis (Fig.4c and Figure S1). The
426
extensional process that was suggested for the formation of this deep outer forearc domain (Lallemant
427
et al., 1994) is possibly currently replaced by oblique compression. This might result from the
428
combined effect of the ongoing collision between the backstop and the Lybian margin south of Crete,
429
as suggested by Mascle and Chaumillon (1998), and from the predicted ~2cm/yr of dextral motion at
430
the trenchward backstop’s edge as suggested by Chamot-Rooke et al. (2005).
20
5.3 What drives post-Methoni seismicity
432
We document a seismic activation of the upper plate which appears to accommodate deformation
433
on small faults with different orientations around and above the area of mainshock slip. We attribute
434
this activation to a part of the post-seismic deformation which spreads induced elastic deformation into
435
the forearc hanging wall of the interplate fault. Howell et al., 2017a model the 20mm post seismic
436
displacement as mainly related to widespread aseismic slip of the plate interface. It is beyond the
437
scope of this paper to interpret GPS data but we note a change in the slope of geodetic offset (see time
438
series of stations METH and KERY at Fig.4b of Howell et al., 2017a and inset panel in Fig.2b) at the
439
end of 2008. Most of the ~15mm post seismic displacement occurs before the end of 2008 and the
440
remaining ~5mm continue up to the end of 2010. The onset of slow deformation coincides in time
441
with the initiation of the smaller clustered activity during our post-Methoni experiment (Fig.2b). The
442
earlier large aftershocks which also occurred in the shallow upper plate took place during the first
443
period of faster rate deformation (Fig.2b). Their focal mechanisms, strike slip as well as reverse
444
faulting, are compatible with upper plate deformation, also shown in the kinematics of the co-seismic
445
slip, which is driven by the SW movement of the overriding plate.
446
We also resolve the eastern part of panel F6F7 which did not slip coseismically, to be devoid of
447
interplate activity in the 30km downdip range (Fig.A.1b Profile 3). The Mw=6.8 main shock was
448
followed 2 hours later by the Mw=6.5 interplate aftershock at the southeastern border of the Methoni
449
asperity which may have continued the rupture in some extent to the SE, towards slab fault F7
450
(Sachpazi et al., 2016b). Unfortunately available data are insufficient to model its co-seismic slip;
451
hence its along-dip extent is unknown. Thus, we cannot exclude the possibility that a part of the silent
452
plate interface of the eastern panel has experienced aseismic slip as proposed by Howell et al., 2017a.
453
During our pre-Methoni experiment period the whole western part of the panel was shown to be
454
seismically quiet in comparison to the eastern one (Fig.3b), which may also be observed in the several
455
years back, -though less well resolved- NOA seismicity (Fig.ureS2). NOA epicentral locations
456
following our post-Methoni experiment (2010-2019) show a progressive decrease in seismic activity-
457
also along the wider forearc- and approach to the pre-Methoni state (Fig.S3 panel F6F7). Over the
458
Methoni coseismic domain, this may suggest progressive relocking of the asperity and strong coupling
21
between the plates (Sachpazi et al., 2016b). The persistence of MT related seismic activity, -outside
460
panel F6F7- during our short-term pre- and post-Methoni experiments suggests a difference in the
461
seismic behavior along the forearc. It is possible that the same processes we proposed to drive
post-462
seismic deformation of panel F6F7, such as dehydration-embrittlement and/or aseismic slip, are
463
behind the continuous MT related seismic activity. Clarifying the processes at work will require
sea-464
bottom geodetic and seismic monitoring.
465
We have shown that the clustered post-Methoni seismic activity within the outer forearc crust on
466
the one hand and the localized slip during the Methoni earthquake along the plate interface on the
467
other hand, accommodate complementary patterns of the seismic deformation, over the megathrust
468
boundary. Oblique convergence structures were up to now considered to be restrained at the
469
trenchward backstop’s edge (Chamot Rooke et al., 2005), and the Methoni sequence documents a
470
potentially active oblique deformation up to the Matapan Trough. Our findings, on the Methoni
471
sequence document in detail the characteristics of this part of the SW Hellenic subduction zone with a
472
highly deformable Aegean plate overriding a segmented lower plate.
473
474
6. Conclusions
475
The results of our long-term aftershocks study of the Methoni Mw 6.8 interplate event,
476
acquired from recordings of both OBS and land stations, provide insights into the SW Hellenic
477
megathrust domain where large events are uncommon, though a large historical tsunamogenic event
478
has occurred in the past (Papazachos and Papazachou, 2003; Stiros and Papageorgiou, 2001). We
479
establish spatial correlation between the regional seismicity pattern and the Matapan Trough, a major
480
-250-km-long forearc basin within our study area, already identified by our previous studies with less
481
dense datasets (Sachpazi et al., 2016b). We discuss spatio-temporal variations of the long-term
482
aftershocks activity, which clustered over the Methoni co-seismic and post-seismic slip area thanks to
483
depth constraints and focal mechanisms.
484
We showcase clear evidences of post-Methoni crustal seismicity occurring on mega-thrust
485
asperities and forearc crust’s faults, as well as the impact of the slab segmentation (slab fault F6) in
486
the spatial distribution. These features did not show up before the 2008 Methoni earthquake as
22
documented by comparison with pre-Methoni seismic studies (Sachpazi et al., 2016b). Though the
488
largest crustal aftershocks account for only a small fraction of the moment release and post-seismic
489
slip documented by GPS data (Howell et al., 2017a), our results indicate that the observed
post-490
Methoni microseismic activity is consistent with complementary post-seismic slow deformation
491
which spreads into the forearc region rather than on the plate interface.
492
493
Acknowledgments
494
This research has been supported by the European Union FP6 NEST_INSIGHT program, under the
495
project THALES WAS RIGHT. The authors thank the captain and the crew of R/V AIGEO of the
496
Hellenic Center for Marine Research as well as the participants of both Géoazur OBS team (Yann
497
Hello, Olivier Desprez, Alain Anglade and Audrey Galve) and the GEOMAR OBS team (Heidrun
498
Kopp, Anke Dannowski and Anne Becel). We thank the National Observatory of Athens, NOA for
499
providing data from permanent seismological stations. The authors thank
the editor and two
500
anonymous reviewers
fortheir
constructive evaluation.501
502
References
503
Asano, Y., Saito, T., Ito, Y., Shiomi, K., Hirose, H., Matsumoto, T., Aoi, S., Hori, S., Sekiguchi, S.,
504
2011. Spatial distribution and focal mechanisms of aftershocks of the 2011 off the Pacific coast of
505
Tohoku earthquake. Earth Planet. and Space 63, 669–673. https://doi .org /10.5047 /eps .2011 .06
506
.016.
507
Baker,
C.,
Hatzfeld,D.,
Lyon-Caen,H.,
Papadimitriou,E.,
Rigo,A., 1997.
Earthquake mechanisms508
of the Adriatic Sea and Western Greece: geodynamic implications for the oceanic
subduction-509
continental collision transition. Geophys.J. Int. 131
,
559-
594.510
Benetatos, C., Kiratzi, A., Papazachos, C., Karakaisis, G., 2004. Focal mechanisms of shallow and
511
intermediate depth earthquakes along the Hellenic Arc. C. Journal of Geodynamics, 37, 253–296.
512
Brosolo, L., Mascle, J., Loubtrieu, B., 2012. Morpho-Bathymetry of the Mediterranean Sea, Map
513
1/4.000.000, 1st ed., Comm. for the Geol. Map of the World (CGMW) and UNESCO, Paris.
23
Cattania, C., Hainzl, S., Wang, L., Enescu, B., Roth, F., 2015. Aftershock triggering by postseismic
515
stresses: A study based on Coulomb rate-and-state models. J. Geophys. Res., Solid Earth, 120, 2388–
516
2407. https://doi:10.1002/2014JB011500.
517
Chamot Rooke, N., Rabaute, A., Kreemer, C., 2005. Western Mediterranean Ridge mud belt
518
correlates with active shear strain at the prism-backstop geological contact. Geology 33(11), 861–864.
519
https://doi: 10.1130/G21469.
520
Chatelain, J.L., 1978. Etude fine de la sismicite en zone de collision continentale au moyen d’un
521
r´eseau de stations portables: la regionHindu-Kush Pamir, These de 3eme cycle, Universite de
522
Grenoble, 219 pp.
523
Chaumillon, E., Mascle, J., Hoffmann, H.J., 1996. Deformation of the western Mediterranean Ridge:
524
Importance of Messinian evaporitic formations. Tectonophysics 263, 163-190.
525
England, P., Houseman, G., Nocquet, J.M. 2016. Constraints from GPS measurements on the
526
dynamics
527
of deformation in Anatolia and the Aegean. J. Geophys. Res.: Solid Earth, 121: 8888–8916,
528
doi:10.1002/2016JB013382.
529
Gamage, S.S.N., Umino, N., Hasegawa, A., Kirby, S.H., 2009. Offshore double-planed shallow
530
seismic zone in the NE Japan forearc region revealed by sP depth phases recorded by regional
531
networks. Geophys. J. Int. 178, 195–214.
532
Gesret, A., Laigle, M., Diaz, J., Sachpazi, M., Hirn, A., 2010. The oceanic nature of the African slab
533
subducted under Peloponnesus: Thin-layer resolution from multiscale analysis of teleseismic P to S
534
converted waves. Geophys. J. Int. 183, 833–849. https://doi:10.1111/j.1365-246X.2010.04738.x.
535
Halpaap, F., Rondenay, S. Perrin, A., Goes, S., Ottemoller, L., Austrheim, H., Shaw, R., Eeken T.,
536
2019. Earthquakes track subduction fluids from slab source to mantle wedge sink. Sci. Adv. 5(4),
537
eaav7369.
538
Hayes, G.P., Furlong, K.P., Benz, H.M., Herman, M.W., 2014a. Triggered aseismic slip adjacent to
539
the 6 February 2013 MW 8.0 Santa Cruz Islands megathrust earthquake. Earth Planet. Sci. Lett. 388,
540
265–272. https://doi .org /10 .1016 /j .epsl .2013 .11 .010 .
24
Hayes, G.P., Herman, M.W., Barnhart, W.D., Furlong, K.P., Riquelme, S., Benz, H.M., Bergman, E.,
542
Barrientos, S., Earle, P.S., Samsonov, S., 2014b. Continuing megathrust earthquake potential in Chile
543
after the 2014 Iquique earthquake. Nature 512, 295–298. https:// doi .org /10 .1038 /nature13677.
544
Hirn, A., Sachpazi, M., Siliqi, R., Mc Bride, S., Marnelis, F. and the STREAMERS/PROFILES
545
group, 1996. A traverse front with coincident normal incidence and wide angle seismic.
546
Tectonophysics 267, 57-71.
547
Howell, A., Palamartchouk, K., Papanikolaou, X., Paradissis, D., Raptakis, C., Copley, A., England,
548
P., Jackson, J., 2017a. The 2008 Methoni earthquake sequence: the relationship between the
549
earthquake cycle on the subduction interface and coastal uplift in SW Greece. Geophys. J. Int. 208,
550
1592–1610.
551
Hsu, Y.J., Simons, M., Avouac, J.P., Galetzka, J., Sieh, K., Chlieh, M., Natawidjaja, D.,
552
Prawirodirdjo,
553
L., Bock, Y., 2006. Frictional afterslip following the 2005 Nias-Simeulue earthquake, Sumatra.
554
Science 312, 1921–1926. https:// doi .org /10 .1126 /science .1126960.
555
Huchon, P., Lyberis, N., Angelier, J., Le Pichon, X., Renard, V., 1982. Tectonics of the Hellenic
556
trench: a synthesis of Seabeam and submersible observations. Tectonophysics 86, 69-112.
557
Hussni, S., Becel, A., Schenini, L., Laigle, M., Dessa, J.X., Galve, A., Vitard, A., SISMED Scientific
558
Team. 2017. Pre-Stack depth Migration imaging of the Hellenic Subduction Zone. POSTER
559
SESSION AGU FALL MEETING.
560
Jongsma, D., 1977. Bathymetry and shallow structure of the Pliny and Strabo Trenches south of the
561
Hellenic Arc. Geol. Soc. Am. Bull. 88, 797–805.
562
Jackson,
J.,
McKenzie,D., 1988.
The relationship between plate motions and seismic moment563
tensors, and the rates of active deformation in the Mediterranean and Middle East
.
Geophys. J. R.564
Astr. Soc. 93
,
45-
73.565
Jackson,
J.,
McKenzie,D., 1988.
Rates of active deformation in the Aegean Sea and surrounding566
regions, Basin Res. 1
,
121-
128.25
Kahle, H. G., Cocard, M., Peter, Y., Geiger, A., Reilinger, R., Barka, A., Veis, G., 2000. GPS-derived
568
strain rate field within the boundary zones of the Eurasian, African, and Arabian plates, J. Geophys.
569
Res. 105, 23,353–23,370. https://doi:10.1029/2000JB900238.
570
Kapetanidis, V., Kassaras, I., 2019. Contemporary crustal stress of the Greek region deduced from
571
earthquake focal mechanisms. J. of Geodynamics 123, 55–82.
572
Kissling, E., 1995. Program VELEST user's guide - short introduction, Institute of Geophysics, ETH
573
Zurich.
574
Kissling, E., Ellsworth, W.L., Eberhart-Phillips, D., Kradolfer, U., 1994. Initial reference models in
575
local earthquake tomography. J. Geophys. Res. 99, 19635–19646. https://doi: 10.1029/93JB03138.
576
Laigle, M., Sachpazi, M. Hirn, A., 2004. Variation of seismic coupling with slab detachment - upper
577
plate structure along western Hellenic subduction. Tectonophysics 391, 85-95.
578
Lallemant, S., Truffert, C., Jolivet, L., Henry, P., Chamot-Rooke, N., de Voogd, B., 1994. Spatial
579
transition from compression to extension in the Western Mediterranean Ridge accretionary complex.
580
Tectonophysics 234, 33–52.
581
Lee, W.H.K.,Valdes, C.M., 1989. User manual for HYPO71PC, in Lee, W.H.K., ed., Toolkit for
582
seismic data acquisition, processing and analysis: El Cerrito, Calif. Seismological Society of America,
583
International Association of Seismology and Physics of the Earth's Interior Software Library, v. 1, p.
584
203-236.
585
Li, L., Lay, T., Cheung, K.F., Ye, L., 2016. Joint modeling of teleseismic and tsunami wave
586
observations to constrain the 16 September 2015 Illapel, Chile, MW 8.3 earthquake rupture process.
587
Geophys. Res. Lett. v. 43, p. 4303–4312. https:// doi .org /10 .1002 /2016GL068674.
588
Lin, J., Stein, R. S., 2004. Stress triggering in thrust and subduction earthquakes and stress interaction
589
between the southern San Andreas and nearby thrust and strike‐ slip faults. J. Geophys. Res. 109,
590
B02303. https://doi:10.1029/2003JB002607.
591
Le Pichon, X., Angelier, J., Sibuet, J.-C., 1982. Plate boundaries and extensional tectonics.
592
Tectonophysics 81, 239-256.
593
Le Pichon, X., Lallemant, S, 2002. The Mediterranean Ridge backstop and the Hellenic nappes.
594
Marine geology 186,111-125.