The MIT Faculty has made this article openly available.
Please share
how this access benefits you. Your story matters.
Citation
Gang, Yunger et al. “81 supra-THz beams generated by a Fourier
grating and a quantum cascade laser.” Optics Express, 27, 23
(November 2019): 374460 © 2019 The Author(s)
As Published
10.1364/OE.27.034192
Publisher
The Optical Society
Version
Final published version
Citable link
https://hdl.handle.net/1721.1/129448
Terms of Use
Article is made available in accordance with the publisher's
policy and may be subject to US copyright law. Please refer to the
publisher's site for terms of use.
81 supra-THz beams generated by a Fourier
grating and a quantum cascade laser
Y
UNERG
AN,
1,2,7B
EHNAMM
IRZAEI,
1,3J
OSER. G. S
ILVA,
1,2A
LIK
HALATPOUR,
4Q
INGH
U,
4C
HRISTOPHERG
ROPPI,
5J
OSEV. S
ILES,
6F
LORISVAN DERT
AK,
1,2ANDJ
IAN-R
ONGG
AO1,3,81SRON Netherlands Institute for Space Research, Groningen/Utrecht, The Netherlands
2Kapteyn Astronomical Institute, University of Groningen, 9747 AD, Groningen, The Netherlands 3Faculty of Applied Science, Delft University of Technology, Delft, The Netherlands
4Department of Electrical Engineering and Computer Science, Massachusetts Institute of Technology, Cambridge, MA 02139, USA
5School of Earth and Space Exploration, Arizona State University, AZ, USA 6NASA Jet Propulsion Laboratory, Pasadena, CA, USA
7[email protected] 8[email protected]
Abstract: Large heterodyne receiver arrays (~100 pixel) allow astronomical instrumentations
to map more area within limited space mission lifetime. One challenge is to generate multiple local oscillator (LO) beams. Here, we succeeded in generating 81 beams at 3.86 THz by combining a reflective, metallic Fourier grating with an unidirectional antenna coupled 3rd-order distributed feedback (DFB) quantum cascade laser (QCL). We have measured the diffracted 81 beams by scanning a single pyroelectric detector at a plane, which is in the far field for the diffraction beams. The measured output beam pattern agrees well with a simulated result from COMSOL Multiphysics, with respect to the angular distribution and power distribution among the 81 beams. We also derived the diffraction efficiency to be 94 ± 3%, which is very close to what was simulated for a manufactured Fourier grating (97%). For an array of equal superconducting hot electron bolometer mixers, 64 out of 81 beams can pump the HEB mixers with similar power, resulting in receiver sensitivities within 10%. Such a combination of a Fourier grating and a QCL can create an LO with 100 beams or more, enabling a new generation of large heterodyne arrays for astronomical instrumentation.
© 2019 Optical Society of America under the terms of the OSA Open Access Publishing Agreement
1. Introduction
Radiation at terahertz (THz) frequencies, broadly defined as the 0.3 THz – 10 THz range, has attracted wide interest for applications in astronomical instrumentation, biomedicine, plasma diagnostics and homeland security [1]. Compared to THz direct detection techniques, heterodyne detection, combining a mixer with a local oscillator (LO) to convert a THz frequency radiation line to a lower frequency ~GHz signal, has the advantages of extremely high spectral resolution together with a quantum noise limited sensitivity. These characteristics make heterodyne detection a powerful technique in astronomical instrumentations to resolve the velocity information from molecular rotational lines and atomic fine structure lines at THz frequencies in the interstellar medium (ISM). For examples, velocity-resolved large-scale images in the fine-structure line of ionized carbon [CII] at 1.9 THz, observed by a 14-pixel heterodyne array receiver on the Stratospheric Observatory For Infrared Astronomy (SOFIA) [2], provide an observational diagnostic for the radiative energy input and the dynamics of the interstellar medium around massive stars [3]. The [CII] spectral line from the Stratospheric THz Observatory 2 (STO2), which is equipped with a 2-pixel heterodyne array, is compared with other fine structure lines to investigate the kinematics of the Trumpler 14 region in the Carina Nebula Complex [4].
#374660 https://doi.org/10.1364/OE.27.034192 Journal © 2019 Received 7 Aug 2019; accepted 25 Aug 2019; published 7 Nov 2019
In the applications for homeland security, heterodyne techniques can be useful for both active imaging and passive imaging system [5]. A heterodyne imaging system is attractive because such a system detects not only the intensity, but also the phase, making the detection more decisive than the direct detection [6]. Both astronomical and homeland security applications will benefit from a heterodyne array to increase the imaging speed or observation efficiency [7]. Currently, due to the high power consumption in the backend of a heterodyne receiver, including low noise amplifiers and spectrometers, and the needs of the local oscillator (LO) array [8], the practical heterodyne receivers operating at supra-THz (> 1 THz) are limited to an order of 10 pixels. With recent advances in backend technology, involving low-noise-amplifiers [9] and CMOS digital spectrometers [10], both of which have demonstrated impressively low power consumptions, one can envision large heterodyne arrays, for example, 100 pixels or more, for future astronomical instrumentations in space. This allows for mapping more regions of astronomical interest within a space mission lifetime compared to current heterodyne arrays. Similar statements also apply to ground-based telescopes especially at frequencies where suitable weather conditions are rare. The challenge to develop large arrays now is to generate a large LO array with sufficient power and good uniformity among individual beams [11]. In comparison with LO sources based on multipliers [12], quantum cascade lasers (QCLs) are a more promising LO source in the supra-THz region due to its high output power. Current QCLs working at supra-THz frequencies have been demonstrated to cover the range from 1.2 THz to 4.9 THz, and their output powers typically are milliwatts or more [13], which is sufficient as an LO for a heterodyne array with more than 100 mixers. Besides, the distributed-feedback (DFB) laser structures based on double metal waveguide designs allow single-mode emission and high-temperature operation [14]. Therefore, multiplexing a single beam from a QCL by a diffraction grating to generate an LO array is an attractive approach for large heterodyne arrays.
A phase grating has played a crucial role in optics-related science and applications, including orbital angular momentum beams for optical communications, chromatic broadband nulling, UV and terahertz beam multiplexing, and complex beam shaping [15–19]. A phase grating is a periodic structure converting a single coherent radiation beam into multi-beams in different directions by manipulating the phase of the input beam. In [20], Dammann and Görtler proposed gratings with binary groove shapes, called Dammann gratings, and also structures with continuous phase-only groove shapes. Compared to a Dammann grating, a grating with a continuous phase-only groove shape achieves a higher diffraction efficiency, which is defined as the ratio between the power diffracted into the desired orders and the power of the input beam. The use of a Fourier synthesis technique to achieve the continuous phase-only groove shapes was proposed by Schmahl [21], and gratings having a fundamental and a finite number of harmonics are called Fourier gratings [22]. Better milling tool permits fabrication of Fourier gratings with finer features, thus higher diffraction efficiency. In essence, such a structure can also be viewed as a metasurface, manipulating the phase of the incoming beam [23]. Lanigan et al. fabricated a 3-pixel Fourier grating at 0.1 THz [24]. Graf and Heyminck [25] demonstrated an 8 beams grating operated at 490 GHz with a measured diffraction efficiency ~84%. A 7 pixel grating operated at 1.1 THz with diffraction efficiency ~80% has also been realized in [26]. Recently, Mirzaei et al in [27] have pushed the frequency further to 1.4 THz, and even to the 4.7 THz with a 2 × 4 Fourier grating with a diffraction efficiency of 74% in [18]. A 4.7 THz grating of 2 × 4 will be used as an LO multiplexer for mapping [OI] line emission in Galactic/extragalactic Ultra long duration balloon Spectroscopic Stratospheric THz Observatory (GUSTO), which will be launched in 2021 [28]. Fourier gratings have good performance in terms of diffraction efficiency and uniformity among the image beams when the number of output beams is less than 10. In this case, about 20 – 30% of the incoming beam power is diffracted into unwanted higher diffraction order modes. Interestingly, a Fourier grating aiming for more diffraction orders (or
a large number of diffracted beams) can offer a higher diffraction efficiency according to simulation shown below.
From the manufacturing point of view, accurately duplicating the surface profile of a Fourier grating is crucial [29], especially for large-pixel gratings working at supra-THz regions, since the performance of the grating is dominated by the surface profile. A Fourier grating operated at a higher frequency is more difficult to fabricate since the accuracy is more demanding. In this paper, we present a Fourier grating that generates 81 beams at 3.86 THz, where the incoming beam is provided by an unidirectional antenna coupled 3rd-order distributed feedback (DFB) QCL [30].
2. Fourier grating
2.1. Diffraction theory
Based on the diffraction theory [31], the diffracted far field beam distribution from a phase grating is mathematically represented by
2 2 2 2 2 ( ) ( ) ( ) 2 2 ( , ) { ( , ) } k k j z j x y j j x y z z z e U x y e U e e d d j z π λ ξ η ξ η λ ξ η ξ η λ ∞ − + + + −∞ =
(1)where the term U( , ) exp((ξ η jk/ 2 )(z ξ η2+ 2)) describes the field distribution in the
grating plane. Based on Eq. (1), the far field distribution is the Fourier transform of the field distribution in the grating plane. Since a phase grating manipulates the phase component of the incoming coherent beam, the field distribution in the phase grating plane is
exp(jΔφ ξ η( , )), where Δφ ξ η( , ) is called a phase modulation function and is expanded in a
Fourier series with a set of Fourier coefficients an. Using the Fast Fourier Transform
algorithm in Matlab, we define the far field multi-beams distribution. Then a set of an is found
for the desired number of diffraction orders with high diffraction efficiency and good uniformity using the Standard multidimensional minimization algorithm in Matlab. According to the relation between phase difference and groove depth of the surface structure on the grating d = Δλ φ π/ 4 cosθi, where λ is the wavelength of the input radiation, ∆φ the
phase difference, and θi the incident angle with respect to the normal direction of the grating,
we can define the groove profile of the grating based on the phase modulation function.
2.2. Grating design and fabrication
We generate a two-dimensional (2D) grating by superposition of two 1D gratings orthogonally. Thus its beam pattern is orthogonally distributed. In order to maintain the symmetry, gratings with an even number of employed diffraction-orders (pixels) are added with a half-wave phase step in one half of the unit cell to suppress all the even orders [25], making their surface structure finer than odd-pixel gratings. Besides, even-pixel gratings have lower diffraction efficiency than odd-pixel gratings since the intensities in even diffraction-orders cannot be fully suppressed in most cases. Table 1 shows the diffraction efficiency of 1D gratings with different number of beams and their minimum radius of curvature (MRC) by assuming that the input beam is normally incident to the grating and by assuming a 1.2 mm unit cell. MRC is a crucial parameter for the manufacturer because the designed fine structure of the grating surface can only be reproduced when MRC of the grating is larger than the radius of the ball end mill used in a micro-milling machine. Our initial goal was to demonstrate a 100 beam grating. However, we chose to start with a grating for 81 beams because our simulation shows that a 9 × 9 pixel grating can achieve 98% diffraction efficiency and also a relatively uniform power distribution among the diffracted beams.
Table 1. The diffraction efficiency and minimum radius of curvature of gratings with different number of beams.*
Pixel number 2 3 4 5 6 7 8 9 10 11 Diffraction efficiency (%) 80.6 92.5 90.8 92.3 86.6 96.9 91.9 99 87.0 97.5 MRC(μm) 102 1167 94 513 84 312 62 267 54 153 *All the gratings are illuminated with a normal incident beam and their unit cell sizes are fixed to 1.2 mm. Generally speaking, odd-pixel gratings have higher diffraction efficiency and larger MRC than what those from even-pixel gratings because even-pixel gratings are added a half-wave phase step in one half of the unit cell.
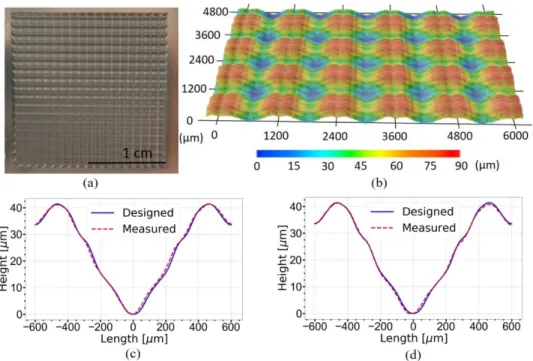
Fig. 1. (a) 81 pixel Fourier grating machined on a 5 mm thick aluminum plate. Gating contains 16 × 16 unit cells, each of them is 1.2 mm × 1.2 mm in size, thus the entire grating is 2 cm × 2 cm. (b) The surface topology of the 81 pixel grating taken by a 3D optical microscope. The color indicates the height. (c), (d) The comparison between the designed profile in red (dashed) and the manufactured profile in blue.
Based on the equation for a 1D reflection grating, D(sinθm−sin )θi =mλ, where D is the periodicity, θm is the angle of the m’th diffraction order, and θi is the incident angle with
respect to the normal of the grating, the angular separation of the image beams is calculated to be ~3.8° (in our case, D = 1.2 mm, θi = 12°, and λ = 78 μm). The grating is machined on an
aluminum plate (Alcoa QC-10 Mold Alloy, of 5 mm thick) using an KERN EVO micro-milling machine. The MRC for this design is 357 μm, which is about 4 times the radius (90 μm) of the smallest ball end mill currently available for the micro-milling machine used. In this case, this machine is capable of patterning all the fine surface features. A photo of the manufactured grating and its 3D optical microscope image are shown in Fig. 1(a) and (b), respectively. The entire grating contains 16 × 16 unit cells and is 2 cm × 2 cm in size. We also measured the surface profile of a unit cell in two orthogonal directions using a Dektak XT30 stylus profiler. We found good agreement between the measured profile and the designed one with a deviation less than 1 μm in height (1/78 of the working wavelength). The effect of such a difference on the grating performance will be discussed in the results section.
3. Measurement setup
We apply an unidirectional antenna-coupled 3rd order distributed feedback (DFB) quantum cascade laser (QCL) at 3.86 THz as the input source for the grating. This laser can provide more than 10 mW output power. The unidirectionality, resulting from the reflector shown in Fig. 2(a), enhances the power level of the forward beam by a factor of ~2. In our measurement, we used one of the lasers out of an array of 20 DFB lasers as the input source. Figure 2(b) shows the laser array chip mounted on a carrier.
Figure 3 shows our measurement setup schematically. The QCL was mounted in a pulse tube cooler working at ~10 K. We measured the far field beam pattern of the laser at a distance of about 3.5 cm from the laser, which is shown in Fig. 2(c). The beam has a size ~25 mm in the vertical direction and ~15 mm in the horizontal direction, implying the full width at half-maximum (FWHM) divergence angles to be 23° and 14° in the vertical and horizontal directions, respectively. Obviously the beam has considerable deviation from a fundamental Gaussian beam profile. Since the Fourier grating duplicates the beam pattern of the input beam in its output, directly applying the beam in Fig. 2(c) to the grating requires a large distance to image the output beams with sufficient angular separation to be spatially resolved. However, taking into account the absorption by water vapor in the air at this frequency, we have to choose a short optical path that is within 30 cm in practice. To overcome this issue, we have to make a smaller and collimated incident beam to the grating. We introduced a high-density polyethylene plano-convex lens with a 20 mm focal length to collimate the QCL beam first and then we filtered it with a 5 mm iris aperture. The resulting beam is symmetric and Gaussian-like, shown in Fig. 2(d). This beam is nearly collimated with its FWHM divergence angle to be < 1°. It is also important to notice that the incoming beam at the position of the grating has a diameter of 7 mm and covering more than 5 unit cells on the grating. Although the power of the modified beam is lower than the output power of the QCL (5-10% powers), there is still sufficient power to map output beams of the gratings with a good signal-to-noise ratio.
The incident angles of the incoming beam are 12 ± 2° and ± 2° with respect to the normal of the grating plane in the horizontal and vertical directions, respectively (see Fig. 3). A pyro-electric room temperature detector mounted on a 2D scanner is used to map the image beam pattern at a distance of 12 cm from the grating surface. The detector has a 2-mm diameter aperture and is mounted inside an aluminum housing. The latter together with the planar mapping makes the measured power direction dependent with the maximum if the radiation is incident normally. The detector is read out by a lock-in amplifier. An arbitrary waveform generator is used to modulate the power supplier of the QCL and provides a reference to the lock-in amplifier with a 70 Hz sinusoidal function. A PC is used to control the 2D scanner and record the data from the lock-in amplifier.
To compare the total power of the image beams of the desired modes with that of the input beam, we measured the input beam power in the following way, where the grating is replaced by a gold coated mirror, which reflects nearly 100% power. The reflected single beam is also mapped by the pyro-electric detector at the same distance as measuring the grating imaging beam (12 cm). In this way, we can compare the relative power values accurately since the effect of water absorption due to the optical path is canceled out even though we do not know the absolute power. Caution has been taken to reduce stray light by introducing THz blackbody absorbers to cover the outside area of the circular aperture and the unilluminated area of the grating.
Fig. 2. (a) The SEM of the 3rd-order DFB QCL [30]. (b) Array of DFB lasers gold-wire bonded to an electronic chip [30]. (c) Beam pattern of the QCL measured at a distance ~3.5 cm from the laser. It deviates from Gaussian profile and has large divergence angles in both vertical and horizontal directions. (d) Pattern of the QCL beam collimated by a lens and filtered by an iris aperture, measured after reflection from a flat gold-coated mirror in place of the grating in the setup.
Fig. 3 QCL sinuso collim by an 2D sc ampli reads 4. Experime Figure 4(a) sh distance of 12 since the pyr beams, which equation. We is most visibl we recorded across a sphe visualize the 4(b). We foun slightly more rightmost colu incident angle To compa beam pattern importing the both orthogon beam pattern surface as in to the measur measured 81 b to diffraction the simulation beam. Howev seen in the m we applied C . Schematic diagra is cooled to ~10 oidal function at 7 mated by a high-de aluminum mirror canner stage is use fier with a 70 Hz out the signal rece
ent results an
hows our meas 20 mm from t o-electric dete h are well sepa
do notice som e in the rightm the beam patt erical surface
power distribu nd that the pow uniform than umn, where th e of 12° in the h are the measure
of the grating e surface profi nal directions, w is also plotte our experimen rement in Fig. beams. The de efficiency and n shows the dif ver, we notice t measurement, e COMSOL bec am of the measure 0 K by a pulse tu 70 Hz using an ar ensity polyethylen r to illuminate the ed to map the beam
z sinusoidal funct eived from the lock
nd discussio
sured beam pa the grating sur ector converts arated, and hav me distortions f most column of tern from a pla
since the diff ution of the di wer distribution
the power dis he beams are b horizontal dire ement with the g using COMS le of the desig while taking th ed along the p nt. We can clea 4(a). In other tailed compari d power uniform ffracted individ that the uniform specially for th cause the Fast
ement setup to test ube cooler and it rbitrary waveform ne lens and filtered
grating plane. A p m pattern. The rece tion reference. Th k-in amplifier.
ons
attern in a plan rface. The inten
the detected i ve angular dir from a perfect f the beams. Th ane, but the a fracted beams iffracted beam n in the vertica stribution in th
oth non-unifor ection, but norm
prediction, Fig SOL Multiphy gned unit cell he input as a G plane, which h arly see 81 rec words, the sim ison between m
mity will be g dual beams ha mity of the sim he beams in th t Fourier Tran the performance o ts bias voltage is m generator. The Q d by an iris apertu pyro-electric detec eived signal is rea he computer contr ne with an area nsity is expres intensity to vo rections matchi rectangular be he distortions appropriate wa propagate sp ms, a 3D plot i al direction of he horizontal d rm and weaker mal in the verti g. 4(d) shows t ysics [32]. The of the grating Gaussian beam. has the same ctangularly dis mulated 81 bea measurement an iven later. It is ave the same be mulated 81 beam he rightmost co nsform algorith
of the grating. The s modulated by a QCL beam is first ure, then reflected ctor mounted on a ad out by a lock-in rols the stage and
a of 84 × 84 m ssed in units o oltage. We obs ing to the 1D eam distributio come from the ay is to map th pherically in s is also include f the measured direction, excep r. This is caus ical direction. the simulated d e result is simu g and by repea The simulated distance to th stributed beam ams well repro nd simulation r s worth mentio eam profile as ms is better tha olumn. In this hm in Matlab e a t d a n d mm2, at a of voltage served 81 grating’s on, which e fact that he beams space. To ed in Fig. beams is pt for the ed by the diffracted ulated by ating it in d far field he grating ms, similar oduce the regarding oning that the input an what is analysis, b used to
generate the surface profile is not suitable for generating spatially distributed diffracted beams.
For the non-uniformity in the measured beams, there are a few practical factors in the measurement that can affect the uniformity in the beam distribution: (1) There were humidity changes in the laboratory during the beam mapping, which took roughly 20 hours. During this period, the relative humidity varies between 25% and 45%, which in turn changes the absorption and influences the image beam intensity distribution. (2) Power coupling between the pyro-electric detector and the image beams. During the mapping of the image beams, the measured power is angle-dependent, with more power for the beams in the center, but less power for the outer beams. (3) There are possible errors to determine the exact incident angle. The grating is designed for an incident angle of 12° in one direction and 0° in the orthogonal direction. However, in our experiment, it is problematic to determine the incident angle since THz radiation is invisible. We estimate an error of ± 2° on the incident angles, which can also influence the intensity distribution of the image beams. (4) Different distances between the grating and individual image beams. Since we scan the detector along a plane, the distance between the grating and scanning position for each beam varies and it is larger for the outer beams. A longer distance means more loss due to the air absorption. All these experimental errors can influence the measurement of the grating with regard to the diffraction efficiency and uniformity.
To correct the error due to the angle-dependent power measured by the pyro-electric detector, we calibrated the dependence by changing the facing angle of the detector to the beams in both vertical and horizontal directions. We then adjusted the measured intensity of the beams. We also measured the power loss due to different distances between the grating and individual image beams, and found a maximum loss of 0.8%, which is negligible. Other errors are difficult to correct so the only correction is the angular dependence of the detector power in our data analysis. However, we removed the noise floor caused by the pyro-electric detector itself in the image beam data and in the input beam data. Figure 4(c) shows the corrected measured beam pattern, which agrees better with the simulated one in Fig. 4(d). We then calculated the diffraction efficiency based on the corrected data set. We found that the diffraction efficiency is 94 ± 3%. This efficiency suggests that 94% of power has been transferred from the input beam to the diffracted 81 beams by the grating. Clearly, it is a highly efficient Fourier grating. The error bar accounts mainly for the following two sources: the humidity changes in the laboratory and the ± 2° error in the incident angle.
In running COMSOL Multiphysics, we used the periodic port with periodic boundary conditions in the RF (radio frequency) module to get the simulated diffraction efficiency. The simulated diffraction efficiency of the designed grating is 98%, but as stated in section 3, there is a small mismatch (~1 μm) between the manufactured and designed surface profile. So we also imported the manufactured surface profile into COMSOL and found a diffraction efficiency of 97%. It reduces the efficiency by 1%. This 97% value agrees with the measured value of 94 ± 3% within the margin of error.
Fig. 4 beam floor. Another i distribution. W beam will pu value, in wh sensitivity of superconducti heterodyne in However, unl only below 1. of the LO pow set of pumpe isothermal tec optimal powe heterodyne re From the d different colu the total powe
4. (a) Measured be pattern after calib (d) Simulated far
mportant perfo When the grati ump a mixer, a hich all the m the mixers an ing hot electr nstrumentation like supercondu
.4 THz, and Sc wer, the perfo d current-volta chnique [35], er, the receiv eceiver, remain data in Fig. 4(c umns in Fig. 5( er if the diffrac
eam pattern. (b) 3D brated the effect o
field beam pattern
formance indic ing is used to and thus the po mixers will pe nd the optical c ron bolometer due to their h ucting–insulato chottky diode rmance of HE age characteris we find that i er noise temp ns at a value wi c), we calculate (a), where we cted beams are
D beam profile of of the coupling w n of the designed g cator of a grat generate multi ower should b rform optimal components be r (HEB) mixe high sensitiviti or–supercondu mixers, which EB mixers is L stic data with if the LO pow perature, whic ithin 10% of th e the relative p should expect perfectly unifo
f the image beam with detector and r
grating.
ting is its unif tiple beams as be within certa lly. The detai efore the mixer ers are the de ies and low L uctor (SIS) mix h are relatively LO power depe a variable LO wer changes wi ch characterize he best sensitiv power for each
t all the beams orm.
pattern. (c) Image removed the noise
formity in bea a local oscilla ain range of th ils can depend
r. In supra-TH etectors of ch LO power requ
xers, which are insensitive to endent [33]. Ba O power in [34 ithin ± 20% a es the sensitiv vity [36].
beam, and plo s to weight for e e am power ator, each he desired d on the Hz region, hoice for uirements. e operated variation ased on a 4] and the around its vity of a ot them in r 1.2% of
Fig. 5 colum surfac We found mainly on the comparison, t varies from simulation al From Fig. 5(a can be directl same LO pow The differenc surface profi COMSOL Mu that 68 beams in manufactur humidity chan in the measur that require l array. It is rel size of an HE To realize example, to b beyond the cu can design a instead of sup diffraction ef uniformity, bu gratings to ge the power dis horizontal dir 0° in vertica normally inci incident angle results demon on the power separate 1D g
5. (a) The power mns. (b) The power
ce structure.
d that the relativ e two rightmo the simulated p 0.8 to 1.45% so suggests th a) the power o ly used to pum wer. In contrast ce is likely du le. By import ultiphysics and s out of 81 are ring seems to nge in the labo red beams, we ower or highe atively easy to B. e the simulate e as good as 0 urrent simulati 2D grating by perimposing tw fficiency is im ut it needs to enerate a rectan stribution in th rection. That is al direction an dent beam wil e is needed for nstrate that the r uniformity in gratings of 9-pi
r distribution of t r distribution of th
ve power varie ost columns (co
power distribut %. So the sim he non-uniform of 64 beams ou mp an uniform t, 78 beams ou ue to the mism ting one unit d simulating th within ± 20% play a crucial oratory may als e can still effec er LO than the o control the req d uniformity, .5 μm. Howeve on result, ther y directly searc wo 1D grating mproved using be demonstrat ngularly distrib he vertical dir s due to the dif nd 12° in hor ll increase the r a reflection g incident angle n the vertical d xels in series.
the measured ima he image beams fr es from 0.4 to olumns 8 & 9 tion is plotted mulation gives mity contribute ut of 81 are wi m HEB mixer a ut of 81 vary w match between cell of the m he power distr % around the no role in the un so affect the un ctively use all e nominal valu quired LO pow we can impro er, to improve e are two poss ching for the F s orthogonally
this method [ ted in practice buted beam pat rection is obvi fferent incident izontal directi uniformity of grating. Since b e in the horizo direction, one c
age beams distrib rom the simulation
1.5% and the n 9) in the measu in Fig. 5(b), w a better unif ed largely by ithin ± 20% ra array, where e within this rang n the designed manufactured ribution of the ominal value. T niformity of th niformity. Des 81 beams by ue instead of wer of a HEB m
ove the manu the power uni sible methods Fourier coeffic y. It has been r
[37]. Potential e. Alternatively ttern. From the iously more un
t angles in thes ion. Illuminati f the grating, b both the simul ntal direction h can generate 8
buted in different n using a designed
non-uniformity ured beam pat where the relati
formity. How the rightmost ange, i.e., the 6 every HEB req ge from the sim d and the manu
surface topol output beams Therefore, the he grating. Bes spite the non-un
replacing the an ideal unifo mixer by contro facturing accu formity of the to proceed. Fir cients for a 2D recently shown lly it may imp y, one can use e beam pattern niform than th se two directio ing the gratin but in reality a
lation and mea has nearly no 81 beams by u t d y happens ttern. For ive power ever, the t column. 64 beams quires the mulation. ufactured logy into s, we find precision sides, the niformity detectors orm HEB olling the uracy, for LO array rstly, one D grating n that the prove the e two 1D in Fig. 4, hat in the ons, being g with a non-zero asurement influence using two
5. Conclusion
We report a 81-beams supra-THz LO array generated by a Fourier grating with a unidirectional 3rd-order DFB QCL emitting single mode radiation at 3.86 THz. We succeeded in measuring 81 diffraction beams and, due to a high output power of the QCL, we have achieved a good signal-to-noise ratio allowing us to determine the diffraction efficiency of the grating, which is 94 ± 3%, and evaluate the power uniformity of the image beams. The measured diffraction efficiency agrees well with the simulated result using the profile of the manufactured Fourier grating. The latter gives 97% efficiency. Based on the measurements and uniformity requirement of the LO power for superconducting HEB mixers, we find 64 beams out of 81 have their power varying within ± 20% around the nominal value and that the 64 beams can be used to pump a 64 uniform array, maintaining the sensitivity degraded less than 10%. Our results open a new route towards a large heterodyne array of order of 100 pixels for future space instruments. Our Fourier grating approach can improve the functionalities of the phase gratings, such as the diffraction efficiency, for orbital angular momentum beams for optical communications, UV beam splitting, and complex beam shaping.
Funding
China Scholarship Council Studentship (CSC) (201706030153); University of Groningen (RUG); TU Delft Space Institute; National Aeronautics and Space Administration (NASA).
Acknowledgments
We thank Yunchen Luo for developing the grating code, Matt Underhill for fabricating the grating, Marcel Ridder for measuring the grating surface profile, and Paul Urbach for helpful discussions.
References
1. P. Garbacz, “Terahertz imaging – principles, techniques, benefits, and limitations,” Problemy Eksploatacji - Maintenance Problems 1, 81–92 (2016).
2. C. Risacher, R. Güsten, J. Stutzki, H.-W. Hübers, R. Aladro, A. Bell, C. Buchbender, D. Büchel, T. Csengeri, C. Duran, U. U. Graf, R. D. Higgins, C. E. Honingh, K. Jacobs, M. Justen, B. Klein, M. Mertens, Y. Okada, A. Parikka, P. Pütz, N. Reyes, H. Richter, O. Ricken, D. Riquelme, N. Rothbart, N. Schneider, R. Simon, M. Wienold, H. Wiesemeyer, M. Ziebart, P. Fusco, S. Rosner, and B. Wohler, “The upGREAT dual frequency heterodyne arrays for SOFIA,” J. Astron. Instrum. 7(04), 1840014 (2018).
3. C. Pabst, R. Higgins, J. R. Goicoechea, D. Teyssier, O. Berne, E. Chambers, M. Wolfire, S. T. Suri, R. Guesten, J. Stutzki, U. U. Graf, C. Risacher, and A. G. G. M. Tielens, “Disruption of the Orion molecular core 1 by wind from the massive star θ1 Orionis C,” Nature 565(7741), 618–621 (2019).
4. Y. M. Seo, P. F. Goldsmith, C. Walker, D. J. Hollenbach, M. G. Wolfire, C. Kulesa, V. Tolls, P. N. Bernasconi, Ü. Kavak, F. F. S. van der Tak, R. Shipman, R. G. Jian, A. Tielens, M. G. Burton, H. Yorke, E. Young, W. L. Peters, A. Young, C. Groppi, K. Davis, J. L. Pineda, W. D. Langer, J. H. Kawamura, A. Stark, G. Melnick, D. Rebolledo, G. F. Wong, S. Horiuchi, and T. B. Kuiper, “Probing ISM Structure in Trumpler 14 & Carina I Using The Stratospheric Terahertz Observatory 2,” Astrophys. J. 878(2), 2 (2019).
5. P. H. Siegel and R. J. Dengler, “Terahertz Heterodyne Imaging Part II: Instruments,” J. Infrared Millim. Terahertz Waves 27(5), 631–655 (2006).
6. E. Gerecht, D. Gu, L. You, and K. Sigfrid Yngvesson, “A Passive Heterodyne Hot Electron Bolometer Imager Operating at 850 GHz,” IEEE Trans. Microw. Theory Tech. 56(5), 1083–1091 (2008).
7. S. Kumar, “Recent Progress in Terahertz Quantum Cascade Lasers,” IEEE J. Sel. Top. Quantum Electron. 17(1), 38–47 (2011).
8. U. U. Graf, C. E. Honingh, K. Jacobs, and J. Stutzki, “Terahertz Heterodyne Array Receivers for Astronomy,” J. Infrared Millim. Terahertz Waves 36(10), 896–921 (2015).
9. A. M. Korolev, V. M. Shulga, and S. I. Tarapov, “Extra-low power consumption amplifier based on HEMT in unsaturated mode for use at subkelvin ambient temperatures,” Cryogenics 60, 76–79 (2014).
10. Y. Kim, Y. Zhang, A. Tang, T. Reck, and M.-C. F. Chang, “A 1.5 W 3 GHz Back-End Processor in 65-nm CMOS for Sub-Millimeter-Wave Heterodyne Receiver Arrays,” 29th International Symposium for Space Terahertz Technology (ISSTT 2018), pp. 92.
11. J. A. Murphy, C. O’Sullivan, N. Trappe, W. Lanigan, R. Colgan, and S. Withington, “Modal Analysis of the Quasi-Optical Performance of Phase Gratings,” J. Infrared Millim. Terahertz Waves 20(8), 1469–1486 (1999).
12. J. V. Siles, R. H. Lin, C. Lee, E. Schlecht, A. Maestrini, P. Bruneau, A. Peralta, J. Kloosterman, J. Kawamura, and I. Mehdi, “Development of high-power multi-pixel LO sources at 1.47 THz and 1.9 THz for astrophysics: present and future,” 26th International Symposium on Space Terahertz Technology (ISSTT 2015), pp. 40–42. 13. M. S. Vitiello, G. Scalari, B. Williams, and P. De Natale, “Quantum cascade lasers: 20 years of challenges,” Opt.
Express 23(4), 5167–5182 (2015).
14. S. Kumar, B. S. Williams, Q. Qin, A. W. M. Lee, Q. Hu, and J. L. Reno, “Surface-emitting distributed feedback terahertz quantum-cascade lasers in metal-metal waveguides,” Opt. Express 15(1), 113–128 (2007).
15. T. Lei, M. Zhang, Y. Li, P. Jia, G. N. Liu, X. Xu, Z. Li, C. Min, J. Lin, C. Yu, H. Niu, and X. Yuan, “Massive individual orbital angular momentum channels for multiplexing enabled by Dammann gratings,” Light Sci. Appl. 4(3), 257 (2015).
16. S. Martin, G. Serabyn, K. Liewer, and B. Mennesson, “Achromatic broadband nulling using a phase grating,” Optica 4(1), 110–113 (2017).
17. Q.-K. Li, Q.-D. Chen, L.-G. Niu, Y.-H. Yu, L. Wang, Y.-L. Sun, and H.-B. Sun, “Sapphire-Based Dammann Gratings for UV Beam Splitting,” IEEE Photonics J. 8(6), 2500208 (2016).
18. B. Mirzaei, J. R. G. Silva, D. Hayton, C. Groppi, T. Y. Kao, Q. Hu, J. L. Reno, and J. R. Gao, “8-beam local oscillator array at 4.7 THz generated by a phase grating and a quantum cascade laser,” Opt. Express 25(24), 29587–29596 (2017).
19. Y. Nakata, K. Osawa, and N. Miyanaga, “Utilization of the high spatial-frequency component in adaptive beam shaping by using a virtual diagonal phase grating,” Sci. Rep. 9(1), 4640 (2019).
20. H. Dammann and K. Görtler, “High-efficiency in-line multiple imaging by means of multiple phase holograms,” Opt. Commun. 3(5), 312–315 (1971).
21. G. Schmahl, “Holographically made diffraction gratings for the visible, UV and soft X-ray region,” J. Spectrosc. Soc. Jpn. 23, 3–11 (1974).
22. P. Bliek, R. Deleuil, M. Breidne, and D. Maystre, “Microwave verification of a numerical optimization of fourier gratings,” Appl. Phys. (Berl.) 24(2), 147–150 (1981).
23. N. Meinzer, W. L. Barnes, and I. R. Hooper, “Plasmonic meta-atoms and metasurfaces,” Nat. Photonics 8(12), 889–898 (2014).
24. W. Lanigan, N. Trappe, J. A. Murphy, R. Colgan, C. O’Sullivan, and S. Withington, “Quasi-optical multiplexing using reflection phase gratings,” in 11th International Symposium on Space Terahertz Technology (ISSTT, 2000), pp. 616–625.
25. U. U. Garf and S. Heyminck, “Fourier grating as submillimeter beam splitter,” IEEE Trans. Antenn. Propag.
49(4), 542–543 (2001).
26. C. E. Groppi, C. K. Walker, C. Kulesa, D. Golish, A. Hedden, P. Gensheimer, G. Narayanan, A. W.
Lichtenberger, U. U. Graf, and S. Heyminck, “Desert STAR: A 7 pixel 345 GHz heterodyne array receiver for the Heinrich Hertz Telescope,” Proc. SPIE 4855, 330–337 (2003).
27. B. Mirzaei, J. R. G. Silva, Y. C. Luo, X. X. Liu, L. Wei, D. J. Hayton, J. R. Gao, and C. Groppi, “Efficiency of multi-beam Fourier phase gratings at 1.4 THz,” Opt. Express 25(6), 6581–6588 (2017).
28. J. R. G. Silva, B. Mirzaei, W. Laauwen, N. More, A. Young, C. Kulesa, C. Walker, A. Khalatpour, Q. Hu, C. Groppi, and J. R. Gao, “4×2 HEB receiver at 4.7 THz for GUSTO,” Proc. SPIE 10708, 107080Z (2018). 29. H. Dammann and E. Klotz, “Coherent Optical Generation and Inspection of Two-dimensional Periodic
Structures,” Opt. Acta (Lond.) 24(4), 505–515 (1977).
30. A. Khalatpour, J. L. Reno, N. P. Kherani, and Q. Hu, “Unidirectional photonic wire laser,” Nat. Photonics 11(9), 555–559 (2017).
31. J. W. Goodman, Introduction to Fourier Optics, (McGraw-Hill, 1968). 32. C O M S O L. Multiphysics, https://www.comsol.com/rf-module.
33. C. E. Groppi and J. H. Kawamura, “Coherent Detector Arrays for Terahertz Astrophysics Applications,” IEEE Trans. Terahertz Sci. Technol. 1(1), 85–96 (2011).
34. P. Khosropanah, J. R. Gao, W. M. Laauwen, and M. Hajeniusb, “Low noise NbN hot electron bolometer mixer at 4.3 THz,” Appl. Phys. Lett. 91(22), 221111 (2007).
35. H. Ekström, B. S. Karasik, E. L. Kollberg, and K. S. Yngvesson, “Conversion gain and noise of niobium superconducting hot-electron-mixers,” IEEE Trans. Microw. Theory Tech. 43(4), 938–947 (1995).
36. The isothermal technique is based on the assumption that the mixer has the same response to LO power and DC power, we can estimate the absorbed LO power in a mixer from the pumped current-voltage curves. In [34] P. Khosropanah, et al measured a set of current-voltage curves of a similar HEB mixer pumped with different LO power operated at 4.3 THz, and from the data when the LO power varies within ~40% the change in HEB mixer’s bias current is ~37%, which responds to ~10% changes in the noise temperature.
37. U. U. Graf, “Enhanced diffraction efficiency of two-dimensional phase gratings,” Opt. Express 26(25), 32739– 32742 (2018).
![Fig. 2. (a) The SEM of the 3rd-order DFB QCL [30]. (b) Array of DFB lasers gold-wire bonded to an electronic chip [30]](https://thumb-eu.123doks.com/thumbv2/123doknet/13809537.441672/7.918.197.725.147.618/fig-sem-order-dfb-array-lasers-bonded-electronic.webp)


