HAL Id: hal-02326707
https://hal.archives-ouvertes.fr/hal-02326707
Submitted on 22 Oct 2019HAL is a multi-disciplinary open access archive for the deposit and dissemination of sci-entific research documents, whether they are pub-lished or not. The documents may come from teaching and research institutions in France or abroad, or from public or private research centers.
L’archive ouverte pluridisciplinaire HAL, est destinée au dépôt et à la diffusion de documents scientifiques de niveau recherche, publiés ou non, émanant des établissements d’enseignement et de recherche français ou étrangers, des laboratoires publics ou privés.
populations
Gabrielle Dubuc-Messier, Samuel Caro, Charles Perrier, Kees van Oers, Denis
Reale, Anne Charmantier
To cite this version:
Gabrielle Dubuc-Messier, Samuel Caro, Charles Perrier, Kees van Oers, Denis Reale, et al.. Gene flow does not prevent personality and morphological differentiation between two blue tit populations. Jour-nal of Evolutionary Biology, Wiley, 2018, 31 (8), pp.1127-1137. �10.1111/jeb.13291�. �hal-02326707�
Gene flow does not prevent personality and morphological differentiation between two blue tit populations.
Journal: Journal of Evolutionary Biology Manuscript ID JEB-2018-00170
Manuscript Type: Research Papers
Keywords: Cyanistes caeruleus, genetic divergence, local adaptation, personality, Phenotypic plasticity, Qst - Fst
Montreal, 8 april 2018 Dear editor,
Please find enclosed a manuscript entitled “Gene flow does not prevent personality and
morphological differentiation between two blue tit populations” that we wish to submit for publication in your journal.
We believe our work will be of interest to the broad readership of your journal because it challenges the general idea that gene flow limits populations genetic divergence and the importance of plasticity versus genetic effects in shaping population divergence for personality traits. We report on a common garden experiment exploring the genetic basis of phenotypic differences observed in the wild for personality, physiological and morphological traits between two blue tit (Cyanistes caeruleus) populations inhabiting contrasting habitats separated by a small spatial scale and connected by gene flow. We raised nestlings originating from the two habitats in aviaries for up to five years and then compared their adult phenotypes. Our results revealed differences similar to those found in the wild, suggesting a genetic divergence for all traits. In addition, Qst - Fst comparisons revealed that the observed quantitative genetic divergence is likely
the result of contrasting selection pressures rather than of neutral processes. Our study is one of the first to report Qst - Fst comparisons for personality traits and suggests that genetic divergence is possible at a small
spatial scale for behavioural and physiological traits. Such small scale evolution of animal personality and physiology has rarely been reported and shows that population genetic divergence is possible at a small spatial scale for traits generally considered less prone to genetic divergence.
We would like to thank you and the reviewers for providing constructive comments on the first version of the manuscript that we think have greatly improved our work. Please find attached a revised version of our manuscript and a detailed answer to all comments.
We agree for the dataset to be shared on Dryad after the paper is published. The manuscript is not under consideration for publication in another journal. All persons entitled to authorship have been named and have approved the submission of this version of the manuscript. The manuscript is 5978 words.
We hope you will consider for publication in your journal this revised version of our manuscript and we look forward to your assessment.
Best regards, The authors
Title
Gene flow does not prevent personality and morphological differentiation between two blue tit populations.
Authors
Gabrielle Dubuc-Messier a, b, Samuel P. Caro a, c, Charles Perrier a, Kees van Oers c, Denis Réale b*, Anne Charmantier a, b*
Affilitions
a. Centre d’Écologie Fonctionnelle et Évolutive, Unité Mixte de Recherche CNRS 5175, 1919 Route de Mende, Montpellier Cedex 5, France.
b. Département des sciences biologiques, Université du Québec à Montréal, Case postale 8888, succursale Centre-ville, Montréal (Québec), H3C 3P8, Canada.
c. Department of Animal Ecology, Netherlands Institute of Ecology (NIOO-KNAW), PO Box 50, 6700 AB, Wageningen, The Netherlands.
*
co-last authors
Running head
Divergence between blue tit populations
Gabrielle Dubuc-Messier: [email protected]
Université du Québec à Montréal, Département des sciences biologiques, Case postale 8888, succursale Centre-ville, Montréal (Québec), H3C 3P8, Canada.
Tél: 514-987-3000 ext.2265 Fax: 514-987-4647
Acknowledgements
We thank the landowners for permission to work on their properties and all the blue tit crew for their work, specifically Marta Szulkin, Christophe de Franceschi, Philippe Perret, Virginie Demeyrier, Samuel Perret and Boris Delahaie. We thank Julie Morand-Ferron, Andrew Handry, Arnaud Bechet and Jean-Francois Giroux for their comments. We also thank Marylou Aaldering, Floor Petit, Franca Kropman and Sonja Schaper for taking good care of the birds in captivity. The behavioural tests run at the NIOO-KNAW were approved by the Animal Experimentation
Committee of the Royal Dutch Academy of Sciences (DEC-KNAW; permit number CTE09–04 and NIOO11.09). The work performed in the field was approved by the prefectural office of Corsica and the Regional Direction of Environment (DIREN) committee (permit numbers 2009-0379 and 3467) and the tests run at the CEFE were approved by the Comité Institutionnel de Protection des Animaux (UQAM; CIPA-769-2015; 0413-R1-769-0414) in Canada. This project was funded by grants from the Agence Nationale de la Recherche (BioAdapt grant ANR-12-ADAP-0006-02-PEPS), the European Research Council (Starting grant ERC-2013-StG-337365-SHE) and the OSU-OREME to AC, by the Natural Science and Engineering Research Council of Canada (Discovery grant) to DR and the Netherlands Organisation for Scientific Research
(NWO-VENI grant 863.09.011) to SPC. GDM received PhD fellowships from the Fonds de Recherche Québec Nature et Technologies and the Natural Science and Engineering Research Council of Canada. We declare no conflict of interests.
Dear Dr Klingenberg,
Thank you for your feedback regarding our manuscript # JEB-2017-00630. We are very thankful for the new comments you provided as well as those from the two reviewers. We outline below how all these comments have been taken into account to provide a revised version of our manuscript that will now, we hope, be accepted for publication in Journal of Evolutionary Biology.
Comments from Editor
In my own reading of your paper, I have come across the act that you used the method of random skewers for comparing P matrices. This method has been criticised for lack of power and other statistical properties. Very recently, such a critique has been published by Jim Rohlf. Please have a look at this paper and think how the criticism applies to your analysis. I am not prescribing a particular course of action to you, but I would like you think about it as part of the further revisions.
>> Since the Qst, Pst and Fst comparison is more robust and provides stand-alone results that do not necessitate any complementary analysis, we have decided to remove the matrix
comparison done with the random skewer method that has been recently criticized. This does not change any conclusion from the manuscript, but it should remove any doubt regarding random skewers.
+++++++++++++++++++++++++++++++++++ Comments from reviewer 1
I have only two comments:
1. - The first one refer to the use of the term phenotypic plasticity (or plastic response) as synonym of environmental factors affecting phenotypes. I think it may confound readers and, whenever possible, I suggest the used of environmental factors throughout the manuscript. This is because phenotypic plastic response to environmental condition may have a genetic
component (see for instance Charmantier et al. (2008), Science) and, thus, phenotypic plastic responses may be due not only to environmental factors, but to genetic factors. Remember that the reaction norms may have strong genetic components, but you use plasticity as solely reflecting environmental effects. Traditional terms used in quantitative genetics are genetic, environmental and maternal effects and, thus, would strongly recommend the used of “environmental factors” instead of plasticity.
>> We partly disagree here with the reviewer’s opinion that our use of the term “plasticity” brings confusion in all its use. We now clarify that by plasticity we refer to “the adjustment of individual phenotypes in response to environmental factors” (definition provided in line 30). Note that plasticity does not result in a genetic change, however variance in plasticity can have a genetic origin when plasticity is heritable and lead to evolution of different plasticity across populations. Although this is a side issue to our study, we now explain this in lines 65 to 68. Finally, when addressing the issue of the Qst/Pst comparison, we have followed the reviewer’s advice and changed plasticity to environmental factors (lines 119 and 454).
2. - The second comment refers to the scarce information provided for used mixed model. You should explain how mixed models accounted for the structure of the data set (random blocks) (see for instance Schielzeth, H. & Forstmeier, W. (2009). Conclusions beyond support: overconfident estimates in mixed models. Behav Ecol 20: 416-420). Do you used random
intercept, random slope, or random intercept-and-slope models? Was identity of rearing brood nested within identity brood of origin? In the case of bird identity, this random factor should be nested within the interaction between brood of origin and rearing brood (or, in the case of a completely hierarchized structure of random factors, at the lower level). Remember that a correct definition of hierarchized random blocks is essential for proper estimations of genetic and
environmental factor explaining phenotypic variation.
>> Thank you for pointing out this imprecision. We used random intercepts for bird identity, brood of rearing and brood of origin. We now clarified this (L249 to 253).
Comments from reviewer 2
Comments on your written responses:
1. Re. my comment 12: I meant that care takers may not have fed blind with respect to origin. While I don´t really think there are box/nest/location, date or care taker effects, some readers may disagree, so perhaps it is best to mention these possibilities and state why you discard it. I think it is always a strength of a paper if it presents (and if space permits) discusses its potential weaknesses, as long as it doesn’t distract.
>> The populations that we study here differ in many traits, one of them being phenology (i.e. timing of reproduction). Because of this timing difference, raising the chick at the same time is impossible. We have made every effort possible for keeping the birds of the two populations into the same conditions, but for sure there are many little, sometimes unidentified, differences, that were impossible to control. Temperature was certainly a bit different (later in the season for the Fango birds), as well as humidity, photoperiod, they travelled in a different boat, etc. among which are the rearing conditions (caretakers, etc). Thus, it is impossible to pinpoint and inventory the exact differences that might have been of relevance to the birds. We have therefore clarified this timing difference between the populations (see L151 to 157), but we believe it is not possible to discuss it much further since we do not know if there were any relevant difference (and which ones) that the birds could have cued on despite our efforts to homogenize their environments and experiences.
2. Re. comment 41: you don´t address the concern of multiple testing, so no mention of the need for correction for a large number of tests, which inflate the probability to find
significant results. So Bonferroni correction or something similar might be called for. >> Bonferroni corrections have been criticized for being too conservative (Moran 2003). However, applying a Bonferroni correction to our results would lead to the same
conclusions as we found a p-value < 0.01 for all study traits except body mass. If the editor deems it useful, we can add this information in the results section but prefer not to. Moran, M. D. (2003). Arguments for rejecting the sequential Bonferroni in ecological studies. Oikos, 100(2), 403-405.
And instead of Wright, I meant Fisher ‘s method
(https://en.wikipedia.org/wiki/Fisher%27s_method), which to my opinion can also be used as a within-study meta-analysis. You repeatedly test the same hypothesis, just changing the response variable. So you could apply Fisher´s method to the p-values obtained for the habitat of origin tests.
>> We now use this test. We provide this information and the results of this test in lines 262 to 264 and 306 to 308 (p-value = 3.675 x 10⁻⁸).
3. Re. comment 46: with evergreen habitat being atypical, I mean not the habitat itself but in the evolutionary history of the Blue tit, assuming that the species is largely adapted to deciduous trees and that colonisation of evergreen forest is relatively recent, or that gene flow will be mostly from deciduous to evergreen populations (given the relative population sizes of Blue tits in each of the habitats at a large, European?, scale). Then, even if Blue tits in evergreen habitats are exposed to specific selection pressures and have actually evolved in that direction, that doesn´t mean that they are now adapted – there may still be an evolutionary lag. In fact, if you found directional selection on traits *within* a
habitat, this would confirm local maladaptation. Whether or not size-corrected body mass is a good measure of overall condition (whatever that is) in ad libititum fed, captive birds, is debatable, but I´m thinking of effects that are more general for maladaptation, such as maternal stress hormones or lack of micronutrients deposited in eggs affecting overall development (body, physiology, brain, behaviour). Again, I don´t know if this is likely, but if you think it is not, then explaining this in the paper might be the best way forward.
>> We agree that ongoing selection can be a sign of maladaptation. We also agree that we cannot completely exclude that early environmental effects such as maternal effects occurring before and soon after the chicks were sampled from their nest were at least partly responsible for the observed patterns. We discussed this possibility in length in lines 358 to 377.
Comments on the new version:
4. L 36: Edelaar & Bolnick 2012 TREE is also a useful citation in this section
>> We added this citation (L36) 5. L 53: and/or (you don´t need both)
>> We modified the sentence (L51)
6. L 54: also Richardson et al. 2014 TREE microgeographic divergence
>> We added this citation (L52).
7. L 67: given that you (correctly) scale you question to the dispersal distance, whether a species is highly mobile or not is now unimportant, so remove that part after the comma.
>> We changed the sentence (L65).
8. L 110: I like the layered approach to the issue of divergence in this paper, with three different analyses/data sets.
9. L 110: in this section you need to introduce the issue of Pst and Qst, explain what Pst is (not so commonly known), and why/that you will assume that the Pst of lab-reared birds should approximate Qst to a greater degree than the Pst of wild birds. (see L 106-107, where you do mention that P approximates G), if there is plasticity in the wild.
>> We added some details and explanations on this topic in L103 to L122. 10. L 144: do you actually know this? (I assume the birds were ringed)
>> We meant they were assigned randomly to a cage (L148). 11. L 145: fed ad libitum (saturation)?
>> ad libitum means that there was always food and water available for the birds. We never force-fed any bird, neither were they food-restricted. This term is commonly used in the literature.
12. L 153: tarsus at which age?
>> Adult (> 1 year of age), we now provide this information (L164). 13. L 188: blind with respect to what?
>> We now provide this information (L199).
14. L 211: what percentage of SNPs did you remove for being potentially under selection? I suppose this must be well under 1%. Nonetheless, many of these outliers will be false positives, i.e. highly divergent SNPs that actually are neutral and therefore should not be filtered out. So you are caught between a rock and a hard place. Perhaps, to obtain a conservative (upper) estimate for Fst, you could also report what value you obtain without this filtering step, so just overall genomic divergence.
>> We removed 0.7% of the total number of SNPs. We now provide this information (L223).Including or excluding SNPs putatively under divergent selection (Fst of 0.004 and 0.006 respectively) provided high Qst/Fst ratio in both cases. Excluding loci
putatively under selection therefore had little effect on the general conclusion, (which is expected in a context of putatively highly polygenic traits and very low genetic
differentiation among populations, resulting in few outliers SNPs of large effects and high differentiation).
15. L 245: check use of singular/plural
>> Done (L257)
16. L 265-266: so move this introduction up, to line 110
>> Done (L114 to 117). 17. L 278: habitat of
18. L 279: and individual in the case of body mass? So basically, all random effects variances plus residual variance?
>> Yes, we now provide this information (L280-281)
19. L 280: this is the Pst for wild birds? Why not include the random effect of brood?
>> These birds were measured once adult, for many of them we did not know the brood of origin.
And I guess observer is random here, because many people were involved?
>> Yes, L288
But did you then include this observer variance component into the within-population variance? (For Pst you don´t specify which variances were used to calculate the within-pop variance component).
>> Yes, we now provide this information (L287 to 289)
This to me would not seem correct, since observer effects are not within-population genetic variation (as mentioned before in my comment 34 of the previous revision). The same might actually be true for rearing brood effect: this could be indirect genetic effects, but could also be purely or mostly environmental. And the same issue for the residual variance: to what extent is this genetic variance, or just unexplained environmental noise around the genotypic value? I think you now assume it is fully genetic. (Note that I´m partly disagreeing with myself, re. comment 34 last review).
What I’m missing in this section is an explanation/justification of which variables are or are not included in the between- and within-population variance components, and methodological/theoretical citations to back this up. And then the effects of the assumptions and decisions on results made should be discussed later on.
>> We rewrote partly this paragraph and hope that it is now clearer (L275 to 289). For Qst calculation, fallowing the reviewer’s comments, we decided to calculated σB as the variance attributable to habitat of origin and σW as the residual variance (or for body mass as the sum of the variance attributable to the residual and to the individual identity). We did not include any broods effects in these models anymore because the variance attributable to the brood is also attributable to the population of origin in our case. These changes did not affect our conclusions. We changes the results in Table 2 and S5. In our opinion, the observer effect should not be included in the between population variance for Pst calculation but could be considered as residual variance in the context of our analysis. This is why we calculated σB as the variance attributable to habitat of origin and σW as the sum of the variance attributable to the observer and to the residual
20. L 285: I think you mean slightly informative priors? Slightly UNinformative means very informative.
>> Yes, we changed the sentence (L292)
21. L 286: I´m surprised you stay with a burn-in of 500 iterations, when running a model of 10 million iterations. Normally the burn-in is more like a third or half of the total iterations. With a thinning of 200, you now discard only the first 2 effective samples, and keep the remaining 50,000 samples. So basically, you have no burn-in period. I propose a burn-in of at least 1 million iterations, unless you know that your chains converge very quickly (in which case you don´t need 10 million iterations, which looks like overkill anyway).
>> We compared models with different burn-in period, iterations and nu and found no important difference between these models and really small autocorrelation (L291 to 297).
22. L 295: maybe this information goes better with line 278?
>> Yes, we agree, we changed the location of the sentence to L283-284.
23. L 331: I still don´t get this result: you state that the two matrices are more similar to each other than two random matrices. This is very unsurprising. And irrelevant. What we want to know is if they are dissimilar, as you claim you will test in L 108. But you don´t do that. I mentioned this before. I think this analysis is not relevant at all – look for an analysis that will tell us if the matrices are identical or not (e.g. if your correlation of 0.9 is different from 1.0, not if it is different from 0.0, but probably random skewers is not the thing to do).
>> This comment is in line with the Editor concern regarding the random skewer method. As explained in our response to the Editor, we have removed this comparison.
24. L 338: extent
>> We removed this part of the sentence
25. L 343: suggests
>> Modified (L343)
26. L 349: replace cannot be for is not
>> Modified (L349)
27. L 351: indicates
>> Modified (L351)
28. L 353: remove genetically
29. L 354: replace cannot for does not
>> Modified (L355)
30. L 355: replace could be for are
>> Modified (L356)
31. L 360: remove genetic
>> Removed
32. L 367: mention here also the significant effects you found for rearing brood, suggesting the acting of such early effects
>> We discuss the rearing brood effects in lines 433 to 443.
33. L 387: or that you removed high Fst neutral ones
>> We now mention this possibility (L387) but we choose to keep it in parenthesis since this issue is not important and not discussed further.
34. L 388: but you should not use microsatellites for Qst-Fst comparisons, see several papers on this by Jost, Edelaar and other authors, in Molecular Ecology (partly cited in Leinonen et al. 2013).
>> Yes, this is why we did not use microsatellites in this study, the microsatellite study is mentioned to discuss the Fst level.
35. L 390: this statement needs to be re-evaluated after checking what SNP filtering does, and whether the Qst calculations are changing based on my comments above.
>> This statement still holds after re-evaluation of the consequences of the filtering.
36. L 397: paper by Dingemanse et al. on predator-presence related population divergence in stickleback personalities also comes to mind (J Anim Ecol?)
>> We added this reference (L398)
37. L 400: studies
>> Modified (L419)
38. L 404: better refer to the Qst values in Table 2?
>> Modified (L404)
39. L 413: I agree, but also mention/discuss if you would expect the traits you used to be correlated in your variance covariance matrix (which they are hardly)
>> As explained in our response to the Editor, we have removed the comparison between the covariance matrices form the manuscript.
40. L 428: again, you tested if they are similar, but you should test if they are different >> This section was removed.
41. L 435: associated with
>> Modified (L431)
42. L 445: remove (2 to 12 days) since this is irrelevant – statistical power is the issue, not the time frame.
>> We agree, we changed the location of the parenthesis in the sentence (L441).
43. L 447: this is the same as your first argument – effectively not sensitive relative to other environmental effects
>> We removed this sentence
44. L 459: again, this may need to be revised depending on any Qst and Pst recalculations. It is kind of strange that divergence is not reduced under a common environment, assuming that any plasticity in the wild would tend to operate in the direction of the divergent selection between habitats. I think this is also the common observation (often even no remaining divergence in a common environment).
>> We meant that the environmental effects might not be very high in the wild otherwise we would have found a Pst significantly different from the Qst. See our response to
previous comments about the filtering.
45. L 463: remove phenotypic
>> Done.
46. L 464: replace L 465-466 by: but that genomically are diverged much less.
>> We prefer the original sentence.
47. L 466: replace past study on by past results for
>> Done (L461).
48. L 470: scales (relative to dispersal ability) for
>> Done (L464).
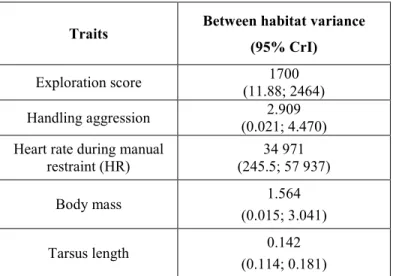
Table S6: for HR and tarsus length, the mean is higher than the credible interval, so this needs to be fixed
>> We corrected this information (Table S5).
Table 1: as far as I´m concerned (and you, as you don´t test its significance), you can remove the info for the intercepts).
Time of day: based on d.f. you fitted a linear effect – have you checked if the effect is actually non-linear?As you have enough data, perhaps fit time as categorical (by hour for example). Same for age. This might change (improve?) your Qst estimates, see L 338.
>> We have only fitted here a linear effects.
1
Abstract
1
Understanding the causes and consequences of population phenotypic divergence is a central goal 2
in ecology and evolution. Phenotypic divergence among populations can result from genetic 3
divergence, phenotypic plasticity or a combination of the two. However, few studies have 4
deciphered these mechanisms for populations geographically close and connected by gene flow, 5
especially in the case of personality traits. In this study, we used a common garden experiment to 6
explore the genetic basis of the phenotypic divergence observed between two blue tit (Cyanistes
7
caeruleus) populations inhabiting contrasting habitats separated by 25 km, for two personality 8
traits (exploration speed and handling aggression), one physiological trait (heart rate during 9
restraint) and two morphological traits (tarsus length and body mass). Blue tit nestlings were 10
removed from their population and raised in a common garden for up to five years. We then 11
compared adult phenotypes between the two populations, as well as trait-specific Qst and Fst. Our 12
results revealed differences between populations similar to those found in the wild, suggesting a 13
genetic divergence for all traits. Qst - Fst comparisons revealed that the traits divergences likely 14
result from dissimilar selection patterns rather than from genetic drift. Our study is one of the 15
first to report a Qst - Fst comparison for personality traits and adds to the growing body of 16
evidence that population genetic divergence is possible at a small scale for a variety of traits 17
including behavioural traits. 18
19
Keywords
20Cyanistes caeruleus, genetic divergence, local adaptation, personality, plasticity, Qst - Fst 21
2
Introduction
23
Understanding the evolutionary causes of phenotypic divergence among populations is an 24
important aspect of the study of diversity. Environmental heterogeneity can have a major role in 25
generating phenotypic divergence among populations (Wang & Bradburd 2014). Spatial variation 26
in selection pressures resulting from such environmental heterogeneity can lead to genotype by 27
environment interactions for fitness and produce phenotypic and genetic divergence between 28
populations that can lead to local adaptations (Kawecki & Ebert 2004; Wang & Bradburd 2014). 29
Spatial heterogeneity in ecological conditions can also favour the evolution of phenotypic 30
plasticity, i.e. the adjustment of individual phenotypes in response to environmental factors 31
(Pigliucci 2005) and cause phenotypic divergence of populations in the absence of genetic 32
divergence or local adaptation (Sultan & Spencer 2002; Réale et al. 2003; Pigliucci 2005). 33
Phenotypic divergence of populations can also be produced by non-random dispersal of 34
individuals between habitat types (Wang & Bradburd 2014). Importantly, phenotypic divergence 35
of populations does not necessarily involve an adaptive process since phenotypic plasticity and 36
non-random dispersal can be non-adaptive (Edelaar & Bolnick 2012; Fitzpatrick 2012; Wang & 37
Bradburd 2014) and can occur in the same or in the opposite direction to genetic divergence 38
(Fitzpatrick 2012). In addition, strong founder effects or genetic drift can also lead to phenotypic 39
and genetic divergence of populations (Slatkin 1987). Establishing the relative importance of 40
environmental versus genetic effects involved in the phenotypic divergence of populations 41
provides fundamental information about the origin of intra-specific diversity in the wild. In 42
addition, determining if this divergence is adaptive or the result of neutral processes is essential 43
because it gives important indications about the eco-evolutionary dynamics of traits and their 44
evolutionary trajectories. 45
3 46
Traditionally, it has been considered that the homogenizing effect of gene flow prevents genetic 47
divergence of populations (Sultan & Spencer 2002; Lenormand 2002). Thus, most research on 48
genetic divergence focused on populations separated by large spatial scales or by important 49
landscape barriers to dispersal (Slatkin 1987; Lenormand 2002). Nevertheless, recent theoretical 50
and empirical studies revealed that even in the presence of gene flow, phenotypic divergence can 51
have a genetic origin when there is strong divergent selection and/or non-random dispersal 52
(Richardson et al. 2014; Wang & Bradburd 2014). Despite growing interest for such isolation by 53
environment, there is little empirical data on the mechanisms underlying the phenotypic 54
divergence of populations separated by small geographic distances and connected by gene flow. 55
56
Behavioural traits have often been considered as highly plastic and thus less prone to genetic 57
divergence. However, several studies are now showing that among-individual differences in 58
behaviour can be repeatable (personality; Réale et al. 2007), heritable (van Oers & Sinn 2011), 59
and related to fitness (Smith & Blumstein 2008) and could thus evolve in response to local 60
conditions. In this context, an increasing number of studies have compared the personality 61
phenotypes of individuals inhabiting contrasted ecological conditions (Bell 2005; Quinn et al. 62
2009; Atwell et al. 2012; Herczeg et al. 2013; Miranda et al. 2013; Karlsson et al. 2016; Jacquin 63
et al. 2016). However, fewer studies have disentangled the role of plasticity from that of genetic 64
effects in shaping phenotypic divergence between populations separated by distances that are 65
within the dispersal ability of a species (Atwell et al. 2012; Miranda et al. 2013). Note that the 66
plastic response to environmental factors can itself have a genetic basis, hence plasticity levels 67
can differ across populations because plasticity can be heritable and evolve differently across 68
populations (e.g. Laurila et al. 2002). 69
4 70
Previously, we have revealed a phenotypic divergence for personality and morphological traits 71
between two wild populations of blue tits (Cyanistes caeruleus) living in contrasting habitats in a 72
Mediterranean landscape (Charmantier et al. 2016; Dubuc-Messier et al. 2017). These 73
populations occupy habitats and valleys dominated by either evergreen (holm oak, Quercus ilex) 74
or deciduous oaks (downy oak, Quercus pubescens) yet are separated only by 25 km, which is 75
within the typical dispersal range of the species (Tufto et al. 2005; Winkel & Frantzen 1991). The 76
dominant tree species in each habitat and valley is suspected to have an important influence on 77
blue tits’ ecological context that translates into phenotypic divergence between populations for 78
numerous types of traits despite a spatial proximity and gene flow among them (Charmantier et 79
al. 2016). For example, blue tits from the evergreen habitat have a higher adult survival 80
probability, a lower body mass, a smaller tarsus length, a higher docility (lower handling 81
aggression), and a slower exploration in a novel environment, compared to birds from the 82
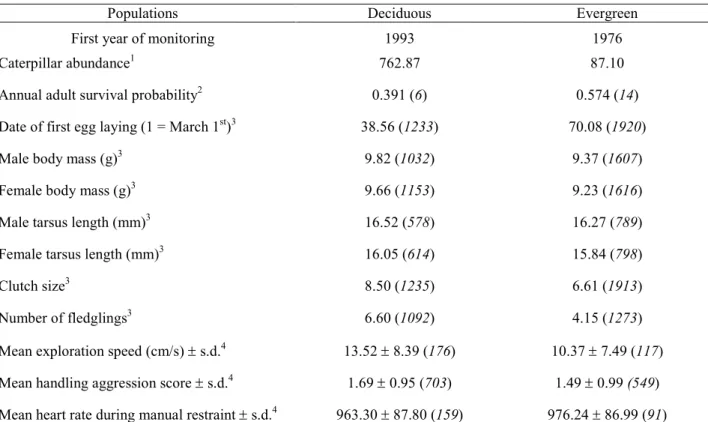
deciduous habitat (Table S1; Grosbois et al. 2006; Charmantier et al. 2016; Dubuc-Messier et al. 83
2017). In addition, past studies in this system revealed that small birds (mass and tarsus length) 84
have a selective advantage in the evergreen habitat (Blondel et al. 2002; Teplitsky et al. 2014), 85
suggesting that at least some of the observed phenotypic divergence between habitats could be 86
adaptive. 87
88
In this study, we used a common garden experiment to assess whether the personality and 89
morphological divergence between these two blue tit populations could have a genetic basis. We 90
collected blue tit nestlings from the evergreen and deciduous habitats and raised them for up to 91
five years in aviaries, subsequently comparing their personality, physiological and morphological 92
phenotypes once adults. Previous experiments in aviaries on this system have found a genetic 93
5 divergence between these habitats for life-history traits (Lambrechts et al. 1997). Based on these 94
results, we hypothesized that the phenotypic divergence found previously in the wild for 95
personality and morphological traits would also reflect a genetic divergence. Therefore, we 96
predicted that, following the common garden experiment, individuals originating from the 97
evergreen habitat would show a slower exploration in the novel environment, a higher docility 98
(lower handling aggression), a smaller tarsus and a lower body mass then individuals originating 99
from the deciduous habitat. We also compared heart rate during manual restraint of birds 100
originating from the two habitats, a physiological measure of stress reaction often used in 101
personality studies (Koolhaas et al. 1999). 102
103
Second, we investigated whether the potential genetic divergence between these habitats could be 104
attributed to different selection pressures or to genetic drift using a Qst - Fst comparison approach 105
(Leinonen et al. 2013). A trait Qst measures the amount of additive genetic variance among 106
populations relative to the total genetic variance in the trait (Leinonen et al. 2013). Fst is the 107
equivalent measure for neutral molecular variance (Weir and Cockerham 1984) and can be used 108
as a null expectation for the degree of population divergence due to genetic drift and gene flow. If 109
Qst > Fst, the trait divergence is higher than the neutral expectation and is likely the result of 110
directional selection favouring local adaptation (Leinonen et al. 2013) rather than the result of 111
drift. The two blue tit populations have very large effective population sizes (roughly estimated 112
around 10,000 in each valley, Perrier et al., genomic work in progress) and have been found 113
weakly genetically differentiated (Szulkin et al. 2016). Consequently, it is unlikely that any 114
genetic divergence for these traits would be produced by genetic drift. We considered that, 115
because birds were raised in a common garden, a phenotypic difference among individuals was a 116
realistic approximation of an additive genetic effect. We thus used the phenotype of the common 117
6 garden birds to calculate the Qst and predicted that the Qst of each trait would significantly exceed 118
the Fst estimated between both populations. In addition, in order to better understand the 119
importance of environmental factors in shaping the observed phenotypic differentiation in the 120
wild, we compared the genetic differentiation (Qst) of birds from the common garden experiment 121
with the phenotypic differentiation of wild birds for the same traits (Pst ; the amount of 122
phenotypic variance among wild populations relative to the total phenotypic variance in the trait). 123
124
Materials and Methods
125The population located in the evergreen habitat (Evergreen-Pirio) is in the Corsican Fango valley 126
(42°34’N, 08°44’E; 200m elevation) and contains 205 nest-boxes distributed across two study 127
plots. The population located in the deciduous habitat (Deciduous-Muro) is in the Corsican 128
Regino valley (42°32’N, 08°55’E, 350 m elevation) and contains 110 nest-boxes distributed 129
across three study plots. A weekly to daily monitoring over the course of the breeding season 130
(from early April to the end of June) allowed the recording of exact laying dates and hatching 131
dates for all broods established in nest boxes. 132
133
Nestlings were collected for the common garden experiment at 7 to 12 days of age and were 134
brought to the Netherlands Institute of Ecology (NIOO-KNAW, Wageningen, Netherlands) 135
where they were hand raised under standardized conditions. We used 169 blue tits that were 136
collected in 2010 and 2011 in the deciduous habitat (2010: 42 birds, 7 broods; 2011: 39 birds, 6 137
broods) and in the evergreen habitat (2010: 44 birds, 10 broods; 2011: 44 birds, 8 broods). In 138
2010, before collecting chicks, broods were cross-fostered between nests for another experiment. 139
7 For this experiment, at 2 to 4 days old, half of the chicks from a given brood were exchanged 140
with half of the chicks of another brood from the same population. 141
142
Once collected, all birds were transported by car and hand-fed from Corsica to the Netherlands, 143
and were hand reared until independence as described in Reparaz et al. (2014). Briefly, all the 144
chicks from a given habitat and year were kept in boxes divided into multiple compartments that 145
were not isolated from one another, each compartment containing one nest of 3 to 5 nestlings, 146
until fledgling. Chicks from adjacent nests could easily change compartment, meaning that chicks 147
from different nests were quickly mixed. After fledgling, birds were housed in cages in groups of 148
2 to 4 birds, irrespective of their sex and nest of origin (assigned randomly). Up to that period, 149
chicks were fed every half-hour, 14 hours per day (7:00 am - 9:00 pm), with a diet consisting of a 150
mixture of curd cheese, ground beef heart, baby cereal, multivitamin solution and calcium 151
carbonate, supplemented with wax moth larvae and bee larvae, until independence. Raising
152
chicks from the different habitats at exactly the same time would have been ideal but was
153
impossible because chicks in the Regino and the Fango valleys hatch one month apart. However,
154
chicks from different nests and habitats could easily see and hear each other, as they were raised
155
in the same rooms, and fledglings from the Regino valley were still present in the cages when the
156
younger chicks from the Fango valley arrived in the laboratory. Caretakers were the same for
157
birds of different origins.
158 159
At independence, about 35 days after hatching, birds were relocated to larger individual cages or 160
aviaries. Food and water were provided ad libitum. In 2012 and 2015, birds were moved to the 161
Centre d'Écologie Fonctionnelle et Évolutive (CEFE-CNRS; Montpellier, France), where they 162
were kept in outdoor aviaries before being released back into their natal habitat in Corsica. 163
8 Morphological measurements were taken during the period at the NIOO-KNAW. Tarsus length 164
was measured once (at > 1 year of age) but body mass was measured several times, always by the 165
same person. We were interested in testing for a difference in adult body mass and thus kept in 166
the analysis only the measures made at one year of age and older. 167
168
Behavioural and physiological trials 169
In total, 169 birds were tested for their exploration behaviour and, among these birds, 137 were 170
tested for handling aggression and 57 for heart rate. All behavioural and physiological traits were 171
measured once for each bird, which prevented us from reporting their repeatability. However, 172
these behavioural and physiological traits have been shown to be repeatable in these two 173
populations in the wild, with repeatability estimates ranging from 0.26 to 0.75 depending on the 174
trait (see Dubuc-Messier et al. 2017 for details). In the present study, exploration behaviour was 175
measured using a different protocol (see below) than the one used in the wild (Dubuc-Messier et 176
al. 2017). Nevertheless, we are confident that the exploration behaviour measured here represents 177
repeatable characteristics of the individuals because this measure has been shown to be repeatable 178
in blue tits in several studies using different protocols (Kluen & Brommer 2013; Mutzel et al. 179
2013; Dubuc-Messier et al. 2017). For details regarding the phenotyping of wild birds used in the 180
Pst calculations, please refer to Dubuc-Messier et al. (2017). 181
182
Exploration behaviour 183
Exploration behaviour trials were done in fall 2011 in the Netherlands Institute of Ecology as 184
described by Reparaz et al. (2014) and using a novel environment chamber slightly modified 185
from Drent et al. (2003). The novel environment chamber consisted of a 4.0 x 2.4 x 2.5m room 186
with five artificial trees. Individuals were placed in cages adjacent to the main chamber 30 to 120 187
9 minutes before the trials and introduced in the main chamber through a sliding door. For two 188
minutes, the observer counted the number of movements between trees and the number of small 189
jumps on a given tree / branch. Exploration scores was the sum of both and varied from 10 (a 190
very slow exploration pattern) to 92 (a very fast exploration pattern; Reparaz et al. 2014). 191
192
Handling aggression 193
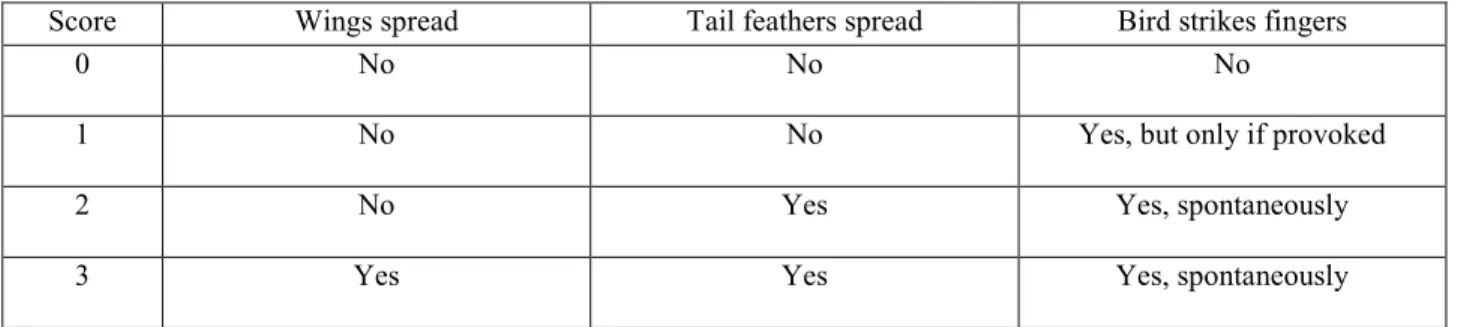
Handling aggression was measured assessing the bird’s aggression towards a manipulator 194
(Dubuc-Messier et al. 2017). We used a score ranging from 0 to 3. A score of 0 was the lowest 195
aggression score (no reaction; high docility) and 3 the highest (see Table S2 for detailed protocol). 196
Handling aggression was recorded in 2012 and 2015 at the CEFE-CNRS (France). Birds from the 197
2010 cohort were tested for handling aggression in 2012 or 2015 (at 2 or 5 years of age), while 198
the entire cohort from 2011 was tested for handling aggression in 2015 (at 4 years of age). 199
Handling aggression score was assessed blindly with respect to habitat of origin in 2015 and was 200
assessed by two different observers, one in 2012 and one in 2015. 201
202
Heart rate during manual restraint 203
Heart rate was recorded in 2012 at the CEFE-CNRS (for the 2010 cohort only), as described by 204
Dubuc-Messier et al. (2017). Within a few minutes after capture, we recorded heart rate for 30 205
seconds using a digital recorder. We used the software Avisoft SASLab Pro version 5.1 to extract 206
the mean time interval (sec) between two heartbeats using approximately 100 consecutive 207
heartbeats per individual. 208
10 Molecular markers and Fst calculation
210
For logistical reasons, we were not able to perform a molecular analysis on the birds used in the 211
common garden experiment. As an alternative, we used a dataset, published by Szulkin et al. 212
(2016) of wild birds from these two populations (i.e. deciduous, n = 49; evergreen, n = 83 213
individuals) and genotyped at several thousand SNP using RAD-sequencing. We retained loci 214
genotyped over at least 75% of the individuals. To avoid bias during filtering and in the Fst 215
estimates, we pruned highly related individuals from the dataset to keep only individuals linked 216
with values of kinship lower than 0.05 (coefficient of Loiselle; Loiselle et al. 1995; Cheverud 217
1996) computed in Genodive 2.27 (Meirmans & Van Tienderen 2004). In order to retain loci 218
more likely to be informative, we applied a 5% MAF threshold (Minor Allele Frequency, using 219
vcftools0.1.11; Danecek et al. 2011). We pruned the dataset for SNPs that deviated from Hardy-220
Weinberg-Equilibrium in at least one of the two populations (p-value < 0.05) using vcftools 221
0.1.11. We retained only the first SNP of each 100 bp locus. To obtain a set of SNPs more likely 222
to be neutral, we filtered out SNPs potentially under divergent selection between the two habitats 223
(p-value < 0.015; 0.7 % of total SNPs removed). This was done with a Bayescan 2.0 test (Foll & 224
Gaggiotti 2008; 5 000 pilot iterations, 50 000 burnin, prior odds of 100). Average Fst and 95% 225
confidence intervals were estimated using the R-package hierfstat 0.04-22 (Goudet 2005). The 226
final dataset contained 69 individuals (32 and 37 individuals in the deciduous and evergreen 227
habitats, respectively) genotyped at 5407 SNPs. 228
229
Statistical analysis 230
Genetic divergence between habitats of origin 231
We tested for a genetic difference between the two habitats for each trait with univariate linear 232
mixed-models using the phenotype of each bird as a response variable and habitat of origin, sex, 233
11 and their interaction as fixed effects. When we found a significant interaction between habitat of 234
origin and sex, we ran a separate model for each sex. Specific confounding variables were added 235
as fixed effects for each particular trait. For exploration score, we added a cohort term as fixed 236
effect to test for any environmental effect early in life or during the hand-rearing period in 237
captivity. Novel environment tests were done on the two cohorts at the same time (in autumn 238
2011). Thus, at the time of the test, individuals born in 2010 were almost 1½ years old, while 239
individuals born in 2011 were 5 months old. Hence, in this model, the cohort term controlled for 240
the combined effect of cohort and age. For handling aggression score, we added cohort, time of 241
day (hour), and year of test (2012 or 2015) as fixed effects. For heart rate models, we added as 242
fixed effect mean individual adult body mass because heart rate is related to the metabolic rate 243
and both are positively related to body mass (Green et al. 2011). Heart rate recordings were done 244
in 2012 on the 2010 cohort only. We therefore did not add a fixed effect for bird age, cohort or 245
year to avoid redundancy. We also added in heart rate models the time of day (hour) as a fixed 246
effect. For body mass, we added age as a continuous variable, cohort, and time of day (hour). For 247
tarsus length, we added cohort only as fixed effect (i.e. 2010 and 2011). 248
249
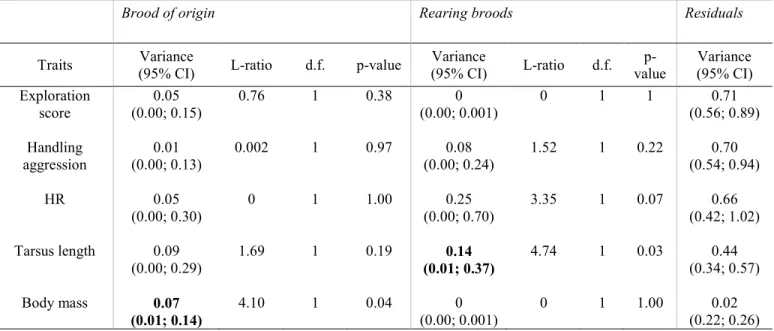
In all models, we used random intercepts for the brood of origin and rearing brood to account for 250
the non-independence of birds coming from the same brood or / and the effect of foster parents 251
for nestlings that have been cross-fostered prior to the captivity period. Because body mass was 252
measured several times for each bird, we also added a random intercept for bird identity for this 253
trait. 254
255
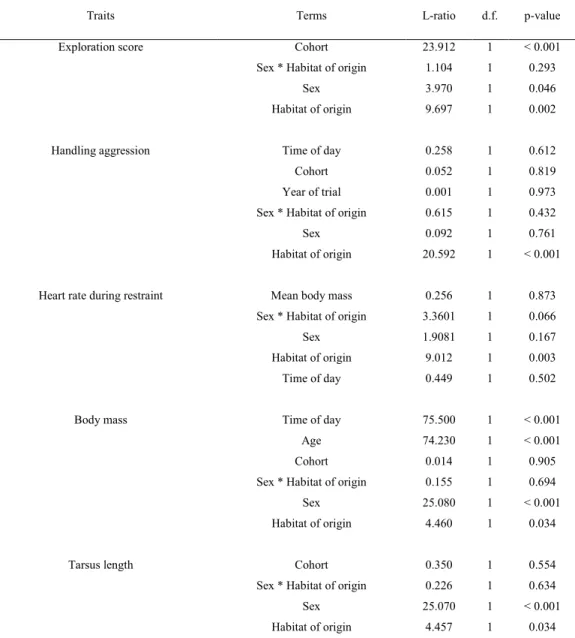
All response variables were Z-transformed prior to analyses. We tested the significance of the 256
fixed effects and selected a minimal models by LRT (log likelihood ratio test) in a stepwise 257
12 elimination procedure starting with a model that included all variables (Bates et al. 2014). We 258
kept all the random effects in final minimal models. We present in Table S3 the L-ratios and p-259
values associated with all variables in initial models. Analyses were done with R (R Core Team 260
2017) using the function lmer of the package lme4 (Bates et al. 2015). Confidence intervals 261
(95%) were generated with the function confint.merMod (lme4). We assumed a Gaussian 262
distribution for all traits, which was confirmed after visual inspection of the residuals. We also 263
evaluated the population of origin effect across all five traits using Fisher’s combined probability 264
test run with the sumlog function of the R package metap (Dewey 2017). 265
266
Qst, Pst and Fst comparison 267
Because birds were raised in a common garden, we considered that a phenotypic difference 268
among individuals was a realistic approximation of an additive genetic effect. For each trait, we 269
thus calculated the Qst between the two habitats based on the phenotypes of birds from the 270
common garden using a procedure similar to Bertrand et al. (2016) with univariate mixed models 271
in a Bayesian framework. We calculated Qst as: 272
273
Qst = σB / (σB + 2*σW) 274
275
Where σB is the between-habitat phenotypic variance and σW the within-habitat variance (or 276
residual; Wright 1949). The two variance components were extracted from a univariate linear 277
mixed model including habitat of origin (and identity of the bird for body mass) as random 278
intercepts. We also included the fixed effects structure selected previously (minimal model) 279
excluding the term habitat of origin. We calculated σB as the variance attributable to the habitat 280
13 of origin and σW as the residual variance (or for body mass as the sum of the variance attributable 281
to the residual and to the individual identity; Bertrand et al. 2016). We did not include any broods 282
effects in these models because the variance attributable to the brood is also attributable to the 283
population of origin. We present the between-habitat variance for each study trait extracted from 284
the models used to calculate Qst in Table S5. We calculated Pst as Qst but used as random 285
intercepts habitat of origin, the identity of the bird and the observer identity (for handling 286
aggression and heart rate) along with the significant fixed effects detailed in Dubuc-Messier et al. 287
(2017). For Pst calculation, we calculated σB as the variance attributable to habitat of origin and 288
σW as the sum of the variance attributable to the observer, to the residual variance and the 289
individual identity. 290
291
These models were performed with MCMCglmm package (Hadfield 2010) in R using slightly 292
informative priors (i.e. V = VP / n, nu = 1 or 0.5; VP is the total phenotypic variance of the trait 293
and n the number of random effects), 10 million iterations, a thinning of 200 and a burn-in phase 294
of 500. Because the results of the models with different nu were similar, we used the posterior 295
distribution of models with nu = 1 in Qst and Pst calculations. We assessed the presence of 296
autocorrelation with the function autocorr (MCMCglmm package). All models showed an 297
autocorrelation less than 10-4. We checked for model convergence with the function gewe.diag of 298
the coda package (Plummer et al. 2006). For all traits, we calculated the ratio Qst / mean Fst for 299
each sample of the posterior distribution and report the posterior mode of the ratio and its 95% 300
credibility intervals (calculated using the HPDinterval function of the package lme4). We 301
assumed that Qst differed significantly from Fst when the credibility interval around the ratio did 302
not include one. 303
14 304
Results
305Divergence between habitats of origin 306
The Fisher combined probability test method on all studied traits indicated an overall significant 307
effect of the habitat of origin (chi-squared : 54.647, df =10 and p-value < 0.001). Below we 308
present the results for each trait separately. 309
310
Behavioural and physiological traits 311
For birds in the common garden experiment, habitat of origin had a significant effect on the two 312
behavioural traits: blue tits from the deciduous habitat were faster explorers and were more 313
aggressive to the handler (Table 1; Fig. 1). Birds from the deciduous habitat had a lower heart 314
rate than birds from the evergreen habitat (Table 1; Fig. 1). We found a trend for an interaction 315
between habitat of origin and sex for heart rate (L-ratio = 3.360, d.f. = 1, p-value = 0.067): 316
evergreen males had a higher heart rate than deciduous males [estimate = 1.24 (95% CI: 0.31; 317
2.17), L-ratio = 6.260, d.f. = 1, p-value = 0.010] but there was no habitat of origin effect for 318
females (L-ratio = 2.150, d.f. = 1, p-value = 0.142). There was no interaction between sex and 319
habitat of origin for the two behavioural traits, but there was a difference in exploration score 320
between sexes (Table 1). 321
322
Morphological traits 323
Habitat of origin also had a significant effect on the two morphological traits: deciduous birds 324
were heavier and had a longer tarsus than evergreen birds (Table 1; Fig. 1). We did not find any 325
interaction between habitat of origin and sex for these two traits (tarsus length: L-ratio = 0.226, 326
15 d.f. = 1, p-value = 0.634; body mass: L-ratio = 0.155, d.f. = 1, p-value = 0.694). Among-327
individual differences in body mass were significant and represented 45% of the total variance of 328
the trait [variance = 0.34 (95% CI: 0.26; 0.46), L-ratio = 421.95, p-value < 0.001]. 329
330
Brood effects 331
Differences among broods of origin explained a significant portion (78%) of the total phenotypic 332
variance in body mass, but not for the other traits (Table S4). Differences among rearing broods 333
explained a significant portion of the total variance in tarsus length (22%) and a marginally 334
significant portion of total variance in heart rate (30%, p-value = 0.07) but not for the other traits. 335
336
Qst, Pst and Fst comparison 337
We found a significant but small genetic differentiation between the two populations [mean Fst 338
over all loci = 0.004 (95% CrI: 0.003; 0.005), p-value < 0.001]. Qst was higher than Fst with non-339
overlapping intervals for all traits. The ratio between the Qst and Fst was significantly greater than 340
one for all traits. Credibility intervals for Qst and Pst overlapped for all traits (Table 2). 341
342
Discussion
343Our common garden experiment suggests a genetic divergence in personality, physiological and 344
morphological traits between two blue tit populations inhabiting contrasted habitats separated by 345
a small spatial distance in regards to the species dispersal capacity. Adult blue tits originating 346
from the evergreen habitat displayed slower exploration behaviour, lower handling aggression 347
(higher docility), faster heart rate, lower body mass and shorter tarsus compared to birds from the 348
deciduous habitat (Table 1; Fig. 1). These differences are similar to the ones measured in the wild 349
16 suggesting that plasticity alone is not responsible for the observed phenotypic divergence in the 350
wild (Charmantier et al. 2016; Dubuc-Messier et al. 2017). In addition, we found a significant Fst 351
between the two populations, but its low value (0.004) indicates current or past gene flow, in 352
concordance with previous findings (Szulkin et al. 2016). The Qst - Fst comparisons revealed that 353
blue tits from these populations are more differentiated for personality, physiological and 354
morphological traits then they are at the genome-wide level (Table 2). These results suggest that 355
genetic drift alone does not explain the observed divergence between the two populations and 356
that differences in selection regimes are responsible for this divergence. 357
358
The divergence we describe in personality, physiological and morphological traits is likely to be 359
mainly of genetic origin, since birds from both habitats were raised in identical conditions from 360
their first week of life to up to five years. In addition, the divergence found in this study for adult 361
body size is consistent with previous studies that have found divergent selection between the two 362
populations for morphological traits (Blondel et al. 2002; Teplitsky et al. 2014) and moderate to 363
high heritability for these traits (0.29 to 0.51; Teplitsky et al. 2014). However, we cannot 364
completely exclude that early environmental effects such as non genetic inheritance, occurring 365
before the chicks were sampled from their nest were at least partly responsible for the observed 366
patterns (Kruuk & Hadfield 2007; Räsänen et al. 2007; Bonduriansky&Day 2009; Bouwhuis et 367
al. 2010; van Oers et al. 2015). Such early environmental effects might be particularly important 368
for tarsus length, which is usually fixed at fifteen days of age for this species. However, for 369
behavioural traits, such strong environmental effects lasting for up to five years are unlikely, 370
since very few studies have reported long-term consequences of early environmental conditions 371
for the studied traits (Taylor et al. 2012; Petelle et al. 2015) and because maternal effects are 372
known to decrease during ontogeny (Cheverud et al. 1983; Wilson et al. 2007). One way to 373
17 control for very early environmental effects would be to allow the birds to breed in captivity and 374
compare the phenotypes in the offspring generation. However, this type of experiment presents 375
significant challenges that have so far prevented their feasibility in our study system. In 376
particular, while it is possible to maintain blue tits in aviaries for short time experiments (Reparaz 377
et al. 2014) it is difficult to make them breed in captivity (Lambrechts et al. 1999). 378
379
Some studies have raised concerns regarding Qst and Fst estimation and their comparison 380
(Leinonen et al. 2013). In particular between-population variance and thus Qst estimation may be 381
imprecise when a small number of populations are compared like it is the case in our study 382
(O’Hara and Mërila 2005; Leinonen et al. 2013). However, simulations have shown that a small 383
number of populations results in a downward bias in Qst estimation when Qst is high (O’Hara and 384
Mërila 2005). Another important concern is whether genetic markers involved in Fst estimation 385
are truly neutral (Leinonen et al. 2013). In this study, we used an Fst calculated from markers that 386
included the whole genome. Although we filtered SNPs under potential divergent selection, it is 387
possible that we included potentially non-neutral regions (or that we removed some neutral ones). 388
However, using microsatellites, Porlier et al. (2012) have found a lower Fst (0.001) between the 389
same populations during a similar time period (year 2009). Hence, although Qst and Fst 390
comparison have some limitations, these limitations should most probably have limited our 391
capacity to detect significant Qst - Fst differences rather than reveal false differences. 392
393
Environmental heterogeneity, divergent selection and local adaptations 394
The importance of environmental heterogeneity and gene flow for phenotypic divergence has 395
mainly been studied for life history and morphological traits and much less for behavioural traits. 396
Indeed, few studies have disentangled so far the role of plasticity from that of genetic differences 397
18 in shaping the phenotypic divergence of populations for behavioural traits (Bell 2005; 398
Dingemanse et al. 2007; Herczeg et al. 2013; Karlsson et al. 2016; Jacquin et al. 2016) and even 399
fewer for highly mobile avian species (Atwell et al. 2012; Miranda et al. 2013). In addition, to 400
our knowledge, no studies has until now reported Qst - Fst comparisons involving personality 401
traits. This shortage of study is probably due to the fact that personality traits are often considered 402
plastic and thus less prone to genetic divergence and local adaptations than morphological traits. 403
Yet, the results of our study suggest a genetic divergence for personality traits and that this 404
divergence could be as strong as for morphological traits (Table 1 and 2). 405
406
Past studies in this system and on personality variation suggest that the genetic divergence found 407
here could be the result of the coevolution of multiple types of traits in response to the ecological 408
context of each habitat. Indeed, an increasing number of studies are suggesting that life-history 409
and personality traits could have co-evolved to form a pace-of-life syndrome (Réale et al. 2010). 410
For example, empirical and theoretical studies are suggesting that high investment in early 411
reproduction at a cost of reduced residual reproductive value (either via survival or future 412
reproduction) should be associated with boldness, fast exploration, and high aggressiveness 413
(Réale et al. 2010; Wolf et al. 2007). Our results on this system are consistent with the pace-of-414
life syndrome hypothesis. Blue tits from the deciduous habitat, which are more aggressive and 415
faster explorers, have a shorter lifespan and a lower residual reproductive value, but larger clutch 416
sizes than birds from the evergreen habitat (Grosbois et al. 2006; Charmantier et al. 2016; 417
Dubuc-Messier et al. 2017; Table S1). Our results suggest that these divergences for personality 418
traits are genetic and the Qst - Fst comparisons revealed that they are likely the result of divergent 419
selection pressures rather than drift. In addition, studies on other blue tit or great tit (Parus major) 420
populations have found that the personality phenotype is heritable and related to fitness (van Oers 421
19 & Sinn 2011; Class et al. 2014). Therefore, taken together, our results suggest that the personality 422
phenotypes of birds living in these habitats could have evolved and be implicated in blue tit 423
adaptation to local ecological conditions prevailing in each habitat. 424
425
Brood effects 426
We did not find any significant brood-of-origin effect for handling aggression, exploration score, 427
heart rate, and tarsus length. Since all these traits except heart rate have been shown to be 428
heritable in previous studies on blue tits (van Oers & Sinn 2011; Class et al. 2014; Teplitsky et al. 429
2014), the absence of heritable variance in our analysis is most probably explained by the 430
relatively small number of broods. Estimating heritability was not the goal of this study, we only 431
wanted to control for dependence issues associated with the use of sibs. 432
433
The partial cross-fostering manipulation before the common garden experiment revealed a 434
significant rearing brood effect for tarsus length. This result suggests that the rearing environment 435
between 2 days to 12 days old can have a significant impact on this morphological trait. 436
Contrarily to the other traits that are more labile, tarsus length generally stabilises at fifteen days 437
of age in blue tits. We were, therefore, able to capture the early environmental effect for this trait 438
by measuring the adult phenotype. We found a marginally significant brood of rearing effect for 439
heart rate but not for other traits. There may be several reasons for such results. First, these traits 440
may not be sensitive to the rearing environment. Second, it is possible that - as for brood of origin 441
– these traits are slightly sensitive to early environmental effect (2 to 12 days) but that we lack 442
power to detect it. 443
20 444
Genetic and environmental effects are not mutually exclusive 445
Genetic divergence does not preclude a plastic response to ecological conditions specific to each 446
habitat. For example, in the wild, the phenotypic difference in male heart rate between habitats 447
was not significant (Dubuc-Messier et al. 2017), but using the common garden experiment we 448
found here a significant difference in male heart rate. It is thus possible that plastic responses of 449
heart rate to habitat specific ecological conditions in the wild may have hidden the genetic 450
divergence (Conover & Schultz 1995). In addition, the important temporal variation in mean 451
handling aggression in the wild shown by Dubuc-Messier et al. (2017) in each population, 452
suggests that individuals can partly adjust their personality phenotype for this trait depending on 453
the current local conditions. However, for all traits, the Pst between wild birds was not 454
statistically different from their Qst, suggesting that environmental effects in the wild might not 455
result in stronger or weaker differentiation compared to the genetic differentiation. 456
457
Conclusion 458
Our study suggests a genetic divergence for personality, physiological and morphological traits 459
between two blue tit populations that occupy different habitats but that are separated by small 460
spatial distances compared to the dispersal ability of the species and connected by gene flow. The 461
present study and past results for this system suggest that these differences are likely due to 462
different selection pressures and may represent local adaptations. These results thus emphasize 463
the role of environmental heterogeneity for intra-specific phenotypic diversity and suggest that 464
genetic population divergence is possible at small spatial scales (relative to their dispersal ability)
465
for behavioural traits. 466