HAL Id: hal-01810090
https://hal.archives-ouvertes.fr/hal-01810090v2
Submitted on 18 Sep 2018
HAL is a multi-disciplinary open access
archive for the deposit and dissemination of sci-entific research documents, whether they are pub-lished or not. The documents may come from teaching and research institutions in France or abroad, or from public or private research centers.
L’archive ouverte pluridisciplinaire HAL, est destinée au dépôt et à la diffusion de documents scientifiques de niveau recherche, publiés ou non, émanant des établissements d’enseignement et de recherche français ou étrangers, des laboratoires publics ou privés.
Atmospheric particle-bound organophosphate ester
flame retardants and plasticizers in a North African
Mediterranean coastal city (Bizerte, Tunisia)
Javier Castro-Jiménez, Badreddine Barhoumi, Marc Tedetti, Richard Sempere
To cite this version:
Javier Castro-Jiménez, Badreddine Barhoumi, Marc Tedetti, Richard Sempere. Atmospheric particle-bound organophosphate ester flame retardants and plasticizers in a North African Mediterranean coastal city (Bizerte, Tunisia). Science of the Total Environment, Elsevier, 2018, 642, pp.383-393. �10.1016/j.scitotenv.2018.06.010�. �hal-01810090v2�
Atmospheric particle-bound organophosphate ester flame retardants and 1
plasticizers in a North African Mediterranean coastal city (Bizerte, Tunisia) 2
3
Javier Castro-Jiménez* and Richard Sempéré 4
Aix Marseille Univ., University of Toulon, CNRS, IRD, Mediterranean Institute of 5
Oceanography (MIO) UM 110, Marseille, France. 6
*Corresponding author. Phone: +33(0)486090524; 7 E-mail: javier.castro-jimenez@mio.osupytheas.fr 8 9 https://doi.org/10.1016/j.scitotenv.2018.06.010 10 11
Abstract 12
Organophosphate ester (OPE) flame retardants and plasticizers have been detected at 13
generally high frequencies (70-98%) for the first time in the atmosphere over the NW 14
African coastal Mediterranean. Results from sixty air samples (total suspended 15
particles, TSP) collected between March 2015 and January 2016 in an urban coastal site 16
(Bizerte, Tunisia) revealed ∑9OPE concentrations of ~100-1060 pg m-3 (470 pg m-3, 17
median) with TCPPs, EHDPP and TiBP exhibiting the higher median concentrations (~ 18
110, 100 and 85 pg m-3, respectively). Spring generally exhibited the lowest 19
concentrations, probably linked to the influence of local meteorological conditions and 20
air mass trajectories to a lesser extent. Non-chlorinated OPEs generally predominated, 21
in contrast to the most common reported situation in marine environments (i.e. higher 22
abundance of chlorinated OPEs) pointing to the relevance of local OPE sources in the 23
study area. TiBP levels were generally higher than those reported for other 24
marine/coastal environments suggesting this OPE as a good tracer of local sources in 25
Bizerte. Contrarily, the atmospheric levels of other abundant OPEs in the area (e.g. 26
TCPP) seem to be in the range and/or lower than those reported for remote marine 27
environments. These findings point to the interplay of different factors with solar 28
irradiance (potentially enhancing atmospheric photochemical oxidation reactions) and 29
meteorological conditions in the study area likely compensating potential local sources 30
of some OPEs. Not all OPEs presented the same seasonality in terms of atmospheric 31
concentrations and pattern. The estimated atmospheric dry deposition fluxes (Σ9OPEs) 32
were 18-180 ng m-2 d-1. Up to ~9 kg y-1 of OPEs (~1 kg y-1 of new organic 33
anthropogenic phosphorus coming from OPEs) can be loaded to the shallow and 34
enclosed Bizerte lagoon (~130 km2), considered as the most important aquaculture area 35
in Tunisia, with yet unknown implications for the environmental exposure and impacts 36
in the ecosystem functioning. 37
Keywords: 38
OPEs, plastic additives, marine pollution, dry deposition, environmental risk, 39
anthropogenic organic phosphorus 40 41 Graphical Abstract 42 43 44 45 46 47 48 49 50 51 52
Dry deposition:
~ 9 Kg y
-1OPEs
1. Introduction 53
54
There is no doubt today about the multi-media global scale occurrence of 55
organophosphate esters (OPEs) flame retardants and plasticizers in the marine 56
environment. OPE have been found in air, water, sediment and aquatic organisms from 57
different marine areas of the world (Zhong et al., 2017; Wei et al., 2015; Brandsma et 58
al., 2015; Castro- Jiménez et al., 2014; Van der Veen and de Boer, 2012, Bollmann et 59
al., 2012; Möller et al., 2011; Kim et al., 2011), including remote environments such as 60
the Arctic (Ma et al., 2017; ., 2016a; Hallanger et al., 2015; Salamova et 61
al., 2014a, Möller et al., 2012) and the most pristine areas from the tropical and 62
subtropical Atlantic, Pacific and Indian oceans (Castro-Jiménez et al., 2016). In 63
addition, most recent reports point to their environmental persistency, bioaccumulation 64
and adverse effects in aquatic organisms and humans (ECHA 2008; 2009; Van der Veen 65
and de Boer, 2012; Wei et al., 2015; Wang et al., 2015a,b). These findings have raised 66
awareness on their environmental fate and impacts as it already happened in the past for 67
other persistent organic pollutants (POPs). However, the magnitude and spatial 68
distribution of OPE sources in the environment are closely linked to the recent 69
changes/developments in international regulations, with an important expanding 70
production and usage of OPEs from 2009 as a result of the global ban of their 71
“p d c sso s” polybrominated diphenyl ethers (PBDEs) (UNEP 2009). 72
73
OPE atmospheric levels in remote areas, supposedly far from sources seem to be in 74
many occasions within the range of levels measured in coastal areas close to suspected 75
sources, suggesting complex atmospheric circulation patterns and different 76
environmental processing and dynamics linked to geographic regions (Castro-Jiménez 77
et al., 2016; Li et al., 2018). It is, therefore, crucial to better investigate the airborne 78
occurrence and loadings of OPEs to marine/coastal environments in close relation to 79
their potential impacts. A recent study performed in the Mediterranean Sea supports the 80
hypothesis that atmospheric aerosols can elicit a number of toxic effects in marine 81
organisms due to the presence of legacy POPs such polychlorinated dibenzo-p-dioxins 82
and dibenzofurans (PCDD/Fs), polychlorinated biphenyls (PCBs) and high molecular 83
weight (HMW) polycyclic aromatic hydrocarbons (PAHs) (Mesquita et al., 2016). 84
Other POPs with recognized toxicity too, such as PBDEs and the “ m ” OPEs, can 85
dd up o “co m - oso cock ” (De wit, 2002; Vonderheidea et al., 2008). 86
OPEs have been reported in both the atmospheric particle and gaseous phases, but most 87
of the studies focus on their particle phase occurrence. The atmospheric degradation 88
processes (e.g. photodegradation and/or OH radical oxidation) will progress more 89
slowly for particle-bou d OPEs s y w b “s d”, increasing therefore their 90
long-range atmospheric transport (LRAT) potential (Liu et al., 2014). In addition, OPEs 91
have been described to be enriched in both fine and coarse particles from the 92
atmospheric aerosols in urban environments (Clark et al., 2017; Faiz et al., 2018). 93
The Mediterranean Sea is a semi-enclosed environment of high ecological and socio-94
economic relevance (The Mermex group, 2011). This ecosystem has been documented 95
to be largely impacted by legacy POPs and other organic contaminants (Paluselli et al., 96
2018; The Mermex group 2011; Berrojalbiz et al., 2011, 2011b, 2014; Castro-Jiménez 97
et al., 2008, 2010, 2012; Mandalakis et al., 2005) as well as by plastic fragments (Cózar 98
et al., 2015; Schmidt et al., 2018), which may be potential sources of OPEs to the 99
overlying atmosphere in accumulation zones (Cheng et al., 2013). However, few data 100
exist on OPE baseline levels and environmental behaviour in the Mediterranean Sea. 101
Only one study reported surface water and sediment OPE concentrations from rivers 102
draining into the W Mediterranean (Cristale et al., 2013), and the wide-spread OPE 103
atmospheric occurrence and inputs to surface waters far from the coast was only 104
recently proved (Castro-Jiménez et al., 2014). Coastal measurements of OPEs of any 105
kind are very scarce in the Mediterranean Sea, in particular in the African 106
Mediterranean coast, where even less data on the occurrence of toxic organic 107
contaminants are available. 108
The objectives of this work are: 1) to investigate for the first time the atmospheric 109
occurrence of OPEs in the NW African Mediterranean coast; 2) to estimate their 110
atmospheric dry deposition and loading in Bizerte area (Tunisia) and discuss their 111
potential impacts. 112
113
2. Materials and Methods 114
115
2.1. Area description 116
117
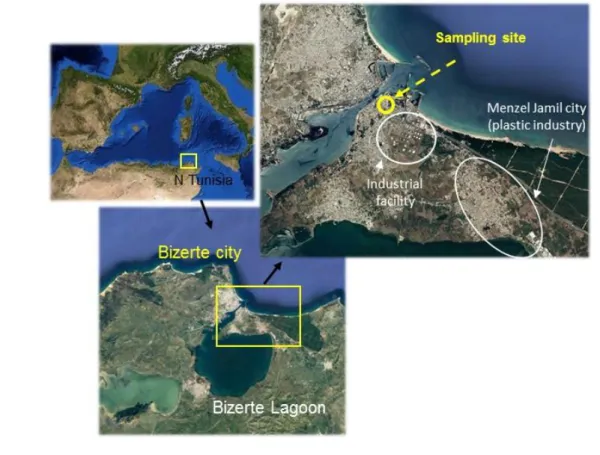
A detailed area description is offered elsewhere (Barhoumi et al., 2018). Briefly, Bizerte 118
is a medium-size city (~127 000 inhabitants), located in the north of Tunisia, between 119
the Mediterranean Sea and the Bizerte lagoon (Figure 1). Average temperature of 22 °C, 120
with hot summer and mild spring, frequent (200 days per year) NW winds (average 121
speed of 6–8 m s-1) and precipitation episodes mostly in autumn and winter months, 122
characterized the climate of Bizerte area. Even if agriculture and fishery activities are 123
important in the area, a considerable number of light and heavy industries (i.e., cement, 124
plastic, textile, mechanic and electronic, iron and steel metallurgy, petroleum refining 125
and lubricants) are present (Barhoumi et al., 2018) inducing a considerable 126
anthropogenic pressure. A certain number of studies focusing on the atmospheric 127
pollution by legacy organic contaminants, like PAHs, PCBs and OCPs, have been 128
performed in the study area (Ben Hassine et al., 2014, Barhoumi et al., 2018). More 129
recent measurements report on dioxin-like POPs, including PCDD/Fs and DL-PCBs and 130
also on PBDEs (Castro-Jiménez et al., 2017) but alternative flame retardants like OPEs 131
have never been studied to the best of our knowledge (nor in the whole NW African 132
coastal Mediterranean). 133
134
135
Figure 1. Sampling site location (Bizerte, Tunisia) 136
137
2.2. Sampling strategy 138
139
Integrated (48 h) aerosol samples (total suspended particles, TSP) were collected from 140
March 2015 to January 2016 on pre-combusted quartz fibre filters (QFFs) (Whatman 141
QMA grade, 20.3 x 25.4 cm) using a high volume air sampler (Tisch Environmental 142
Inc., OH, USA). Overall, 60 samples were collected (1920±40 m3, average volume, 143
Table S1). Sampling was conducted on the roof top (~8 m ASL) of the Faculty of 144
Science of Bizerte (37° 16' 0.5802'' N, 9° 52' 49.875'' E) around 1 km far from the city 145
center, close to the Gulf of Bizerte shoreline and Bizerte lagoon water front (Figure 1). 146
147
2.3. Sample processing 148
149
The samples were processed as described in Barhoumi et al. (2018). Briefly, each QFF 150
was cut into two equal parts. One half was used for organic pollutant analyses and the 151
other half for determination of ancillary data like TSP, total organic carbon (TOC) and 152
organic nitrogen (TON) (Table S1). The corresponding filter halves were cut into small 153
pieces and spiked with 250 ng of deuterated surrogate standards (tri-n-butyl-d27
-154
phosphate, triphenyl-d15-phosphate, tris(2-chloroisopropyl)-d18-phosphate and
tris(1,3-155
dichloro-2-propyl)-d15-phosphate). Filters were extracted with dichloromethane (DCM)
156
(3 cycles of 5 min) using an accelerated solvent extraction system (ASE 350, DIONEX) 157
at 100 °C, 110 bars, 100% of rinsing volume and 60 s purging time. Few grams of 158
activated copper were added to ASE flanks to remove potential traces of sulphur. The 159
obtained extract was rota-evaporated (with a solvent exchange into hexane) to 160
approximately 0.5 ml and then loaded into a silica-alumina chromatography glass 161
column (10 mm internal diameter, i.d.), prepared by adding, from bottom to top; 3 g 162
deactivated alumina (3% w/w), 3 g activated silica, and 1 g dehydrated sodium sulphate. 163
After conditioning with 15 mL of n-hexane, the column was subsequently eluted into 164
three fractions (F): with 20 mL of hexane (F1), 40 mL of hexane/DCM (80:20, v/v) (F2) 165
and 40 mL DCM/Acetone (70:30, v/v) (F3). OPEs were analysed in F3, which was rota-166
evaporated down to ~0.2 ml, solvent exchanged into isooctane and further concentrated 167
under gentle nitrogen stream up to ~0.1 mL. Prior to injection, 200 ng of deuterated 168
standards (Tri-n-propyl-d21-phosphate, Tris(2-chloroethyl)-d12-phosphate and
169
Malathion-d7) were added to the extracts to be used as internal standards for
170 quantification. 171 172 2.4. Instrumental Analysis 173 174
OPE analysis was conducted by gas chromatography (Agilent 7820A Series GC) 175
coupled with mass spectrometry (Agilent 5977E MS) (GC-MS) operating in selected 176
ion monitoring (SIM) and electron impact (EI, 70eV) mode. OPEs were quantified by 177
the internal standard procedure. Table S2 shows selected ions for detection and 178
quantification for each compound. The injector temperature was set at 270 ºC (splitless). 179
The separation was achieved over a 30m x 0.25mm i.d. x 0.25µm HP-5MS capillary 180
column (Agilent J&W).The oven temperature was programmed from 90ºC to 132ºC at 181
3ºC/min, to 165ºC at 10ºC/min, to 235ºC at 2ºC/min, then to 300ºC at 25ºC/min 182
(holding time 5min). The injection volume was of 2 µL and the helium carrier gas flow 183
was 1 mL min-1. The temperatures of the MS transfer line; ion source, and quadrupole 184
were set at 300, 230 and 150 ºC, respectively. Samples were analysed for the following 185
OPEs: tris-(2-chloroethyl)phosphate (TCEP; CAS: 115-96-8), tris[2-chloro-1-186
(chloromethyl)ethyl]phosphate (TDCP; CAS: 13674-87-8), Tris- (1-chloro-2-187
propyl)phosphate (TCPPs, mix of isomers; CAS: 13674-84-5), tripropyl phosphate 188
(TPP; CAS: 513-08-6), tri-iso-butyl phosphate (TiBP; CAS: 126-71-6), tri-n-butyl 189
phosphate (TnBP; CAS: 126-73-8), triphenyl phosphate (TPhP; CAS: 115-86-6), 2-190
ethylhexyl diphenyl phosphate (EHDPP; CAS: 1241-94-7), and tri(2-ethylhexyl) 191
phosphate (TEHP; CAS:78-42-2). TOC and TON were determined in filter subsamples 192
by high temperature combustion (CHN analyser) (Raimbault et al., 2008). Individual 193
native OPE standards were purchased from Dr. Ehrenstorfer GmbH (Germany), 194
whereas labeled standards tri-n-butyl-d27-phosphate, triphenyl-d15-phosphate,
tri-n-195
propyl-d21-phosphate and malathion-d7 were obtained from C/D/N Isotopes Inc.
196
(Canada) and tris(2-chloroisopropyl)-d18-phosphate, tris(1,3-dichloro-2-propyl)-d15
-197
phosphate and tris(2-chloroethyl)-d12-phosphate were from Cambridge Isotope
198
Laboratories, Inc. (USA). 199
200
2.5. Quality assurance / quality control (QA/QC) 201
202
The high volume air sampler was regularly calibrated (each month) following the
203
m uf c u ’s procedure (Tisch Environmental, HIGH VOL+). QFFs were 204
individually wrapped in double aluminium foil and baked at 450 ºC overnight before 205
sampling. After each sampling event, the filters were wrapped in the same aluminium 206
foil and stored in double sealed plastic bags f z −20 °C b fo p ocessing. 207
The pre- and post-sampling QFF weights were determined after they were placed in a 208
desiccator (25 °C) for 24h. Standards (natives + labelled compounds) were introduced 209
in the chromatographic sequence to evaluate possible variations on the detection 210
conditions during the time of analyses. Prior to use, the ASE cells were pre-cleaned by 211
p fo m “ mp y” A E x c o w DCM. Three field blanks (taken in autumn 212
- summer), consisting on baked QFFs transported to the sampling area, mounted in the 213
sampler, and dismounted, were collected, stored and analysed concurrently with the 214
samples. Three laboratory blanks were also performed. Blanks results are presented in 215
Table S3. An unexpected problem occurred during the processing of one of the field 216
blanks, so results are only reported for the two remaining blanks. OPE levels in the 217
blanks were generally low, ranging from ~1 to 14 ng for most compounds. Relatively 218
higher blank levels were found for TiBP, EHDPP and TCPP (25 to 74 ng). However, 219
these three OPEs exhibited the highest concentrations in the samples. These higher 220
blank levels were suspected to come from the ASE system used for the sample 221
extraction. A high variability was observed, in particular for the most abundant 222
compounds, highlighting the necessity of collecting more field blanks in future long-223
term OPE monitoring studies. Laboratory blanks showed lower or similar levels to field 224
blanks, so no contamination during sampling or storage occurred. Results were blank 225
corrected by subtracting the filed blank values (autumn). Instrumental limits of 226
detection (LODs), calculated as signal-to-noise (S/N) ratio > 3, and limits of 227
quantification (LOQ), corresponding to a S/N ≥ 10, ranged from 5 to 50 and from 10 to 228
100 pg, respectively depending on the compound (Table S4). 229
Average method recoveries (n=60) (extraction-cleanup-analysis) as monitored by the 230
surrogate OPEs varied from 57±11 to 105±11% (Table S5). In addition, spike 231
experiments for native OPEs were conducted. Clean QFF (n=2) were spiked with a 232
mixture of native OPE (250 ng/sample) and extracted as indicated above. Results 233
confirm the good recoveries of our method; with an average native OPE recovery of 234
101± 24 % (Table S6). Results were not corrected by recoveries. NIST SRM 2585 was 235
analysed for target OPEs as well. This reference material is not certified for OPEs, 236
however different laboratories have provided concentration of OPEs in this dust 237
reference material, becoming a recommended quality control step (Fan et al., 2014, 238
Castro-Jiménez et al., 2016). The average results for two replicates (blank corrected) 239
proved that the analysis of OPE using the described methodologies provided 240
concentrations generally in good agreement with reported values for most OPEs (Figure 241
S1). Deviations were found for EHDPP and TDCP, only. 242
243
3. Results and discussion 244
245
3.1. Atmospheric occurrence
246 247
3.1.1. Detection frequency and concentrations 248
249
The studied OPEs were detected in the aerosol samples over Bizerte city at generally 250
high frequencies, except for TPP and TDCP (only found in 8% and 12% of the samples, 251
respectively). Low detection frequencies of TDCP in the atmosphere has been 252
previously reported in some environments, like in the Great Lakes (Salamova et al., 253
2014b). The non-chlorinated OPEs (TPhP, EHDPP, TnBP and TEHP) were generally 254
the most frequently found (92-98%), although closely followed by the chlorinated 255
TCEP and TCPPs (85-90%). The other alkyl-OPE measured (i.e. TiBP) was present in 256
the 70% of the samples (Figure S2). However, the minor frequency observed for TiBP 257
can be attributed to the blank subtraction performed (relatively high field blank levels 258
compared to the other alkyl-OPEs) (Table S3). These results confirm the presence of 259
OPEs at the NW Mediterranean African coast, never reported before. 260
Ov , ∑9OPE particle-bound atmospheric concentrations (considering only 261
detected values) ranged from ~100 to 1060 pg m-3 (470 pg m-3, median) along the 262
sampling period with TCPPs, EHDPP and TiBP exhibiting the higher median 263
concentrations of ~ 110, 100 and 85 pg m-3, respectively. Table S7 shows the compound 264
specific concentrations for all aerosol samples. Very few OPE atmospheric 265
measurements in coastal areas have been performed so far. The vast majority of 266
available data in marine environments come from cruise measurements. The measured 267
values in Bizerte are generally lower than those reported across the Mediterranean Sea 268
(∑14OPE: 400-5000 pg m-3) d W B ck (∑14OPE: 1700-6000 pg m-3) 269
(Castro-J mé z ., 2014), E C (∑8OPE 230-2900 pg m-3) (Möller et al., 270
2012) and tropical and subtropical areas from the Atlantic, Pacific and Indian Oceans 271
(∑14OPE: 360-4400 pg m-3 (Castro-Jiménez et al., 2016), but in the range of those from 272
the North Sea (∑8OPE: 100-1400 pg m-3) (Möller et al., 2012) and Svalbard coastal area 273
(∑8OPE: 30-1450 pg m-3 ) (Salamova et al., 2014a). However, OPE levels in Bizerte 274
were higher than those reported for other semi-enclosed marine environments like the S 275
China Sea (∑9OPE: 50-160 pg m-3) (Lai et al., 2015) and also less impacted areas like 276
the Coral Sea (∑4OPE: 90 pg m-3) (Chen et al., 2013). These comparisons should be 277
taken with caution though, due to the consideration of different number (and type, in 278
some cases) of compounds included in the sums and the different seasons and years of 279
the studies. Although it may still high variable, a more meaningful comparison would 280
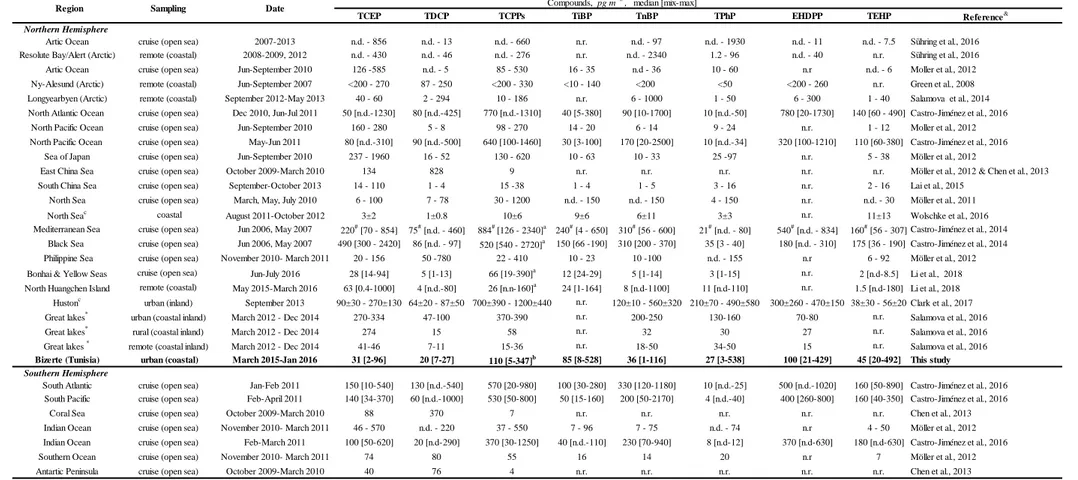
be considering individual compounds. The atmospheric levels of the predominant OPEs 281
in Bizerte (i.e. TCPPs, EHDPP and TiBP) were individually compared with existing 282
studies. Table 1 provides an updated compilation of atmospheric particle-bound OPE 283
measurements in marine/coastal environments and some reference inland urban 284
locations for comparison. Interestingly, some different trends were found compared to 285
os of ∑9OPEs; with TCPPs concentrations in Bizerte higher than in the E China Sea 286
and Svalbard, but lower than those in the North Sea. TiBP levels in Bizerte appear to be 287
generally higher than in other marine/coastal environments studied. This compound is 288
used in a wide variety of industrial applications including building, papers, boards, 289
plastics, rubbers, textile and directly as an additive in various products such as lacquers, 290
hydraulic fluids and floor polishes (ECHA website). Therefore, their relatively high 291
levels measured in this study could be related to the plastic and textile industries located 292
in Menzel Jemil city, 5 km SE of the sampling station (Figure 1) (Barhoumi et al., 293
2018). EHDPP concentrations in Bizerte were in the range of those reported for the 294
Black Sea but lower than in the W Mediterranean Sea (Castro-Jiménez et al., 2014) and 295
the tropical and sub-tropical Atlantic, Pacific and Indian Oceans (Castro-Jiménez et al., 296
2016). 297
298
Despite the variability that the mentioned factors may have induced, it is not completely 299
clear why the atmospheric levels measured in Bizerte (a coastal urban city under 300
important anthropogenic pressures) for some of the most abundant OPEs like TCPP 301
(among others, see Table 1), are in the range and/or lower than those reported for 302
remote coastal environments or pristine oceanic regions. Most probably a combination 303
of differential regional emission patterns, meteorological conditions and rates of 304
atmospheric processing can explain these data. For example, the important global solar 305
irradiance in the Mediterranean basin (The Mermex group, 2011, Sempéré et a., 2015), 306
reaching annual average values of ~210 W m-2 in Bizerte city (Chelbi et al., 2015, Ben 307
Othman et al., 2018) could enhance atmospheric degradation due to photochemical 308
oxidation reactions. Even if these processes likely progress faster for gas-phase 309
compounds, the atmospheric photochemical oxidation of particle-bound OPEs has also 310
been described (Liu et al., 2014). These conditions would favour the decrease of OPE 311
atmospheric levels, even if land-based sources could be higher than in other 312
environments (like the Arctic, with less solar irradiation rates and colder temperatures). 313
In addition, the huge expansion of OPE production and usage experienced in EU and 314
other developed countries could have not yet arrived to the NW African edge of the 315
Mediterranean Sea, where OPE consumption (and related emission) may be still 316
moderate. However, no public data on OPE production and consumption exist in this 317
region to the best of our knowledge, highlighting the necessity of OPE emission 318
inventories at the African Mediterranean coast. 319
320
3.1.2. Atmospheric pattern and seasonality 321
322
As indicated, TCPPs, EHDPP and TiBP exhibited the higher concentrations and 323
therefore dominated the global OPE atmospheric patter (n=60) over Bizerte, accounting 324
for the 25±16 %, 23±10 %, and 20±15% of ∑9OPEs, respectively (Figure S3). A 325
general predominance of Cl-OPEs, in particular TCPP, in atmospheric aerosols in open 326
marine environments has been reported (Li et al., 2018; Castro-Jiménez et al., 2016; 327
Möller at al., 2012). However, a higher relative contribution of the alkyl and aryl OPEs 328
have been reported over urban areas or in remote areas under the suspected influence of 329
local sources (Castro-Jiménez et al., 2016; Salamova et al., 2014a). The Cl-OPEs (as 330
sum of TCEP, TCPP and TDCP) and the non-Cl-OPEs (as sum of TPP, TiBP, TnBP, 331
TPhP, EHDPP and TEHP) globally (n=60) accounted for the 28% and the 72% (median 332
values) of the ∑9OPEs over Bizerte area, respectively (Table S8), generally pointing to 333
the influence of current local OPE sources in the study area. This relative distribution is 334
also consistent with the suspected non-Cl-OPEs sources, in particular TiBP, from the 335
plastic industry located SE the sampling site. Generally non-Cl-OPEs are used as 336
plasticizers, contrary to Cl-OPEs which are more commonly used as flame retardants 337
(Wei et al., 2015). Interestingly, three samples (Prel_22, 30, 72, Table S8) showed the 338
opposite pattern with a clear predominance of Cl-OPEs, accounting from the 77% to 339
88% of ∑9OPEs, in line with the most common reported situation in marine 340
environments (76% median value of predominance for Cl-OPEs) (Li et al., 2018). 341
Indeed, the air mass back trajectories (BTs), calculated with the HYSPLIT model 342
(Draxler and Rolph, 2011), revealed a clear Atlantic Ocean influence for those samples 343
(Figure S4). All BTs are also available in SI (see discussion below) 344
345
Samples were grouped by seasons based on local climate of Bizerte city as follows:
346
autumn (September, October, and November), winter (December, January), spring
347
(March, April, and May) and summer (June, July and August). When comparing the 348
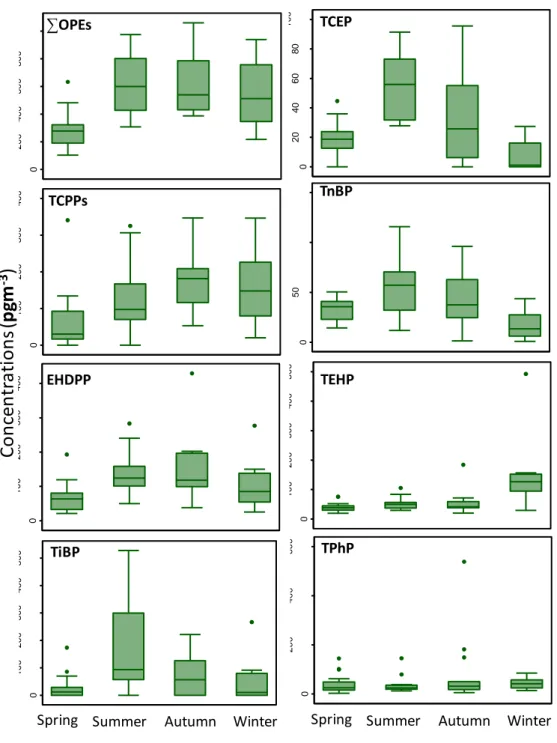
OPE atmospheric pattern by seasons (Figure 2) with the annual pattern (Figure S3), 349
some differences appeared. Whereas the relative distribution of Cl-OPEs appears to be 350
pretty constant along the year, except for the winter months, when TDCP was not 351
detected at all, some differences in the relative distribution of non-Cl-OPEs were 352
observed. First, TiBP and TnBP showed a similar relative distribution in spring, 353
whereas TiBP dominated over TnBP along the rest of the year, in particular in winter. In 354
addition, EHDPP dominated the atmospheric pattern in all seasons except in winter, 355
when TEHP exhibited higher relative concentrations. These findings point to a temporal 356
variability on the OPE atmospheric pattern in the study area. 357
359
Figure 2. OPE atmospheric particle-bound pattern in Bizerte area in the different 360
seasons (2015-2016) 361
362
In order to further investigate the OPE seasonality in the area studied; the differences in 363
contaminant concentrations were evaluated as well (Figure 3). Non-parametric tests 364
(STATA/SE 12.1 statistical software) were used in order to investigate possible 365
significant differences among contaminants. For this data analysis, non-detected values 366
were imputed to the median value between zero and the LOD for each specific 367
contaminant. Results from the Kruskal-Wallis test for OPEs (TPP and TDCP were not 368
considered due to their low detection frequency) showed significant differences (p 369
≤0.003) mo s so s fo ΣOPEs d d v du OPEs, xc p TP P (T b 370
S9). Contaminant concentrations (except for TPhP) were further compared by pairs of 371
regions (Wilconxon rank-sum test). Each contaminant level was compared among 4 372
seasons resulting in a total of 6 pairs of comparisons. The False Discovery Rate (FDR) 373
correction (Benjamini and Hochberg, 1995; Benjamini and Yekutieli, 2001), with 374 [n=19] Spring Rel ati ve a b u n d an ce (% ) [n=13] Autumn [n=20] Summer [n=8] Winter
m s’s m od ( m s ., 1986) w s us d o ccou fo ff c of mu p 375
comparisons (Table S10). 376
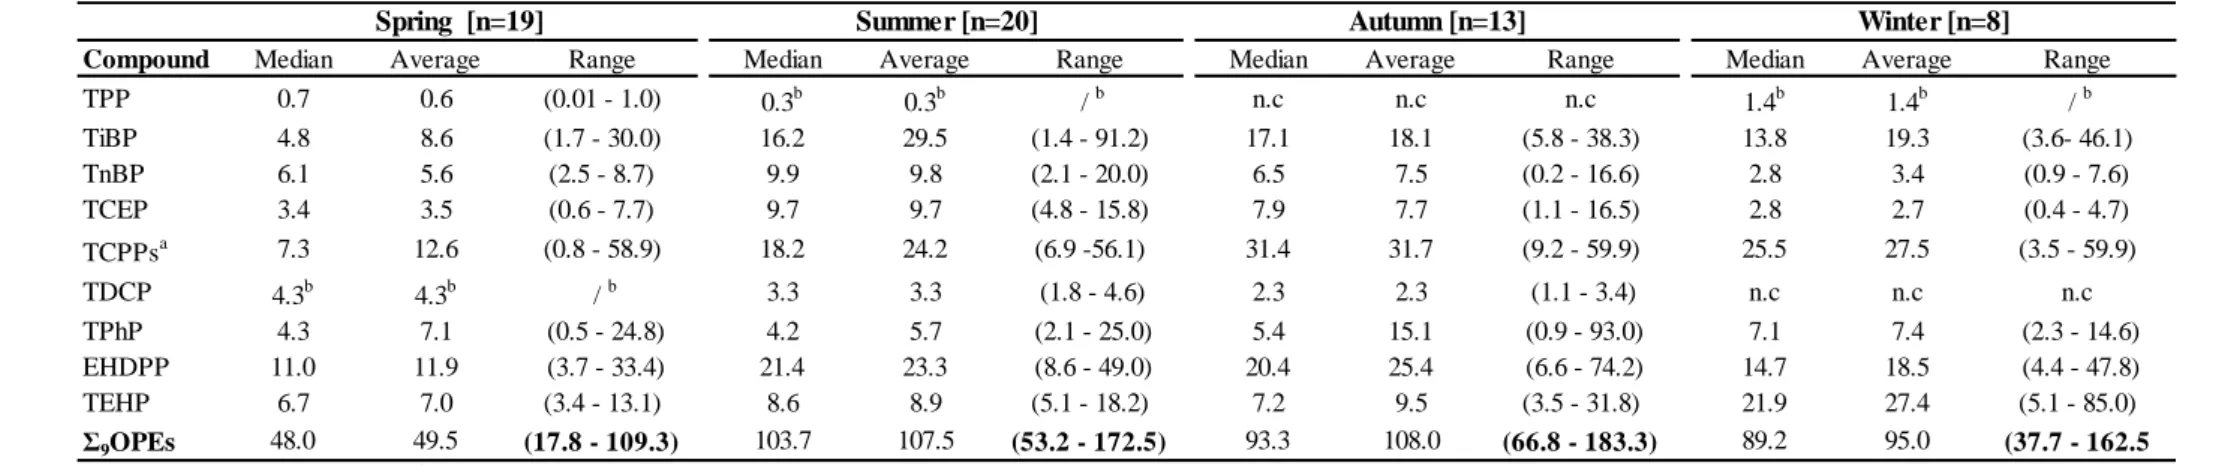
Overall, the two seasons showing more significant differences were spring and summer 377
(Table S10) with all OPEs d ΣOPEs x b s f c y co c o s 378
in summer compared to spring. Indeed, the sum of OPEs and most individual OPEs 379
showed the lowest concentrations in spring (i.e. TCPPs, EHDPP, TiBP and TEHP) with 380
median values from 2 to 4-fold significantly lower (p ≤ 0.02) than those measured in the 381
other months of the year (Figure 3, Table S10). However, only three OPEs showed 382
significant differences between the coldest (winter) and the warmest (summer) seasons, 383
but with contrasting trends. TCEP and TnBP were the only OPEs showing significantly 384
(p˂0.001) higher levels (~4-fold) in summer compared to winter, whereas TEHP 385
concentration was ~3-fold higher in winter. In addition, TEHP was the only compound 386
exhibiting significantly (p ≤ 0.01) higher concentrations in winter (~3-fold) compared to 387
the other three seasons, whereas TnBP showed the opposite trend, with significantly (p 388
≤ 0.03) lower levels in winter (~2-fold) compared to the other three seasons. These 389
observations are consistent with their different relative distribution observed in the 390
winter pattern (Figure 2). 391
392
Figure 3. Box plots of particle-bound atmospheric concentrations (pg m-3) of most 393
frequently found OPEs by season. Lines within the boxes represent the median 394
concentrations. 395
3.1.3. Potential factors affecting seasonality 396
397
OPE concentrations did not correlate with other parameters simultaneously measured in 398
the same samples, like TSP, TOC and TON, which ranged from 9.6 – 119.0, 1.0 – 24.5 399 0 20 40 60 80 1 0 0
Spring Summer Autumn Winter
TCEP 0 50 1 0 0 1 5 0
Spring Summer Autumn Winter
TnBP 0 1 0 0 2 0 0 3 0 0 4 0 0 5 0 0
Spring Summer Autumn Winter
TEHP 0 2 0 0 4 0 0 6 0 0 8 0 0 1 0 0 0
Spring Summer Autumn Winter
∑OPEs 0 1 0 0 2 0 0 3 0 0 4 0 0
Spring Summer Autumn Winter
TCPPs 0 1 0 0 2 0 0 3 0 0 4 0 0
Spring Summer Autumn Winter
EHDPP 0 1 0 0 2 0 0 3 0 0 4 0 0 5 0 0
Spring Summer Autumn Winter
TiBP 0 2 0 0 4 0 0 6 0 0
Spring Summer Autumn Winter
TPhP
C
o
n
cen
tr
ati
o
n
s (
p
gm
-3)
and 0.2 – 3.0 g m-3, respectively (Figure S5). The lack of correlation between some 400
OPEs (like TCPP and EHDDP) and the atmospheric TSP and/or TOC levels over urban 401
areas have been previously reported (Clark et al., 2017). However, the authors showed 402
that certain OPE could correlate with other fractions of the atmospheric aerosols, the 403
finest fractions like PM2.5. Indeed, other studies conducted in urban areas confirmed 404
the OPE associations with PM2.5 fraction (Faiz et al., 2018; Liu et al., 2016), with 405
strong correlations reported for some OPEs, like TCEP, TnBP and TEHP (Faiz et al., 406
2018). The form OPEs are emitted to the atmosphere seems to be a key factor 407
determining these associations, with higher probability of enrichment in the finest 408
fractions for OPE directly emitted in the gas phase due to the larger surface area of fine 409
particles compared to coarse particles (Faiz et al., 2018; Clark et al., 2017). However, 410
these associations cannot be evaluated in the study area with available data. 411
412
TCEP, TnBP, EHDPP as well as ΣOPEs s ow d s f c pos v correlations with 413
temperature (p≤0.002), consistent with their higher levels found in summer (average T= 414
26±2°C) compared to winter (average T=12±2°C), in particular for TCEP and TnBP. 415
Even if not all OPEs did show correlations with temperature, this could partially explain 416
the lower levels generally found in spring (average T= 16±3°C) compared to summer. 417
Temperature could play a local effect by increasing the OPE volatilization from land 418
and water and also affecting their environmental partitioning. Interestingly, TCEP and 419
TnBP show also a weak (but statistically significant, p≤ 0.001) negative correlation with 420
the relative humidity (RH). Significantly (p=0.02) higher RH values (70±7%) and 421
slightly higher precipitation rates (9.0 mm) and wind speeds (17±7 km h-1) were 422
registered in spring compared to summer (66±5%, 0.6 mm and 15±6 km h-1, 423
respectively) (Figure S5, Table S1) pointing to a most efficient atmospheric particle 424
washout in spring, which is consistent with our observation too. 425
The BTs (Figure S6) did not really show a consistent influence on the OPE seasonality, 426
except for punctual cases affecting the atmospheric pattern and/or concentrations (as 427
indicated above). The BTs computed for the samples collected in spring generally had a 428
longer air mass range with Atlantic Ocean influence, compared to those for summer, 429
when air masses generally showed a shorter range and spent more time circulating over 430
the W Mediterranean and continental Europe. In addition, some samples showed a clear 431
SE influence of air mass trajectory in summer (e.g. Prel_27, 28) leading to higher TiBP 432
levels (Tables S7, S8) consistent too with our observation of higher levels in summer 433
compared to spring and suspected influence of plastic industry located at the SE from 434
the sampling site. The local wind regimes could have also an influence in the 435
seasonality observed. Figure S7 shows the wind roses for all seasons. A general 436
predominance of winds blowing in the sector WNW-NW was observed for all seasons 437
except for winter, when a clear predominance for SE winds was registered. This could 438
partially explain as well the different pattern observed in winter for non-Cl-OPEs, with 439
higher TiBP and TEHP levels potentially coming from the plastic factory located SE 440
from the sampling site, as discussed above. In summary, a number of factors, likely 441
acting simultaneously, seem to be affecting the relative abundance and distribution 442
pattern between the Cl- and non-Cl-OPEs and their atmospheric concentrations in the 443
study area, like potential local sources and meteorological conditions, influence of air 444
mass trajectories, the LRAT potential of some OPEs travelling from distant sources 445
and/or the atmospheric degradation and depletion processes in the region. 446
447
3.2. Atmospheric loading
449
3.2.1. Dry deposition fluxes 450
451
Dry deposition fluxes (FDD, ng m-2 d-1) of target OPEs were calculated as: 452
453
FDD= 864vd CA [1]
454 455
where CA (ng m-3) is the specific OPE volumetric concentration in the aerosol, vd (cm s -456
1
) is the particle deposition velocity and 864 is a unit conversion factor. A reference 457
value of 0.2 cm s-1 for vd was adopted for this site. This value is within the range of vd 458
experimentally measured (Del Vento and Dachs 2007) in coastal NW Mediterranean 459
Seaand has recently been used in the same site for the estimation of dry deposition 460
fluxes of other organic contaminants with similar physical-chemical properties as OPEs 461
(Castro-Jiménez et al., 2017). Even if a degree of uncertainty is associated to this 462
calculation due to the lack of vd measurements during the sampling events, the selected 463
value enables meaningful comparisons with other estimations in the study area and in 464
the W Mediterranean Sea. Overall, the Σ9OPEs atmospheric dry deposition fluxes 465
ranged from 18 to 180 ng m-2 d-1 during the sampling period (Table S11). These fluxes 466
were generally lower than previous dry deposition estimations performed in the W 467
Mediterranean Sea and in the SW Black Sea (Castro-Jiménez et al., 2014) but within the 468
range of those reported for the North Sea (Möller et al., 2011) and the Philippine Sea 469
(Möller et al., 2012). However, the presented estimations of dry deposition are higher 470
than those reported for other semi-enclosed environments like the China Sea (Lai et al., 471
2015) and also less impacted areas like the Coral Sea (Chen et al., 2013). 472
Table 2 presents the dry deposition fluxes for each OPE by season. The highest median 473
atmospheric loading (and associated higher potential exposure) for the assemble of 474
OPEs via atmospheric dry deposition in the study area is estimated to occur in the 475
summer, autumn and winter months (as expected from their relative atmospheric 476
concentrations and the assumptions considered in these calculations) with fluxes 477
ranging from 32 to 38 µg m-2 y-1 for these seasons. This loading is 1 to 3 orders of 478
magnitude higher than the reported atmospheric dry deposition fluxes of PBDEs (the 479
OPEs “p d c sso s”) (0.07-3.4 µg m-2 y-1 for Σ27PBDEs), and even higher compared to 480
the dry deposition fluxes estimated for other legacy POPs like PCDD/Fs, PCBs and 481
organochlorine pesticides (OCPs) over Bizerte during the same observation period 482
(Castro-Jiménez et al., 2017; Barhoumi et al., 2018). However, the atmospheric dry 483
deposition fluxes of OPEs are in the lower end of those reported for ∑34PAHs (30-1100 484
µg m-2 y-1) in Bizerte for the same period (Barhoumi et al., 2018). 485
486
3.2.2. Environmental relevance and potential impacts 487
488
According to these calculations, the nearby coastal lagoon of Bizerte (1.28 x10⁸ m2 489
surface, Barhoumi et al., 2016), a well-recognized sensitive environment of ecological 490
and socio-economic importance (the most important aquaculture area in Tunisia, 491
annually producing around 100 tons of Pacific oysters and Mediterranean mussels, 492
Béjaoui-Omri et al., 2014) could receive up to ~ 9 kg of OPEs yearly. This loading of 493
OPEs may have, yet unknown, implications for the aquatic organisms and the 494
ecosystem functioning. The input of these hazardous compounds may elicit an effect 495
through environmental exposure, as a single group of contaminants or in combination to 496
other toxic organic chemicals also efficiently incorporated to this aquatic environment 497
via the atmosphere like PCDD/Fs, PCBs, PBDEs, OCPs and PAHs (Castro-Jiménez et 498
al., 2017; Barhoumi et al., 2018). In addition, OPE may interfere the natural phosphorus 499
cycle. Recent estimations performed in the Mediterranean Sea and other oceanic 500
environments suggest that atmospheric deposition fluxes of phosphorus due to OPE 501
deposition (and other anthropogenic organic pollutants containing phosphorus) could 502
play an important role in the phosphorus cycle, in particular in oligotrophic 503
environments, affecting the ecosystem structure and functioning, for example modifying 504
primary production rates (Castro-Jiménez et al., 2014, 2016). The dry deposition fluxes 505
of Σ9OPEs given as P averaged ~10 ngP m-2 d-1 over Bizerte lagoon area. The maximum 506
estimated loading of new anthropogenic phosphorus coming from OPEs was of ~1 kg y -507
1
. This input is certainly small, representing only between the 0.02-0.5% of the organic 508
phosphorus dry deposition fluxes recently estimated in the W Mediterranean Sea 509
(Violaki et al., 2018). However, these fluxes accounted for both anthropogenic and non-510
anthropogenic organic compounds, and our estimates correspond exclusively to nine 511
compounds belonging to an emerging widely diffused anthropogenic contaminant class 512
contain phosphorous. Moreover, the reported organic phosphorous inputs for the 513
Mediterranean (Violaki et al., 2018) correspond to the entire W Mediterranean basin, 514
whereas the organic phosphorous amounts due to OPEs will distribute only on the ~ 130 515
km2 of lagoon surface, a shallow and enclosed environment with limited water 516
exchanges. In addition, recent studies confirmed that OPE can also exist in the 517
atmospheric gas phase (Li et al., 2018; ., 2016b, Castro-Jiménez et al., 518
2016) and the diffusive deposition fluxes (i.e. the direct input of gas phase OPE to the 519
water dissolved phase) could be 2-3 orders of magnitude higher that the dry deposition, 520
potentially triggering up to 1% of the reported primary production in the most 521
oligotrophic oceanic regions (Castro-Jiménez et al., 2016). OPE could also enter Bizerte 522
lagoon by riverine inputs, a source of new anthropogenic phosphorus associated to OPE 523
not yet evaluated. A global assessment performed with available data before the 524
beginning of the large expansion of OPE production and usage (in 2009) estimated the 525
human interference with the phosphorus cycle very close to a threshold of no return (i.e. 526
irreversible disruptive effect) (Rockström et al., 2009). The not yet accounted new 527
anthropogenic phosphorus coming from OPEs and other P-organic containing 528
contaminants, even if small at a regional/global scale, may be contributing to reach the 529
mentioned threshold and efforts should be devoted to study these links and the 530
integrated impacts of OPEs in aquatic/marine ecosystems. 531
532
4. Conclusions 533
534
Organophosphate ester flame retardants and plasticizers have been measured for the 535
first time in the atmosphere of the NW African coastal Mediterranean Sea (Bizerte city 536
area) confirming the general high detection frequency of most common OPEs. A 537
general predominance of non-chlorinated OPEs has been found in the atmospheric 538
aerosols, being different from what is commonly reported in marine environments (i.e. 539
higher predominance of chlorinated OPEs) suggesting current local sources in the area. 540
Some compounds could be regarded as useful tracers of local/regional specific 541
activities/sources, like TiBP as tracer of the potential impact of plastic industries in 542
Bizerte area. The lowest concentrations were generally found in spring, probably linked 543
to local meteorological conditions and the LRAT of OPEs from other areas to a lesser 544
extent. The atmospheric levels of some of the most abundant OPEs (like TCPP) in 545
Bizerte area, a coastal urban city under important anthropogenic pressures, seem to be 546
in the range and/or lower than those reported for remote coastal environments or 547
pristine oceanic regions. These findings suggest a combined effect of differential 548
regional emission patterns, meteorological conditions and rates of atmospheric 549
processing (with high solar irradiance, probably leading to a most efficient atmospheric 550
OPE depletion processes in the area, likely compensating potential local sources). In 551
addition, the influence of the existing regulatory frameworks in different areas of the 552
globe may contribute to this situation. Although OPE atmospheric concentrations as 553
sum of compounds could provide a first useful insight on their environmental levels, the 554
environmental behaviour of OPEs should be better investigated for individual 555
compounds. We found that not all OPEs presented the same seasonality in terms of 556
atmospheric concentrations and pattern. The estimated dry deposition fluxes to Bizerte 557
lagoon point to a yearly input of around ~ 9 kg of OPEs (~1 kg of new anthropogenic 558
organic phosphorus) to this shallow and enclosed aquatic environment (~130 km2) 559
considered as the most important aquaculture area in Tunisia, with yet unknown 560
implications in terms of environmental exposure and impacts in the ecosystem 561
functioning. Further research is needed to elucidate the magnitude and potential impacts 562
of these new organic contaminants and associated sources of anthropogenic 563
phosphorous in the study area. 564
Acknowledgements 566
567
This work is a contribution to the Labex OT-Med (n° ANR-11-LABX-0061) – 568
MEDPOP- funded by the Fr c Gov m “I v s ss m s d’Av ” (ANR) 569
through the A*MIDEX project (no ANR-11-IDEX-0001-02), and takes place in the 570
MERMEX/MISTRALS program. It also received the financial support from the IRD 571
French-Tu s I o Jo L bo o y (LMI) “CO Y -M d” and the PACA 572
region p oj c “Particule”. We thank Badreddine Barhoumi for his work on the 573
sampling, sample processing in the lab and manuscript revision and Marc Tedetti for his 574
logistic support, contribution to the results discussion and revision of the manuscript. 575
Catherine Guigue is acknowledged for her help on the sample preparation for the TOC 576
determinations and Patrick Raimbault for the TOC analyses. Mohamed Driss is kindly 577
acknowledged for allowing sampling on the Bizerte Faculty of Science. The project 578
leading to this publication has received funding from European FEDER Fund under 579
project 1166-39417. 580
581
Supporting information available 582
583
Additional data on the sampling and analytical procedures, QA/QC, compound-by-584
compound atmospheric levels and spatial distribution and deposition fluxes are 585
presented in this section. 586
References 588
589
Barhoumi, B., Castro-Jiménez, J., Guigue, C., Goutx, M., Sempéré, R., Derouiche, A., 590
Achouri, A., Touil, S., Driss, M.R., Tedetti, M. 2018. Levels and risk assessment of 591
hydrocarbons and organochlorines in atmospheric suspended particles from a north 592
African coastal city (Bizerte, Tunisia). Environ. Pollut. 240, 422-431. 593
594
Barhoumi, B., El Megdiche, Y., Clérandeau, C., Ben Ameur, W., Mekni, S., 595
Bouabdallah, S., Derouiche, A., Touil, S., Cachot, J., Driss, M. R. 2016. Occurrence of 596
polycyclic aromatic hydrocarbons (PAHs) in mussel (Mytilus galloprovincialis) and eel 597
(Anguilla anguilla) from Bizerte lagoon, Tunisia, and associated human health risk 598
assessment. Cont. Shelf Res. 124, 104–116. 599
600
Béjaoui-Omri, A., Béjaoui, B., Aloui-Bejaoui, N., Harzallah, A., El Bour, M., Aleya, L. 601
2014. Application of a dynamic energy budget model to Mytilus galloprovincialis in the 602
Bizerte lagoon (North of Tunisia). Environ. Sci. Poll. Res. 21, 13081-13094. 603
604
Ben Hassine, S., Hammami, B., Ben Ameur, W., El Megdiche, Y., Barhoumi, B., Driss. 605
M. R. 2014. Particulate Polycyclic Aromatic Hydrocarbons (PAH) in the atmosphere of 606
Bizerte city, Tunisia. Bull. Environ. Contam. Toxicol. 93, 375–382. 607
608
Ben Othman, A., Belkilani, K., Besbes, M. 2018. Global solar radiation on tilted 609
surfaces in Tunisia: Measurement, estimation and gained energy assessments. Energ. 610
Rep. 4, 101-109. 611
Benjamini, Y., Hochberg, Y. 1995. Controlling the false discovery rate: A practical and 612
powerful approach to multiple testing. J. Roy. Stat. Soc. B Met. 57, 289-300. 613
614
Benjamini, Y., Yekutieli, D. 2001 The control of the false discovery rate in multiple 615
testing under dependency. The Annals of Statistics 29, 1165-1188. 616
617
Berrojalbiz, N., Dachs, J., Ojeda, M.J., Valle, M.C., Castro-Jiménez, J., Wollgast, J., 618
Ghiani, M., Hanke, G., Zaldivar, J.M., 2011a Biogeochemical and physical controls on 619
concentrations of polycyclic aromatic hydrocarbons in water and plankton of the 620
Mediterranean and Black Seas. Global Biogeochem. Cy. 25, 621
doi:10.1029/2010GB003775 622
623
Berrojalbiz, N., Dachs, J., Ojeda, M.J., Valle, M.C., Del Vento, S., Castro-Jiménez, J., 624
Mariani,G., Wollgast, J., Hanke G., 2011b. Persistent organic pollutants in 625
Mediterranean seawater and processes affecting their accumulation in plankton. 626
Environ. Sci. Technol., 45, 4315-4322. 627
628
Berrojalbiz, N., Castro-Jiménez, J., Mariani, G., Wollgast, J., Hanke, G., Dachs, J., 629
2014. Atmospheric occurrence, transport and deposition of polychlorinated biphenyls 630
and hexachlorobenzene in the Mediterranean and Black seas. Atmos. Chem. Phys. 14, 631
8947-8959. 632
633
Bollmann, U.E., Möller, A., Xie, Z., Ebinghaus, R., Einax, J.W., 2012. Occurrence and 634
fate of organophosphorus flame retardants and plasticizers in coastal and marine surface 635
waters. Water Res. 46, 531-538. 636
Brandsma, S.H., Leonards, P.E.G., Leslie, H.A., de Boer, J. 2015. Tracing 637
organophosphorus and brominated flame retardants and plasticizers in an estuarine food 638
web. Sci. Total. Environ. 505, 22-31. 639
640
Castro-Jiménez, J., Deviller, G., Ghiani, M., Loos, R., Mariani, G., Skejo, H., Umlauf, 641
G., Wollgast, J., Laugier, T., Héas-Moisan, K., Léauté, F., Munschy, C., Tixier, C., 642
T o czyńsk , J., 2008. PCDD/F and PCB multi-media ambient concentrations, congener 643
patterns and occurrence in a Mediterranean coastal lagoon (Etang de Thau, France). 644
Environ. Pollut. 156, 123-135. 645
646
Castro-Jiménez, J., Eisenreich, S.J., Ghiani, M., Mariani, G., Skejo, H., Umlauf, G., 647
Wollgast, J., Zaldívar, J.M., Berrojalbiz, N., Reuter, H.I., Dachs, J., 2010. Atmospheric 648
occurrence and deposition of polychlorinated dibenzo-p-dioxins and dibenzofurans 649
(PCDD/Fs) in the open Mediterranean Sea. Environ. Sci. Technol. 44, 5456-5463. 650
651
Castro-Jiménez, J., Berrojalbiz, N., Wollgast, J., Dachs, J. 2012. Polycyclic aromatic 652
hydrocarbons (PAHs) in the Mediterranean Sea: atmospheric occurrence, deposition and 653
decoupling with settling fluxes in the water column. Environ. Pollut., 166, 40-47. 654
655
Castro-Jiménez, J., Berrojalbiz, N., Pizarro, M., Dachs, J. 2014. Organophosphate Ester 656
(OPE) flame retardants and plasticizers in the open Mediterranean and Black Seas 657
Atmosphere. Environ. Sci. Technol. 48, 3203-3209. 658
Castro-Jiménez, J., Casal, P., González Gaya, B., Pizarro, M., Dachs, J., 2016. 660
Organophosphate ester flame retardants and plasticizers in the global oceanic 661
atmosphere. Environ. Sci. Technol. 50, 12831–12839 662
663
Castro-Jiménez, J., Barhoumi, B., Paluselli, A., Tedetti, M., Jiménez, B., Muñoz-664
Arnanz, J., Wortham, H., Driss, M.R., Sempéré, R. 2017. Occurrence, loading and 665
exposure of atmospheric particle-bound POPs at the African and European edges of the 666
w s M d . E v o . c . T c o . 51, 13180−13189 667
668
Chelbi, M., Gagnon, Y., Waewsak, J. 2015. Solar radiation mapping using sunshine 669
duration-based models and interpolation techniques: Application to Tunisia. Energ. 670
Convers. and Manag. 101, 203-215. 671
672
Cheng, W., Xie, Z., Blais, J.M., Zhang, P., Li, M., Yang, C., Huang, W., Ding, R., Sun, 673
L. 2013. Organophosphorus esters in the oceans and possible relation with ocean gyres. 674
Environ. Pollut. 180, 159-164 675
676
Clark, A.E., Yoon, S., Sheesley, R.J., Usenko, S., 2017. Spatial and temporal 677
distributions of organophosphate ester concentrations from atmospheric particulate 678
matter samples collected across Houston, TX. Environ. Sci. Technol. 51, 4239–4247. 679
680
Cózar, A., Sanz-Martín, M., Martí, E., González-Gordillo, J.I., Ubeda, B., Gálvez, J.Á., 681
Irigoien, X., Duarte, C.M., 2015. Plastic Accumulation in the Mediterranean Sea. PLoS 682
ONE 10(4), 1-12. 683
Cristale, A., García Vázquez, A., Barata,C., Lacorte, S. 2013. Priority and emerging 685
flame retardants in rivers: Occurrence in water and sediment, Daphnia magna toxicity 686
and risk assessment. Environ. Int. 59, 232-243. 687
688
De Wit, C., 2002. An overview of brominated flame retardants in the environment. 689
Chemosphere. 46, 583–624 690
691
Del Vento, S., Dachs, J. 2007. Influence of the surface microlayer on atmospheric 692
deposition of aerosols and polycyclic aromatic hydrocarbons. Atmos. Environ. 41, 693
4920−4930. 694
695
Draxler, R.R., Rolph, G.D. 2011. HYSPLIT (HYbrid Single-Particle Lagrangian 696
Integrated Trajectory) Model access via NOAA ARL READY Website, 697
http://ready.arl.noaa.gov/HYSPLIT.php. NOAA Air Resources Laboratory, Silver 698
Spring, MD. 699
700
European Chemical Agency (ECHA). 2008. Tris[2-Chloro-1-(Chloromethyl)ethyl] 701
Phosphate (TDCP) CAS No.: 13674-87-8. EINECS No.: 237-159-2. Risk Assessment 702
Report. 703
704
European Chemical Agency (ECHA). 2009. Member State Committee support 705
document for the identification of Tris (2-chloroethyl) phosphate as a substance of very 706
high concern because of its CMR properties. 707
European Chemical Agency (ECHA):
https://echa.europa.eu/fr/substance-information/-709
/substanceinfo/100.004.363 (accessed on 06/04/2018)
710
711
Faiz, Y., Siddique, N., He, H., Sun, C., Waheed, S., 2018. Occurrence and profile of 712
organophosphorus compounds in fine and coarse particulate matter from two urban 713
areas of China and Pakistan. Environ. Pollut. 233, 26-34 714
715
Fan, X., Kubwabo, C., Rasmussen, P.E., Wu, F. 2014. Simultaneous determination of 716
thirteen organophosphate esters in settled indoor house dust and a comparison between 717
two sampling techniques. Sci. Total Environ. 491-492, 80–86. 718
719
Green, N.; Schlabach, M.; Bakke, T.; Brevik, E.M.; Dye, C.; Herzke, D.; Huber, S.; 720
Plosz, B.; Remberger, M.; Schøyen, M.; Uggerud, H.T; Vogelsang, C. 2008. Screening 721
of selected metals and new organic contaminants 2007. Norwegian Pollution Control 722
Authority, Report 1014/2008, ISBN- 978-82-577-5304-7. 723
724
Hallanger, I.G., Sagerupb K., Evenset, A., Kovacs, K.M., Leonards, P., Fuglei, E., Routti, 725
H., Aars, J., Strøm, H., Lydersen, C. Gabrielsen G.W., 2015. Organophosphorous flame 726
retardants in biota from Svalbard, Norway. Mar. Pollut. Bull. 101, 442–447 727
728
Kim, J-W., Isobe, T., Chang, K-Y., Amano, A., Maneja, R.H., Zamora, P.B., Siringan, 729
F.P., Tanabe, S., 2011. Levels and distribution of organophosphorus flame retardants 730
and plasticizers in fishes from Manila Bay, the Philippines. Environ. Pollut. 159, 3653- 731
3659. 732
Lai, S., Xie, Z., Song, T., Tang, J., Zhang, Y., Mi, W., Peng, J., Zhao, Y., Zou, S., 734
Ebinghaus, R. 2015. Occurrence and dry deposition of organophosphate esters in 735
atmospheric particles over the northern South China Sea. Chemosphere 127, 195–200. 736
737
Li, J., Tang, J., Mi, W., Tian, C., Emeis, K-C., Ebinghaus, R., Xie. X., 2018. Spatial 738
distribution and seasonal variation of organophosphate esters in air above the Bohai and 739
Yellow Seas, China. Environ. Sci. Technol. 52, 89−97. 740
741
Liu, D., Lin, T., Shen, K., Li, J., Yu, Z., Zhang, G., 2016. Occurrence and 742
concentrations of halogenated flame retardants in the atmospheric fine particles in 743
chinese cities. Environ. Sci. Technol. 50, 9846−9854. 744
745
Liu, Y., Liggio, J., Harner, T., Jantunen, L., Shoeib, M., Li, S-M., 2014. Heterogeneous 746
OH Initiated Oxidation: A Possible Explanation for the Persistence of Organophosphate 747
Flame Retardants in Air. Environ. Sci. Technol. 48, 1041−1048. 748
749
Ma, Y., Xie, Z., Lohmann, R., Mi, W., Gao, G., 2017. Organophosphate Ester Flame 750
Retardants and Plasticizers in Ocean Sediments from the North Pacific to the Arctic 751
Oc . E v o . c . T c o . 51, 3809−3815. 752
753
Mandalakis M., Apostolakis M., and Stephanou E.G., 2005. Mass budget and dynamics 754
of polychlorinated biphenyls in the eastern Mediterranean Sea. Global Biogeochem. Cy. 755
19, GB 018, 1-16 756
Mesquita, S.R., Dachs, J., van Drooge, B.L., Castro-Jiménez, J., Barata, C., Vieira, N., 758
Guimarães, L., Piña, B., 2016. Toxicity assessment of atmospheric particulate matter in 759
the Mediterranean and Black Seas open waters. Sci. Total Environ. 545–546, 163–170. 760
761
Mö , A., X , Z., C b , C., u m, R., Eb us, R., 2011. O op osp o us fl m 762
retardants and plasticizers in the atmosphere of the North Sea. Environ. Pollut. 159, 763
3660-3665. 764
765
Möller, A., Sturm, R., Xie, Z., Cai, M., He, J., Ebinghaus, R., 2012. Organophosphorus 766
flame retardants and plasticizers in airborne particles over the Northern Pacific and 767
Indian Ocean towards the Polar Regions: Evidence for global occurrence. Environ. Sci. 768
Technol. 46, 3127-3134. 769
770
Paluselli, A., Fauvelle, V., Schmidt, N., Galgani, F., Net, S., Sempéré, R. 2018. 771
Distribution of phthalates in Marseille Bay (NW Mediterranean Sea). Sci. Total 772
Environ. 621, 578-587. 773
774
Raimbault P., Garcia, N. Cerrutti, F., 2008. Distribution of inorganic and organic 775
nutrients in the South Pacific Ocean. Evidence for long-term accumulation of organic 776
matter in nitrogen-depleted waters. Biogeosciences 5, 281-298. 777
778
Rockström, J., Steffen, W., Noone, K., Persson, Å., Chapin, F.S., Lambin, E.F., Lenton, 779
T.M., Scheffer, M., Folke, C., Schellnhuber, H.J., Nykvist, B., De Wit, C.A., Hughes, 780
T., Van Der Leeuw, S., Rodhe, H., Sörlin, S., Snyder, P.K., Costanza, R., Svedin, U., 781
Falkenmark, M., Karlberg, L., Corell, R.W., Fabry, V.J., Hansen, J., Walker, B., 782
Liverman, D., Richardson, K., Crutzen, P., Foley, J.A. 2009. A safe operating space for 783
humanity. Nature 461, 472-475. 784
785
Salamova, A., Hermanson, M. H., Hites, R. A., 2014a. Organophosphate and 786
halogenated flame retardants in atmospheric particles from a European Arctic site. 787
Environ. Sci. Technol. 48, 6133−6140. 788
789
Salamova, A., Ma, Y., Venter, M., Hites, R.A. 2014b High levels of organophosphate 790
flame retardants in the Great Lakes atmosphere. Environ. Sci. Technol. Lett. 1, 8-14. 791
792
Salamova, A.; Peverly A.A.; Venier, M.; Hites, R.A Spatial and Temporal Trends of 793
Particle Phase Organophosphate Ester Concentrations in the Atmosphere of the Great 794
L k s. 2016. E v o . c . T c o . 50, 13249−13255 795
796
Schmidt, N., Thibault, D., Paluselli, A., Galgani, F. and R. Sempéré. Microplastics and 797
phthalates release in Mediterranean Sea. Mermex special issue, Progress in Oceanogr. 798
https://doi.org/10.1016/j.pocean.2017.11.010. In Press. 799
800
Sempéré, R., Para, J., Tedetti, M., Charriere, B., Mallet, M. 2015. Attenuation of UVR 801
and PAR in relation with chromophoric dissolved organic matter in surface coastal 802
waters of the Northwestern Mediterranean Sea. J. Photochem. Photobiol., A: Chemistry 803
91, 851-861. 804
Simes, R.J. 1986. An improved Bonferroni procedure for multiple tests of significance. 806
Biometrika, 73, 751-754. 807
808
, R., Diamond, M.L., Scheringer, M., Wong, F., Pu ko, M., Stern, G., Burt, A., 809
Hung, H., Fellin, P., Li, H., Jantunen, L.M., 2016a. Organophosphate esters in Canadian 810
Arctic air: Occurrence, Levels and Trends. Environ. Sci. Technol. 50, 7409-7415. 811
812
, R., Wolschke, H., Diamond, M.L., Jantunen, L.M., Scheringer, M. 2016b. 813
D s bu o of O op osp Es s b w G s d P c P s −Mod 814
Predictions vs Measured Data. Environ. Sci. Technol. 50, 6644−6651. 815
816
The Mermex Group. 2011. Marine ecosystems' responses to climatic and anthropogenic 817
forcings in the Mediterranean. Prog. Oceanogr. 91, 97-166. 818
819
United Nations Environment Programme: Stockholm Convention on Persistent Organic 820
Pollutants: Geneva, 2009. Report of the conference of the parties of the Stockholm 821
Convention on Persistent Organic Pollutants on the work of its fourth meeting, pp 112. 822
van der Veen, I., de Boer, J., 2012. Phosphorus flame retardants: properties, production, 823
environmental occurrence, toxicity and analysis. Chemosphere. 88 , 1119-1153. 824
825
Violaki, K., Bourrin, F., Aubert, D., Kouvarakis, G., Delsaut, N., Mihalopoulos, N. 826
2018. Organic phosphorus in atmospheric deposition over the Mediterranean Sea: An 827
important missing piece of the phosphorus cycle. Prog. Oceanogr. 163, 50-58. 828
Vonderheidea, A.P., Mueller, K.E., Meija, M., Welshd, G.L., 2008. Polybrominated 830
diphenyl ethers: Causes for concern and knowledge gaps regarding environmental 831
distribution, fate and toxicity. Sci. Total. Environ. 400, 425-436. 832
833
Wang, Q., Lai, N.L-S., Wang, X., Guo, Y., Lam, P. K-S., Lam, J. C-W., Zhou, B., 834
2015a. Bioconcentration and transfer of the organophorous flame retardant 1,3-835
Dichloro-2-propyl phosphate causes thyroid Endocrine disruption and developmental 836
neurotoxicity in Zebrafish larvae. Environ. Sci. Technol. 49, 5123−5132. 837
838
Wang, Q., Lam, J. C-W., Han, J., Wang, X., Guo, Y., Lam, P. K-S., Zhou, B., 2015b 839
Developmental exposure to the organophosphorus flame retardant tris(1,3-dichloro-2-840
propyl) phosphate: Estrogenic activity, endocrine disruption and reproductive effects on 841
zebrafish. Aquatic Toxicol. 160, 163–171. 842
843
Wei, G-L., Li, D-Q., Zhuo, M-N., Liao, Y-S., Xie, Z-Y., Guo, T-L., Li, J-J., Zhang, S-844
Y., Liang, Z-Q., 2015. Organophosphorus flame retardants and plasticizers: Sources, 845
occurrence, toxicity and human exposure. Environ. Pollut. 196, 29-46. 846
847
Wolschke, H.; Sühring, R.; Mi, W.; Möller, A.; Xie, Z.; Ebinghaus, R. Atmospheric 848
occurrence and fate of organophosphorus flame retardants and plasticizer at the German 849
coast. Atmos. Environ. 2016, 137, 1-5. 850
851
Zhong, M., Tang, J., Mi, L., Li, F., Wang, W., Huang, G., Wu, H., 2017. Occurrence 852
and spatial distribution of organophosphorus flame retardants and plasticizers in the 853
Bohai and Yellow Seas, China. Mar. Pollut. Bull. 121, 331–338 854
855 856 857