1
Supplementary Information
Effect of aging on silica aerogel properties
Subramaniam Iswara,b, Wim J. Malfaita*, Sandor Balogb, Frank Winnefeldc, Marco Lattuadab and Matthias M. Koebela*
aLaboratory for Building Energy Materials and Components, Swiss Federal
Laboratories for Materials Science and Technology, Empa, Überlandstrasse 129, 8600 Dübendorf, Switzerland
bAdolphe Merkle Institute, University of Fribourg, 1700 Fribourg, Switzerland cLaboratory for Concrete and Construction Chemistry, Swiss Federal
Laboratories for Materials Science and Technology, Empa, Überlandstrasse 129, 8600 Dübendorf, Switzerland
*Corresponding authors: wim.malfait@empa.ch, matthias.koebel@empa.ch
TABLE OF CONTENT
Sample appearance 2
SEM images 3
Nitrogen sorption isotherms 4
ATR-FTIR spectra 6
NMR data 7
SAXS spectra 12
Elemental analysis 15
2
Sample appearance
3
SEM images
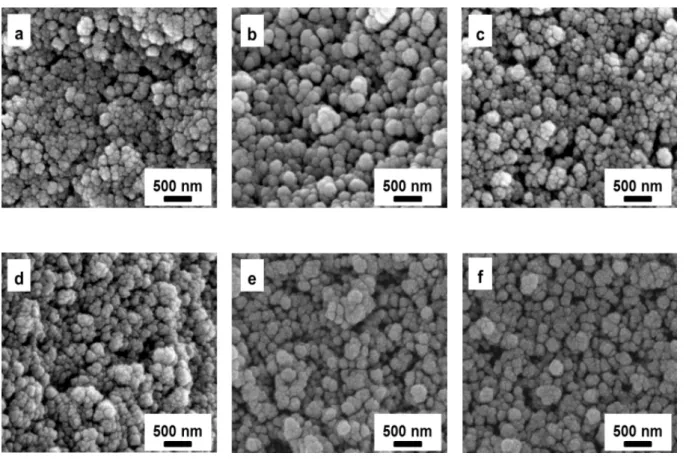
Figure S2. SEM images of ambient dried silica aerogels aged at 65°C for 6 aging times (a) 2 hrs. (b) 4 hrs. (c) 6 hrs. (d) 8 hrs. (e) 16 hrs. (f) 24 hrs.
4
Nitrogen sorption isotherms
Figure S3. Influence of aging time on the nitrogen sorption isotherms of silica aerogel aged at (a) 55°C and (b) 75°C. The arrows indicate the increase in aging time.
5
Figure S4. Influence of aging temperature on the nitrogen sorption isotherms of silica aerogel aged for (a) 2 hours and (b) 24 hours.
6
ATR-FTIR spectra
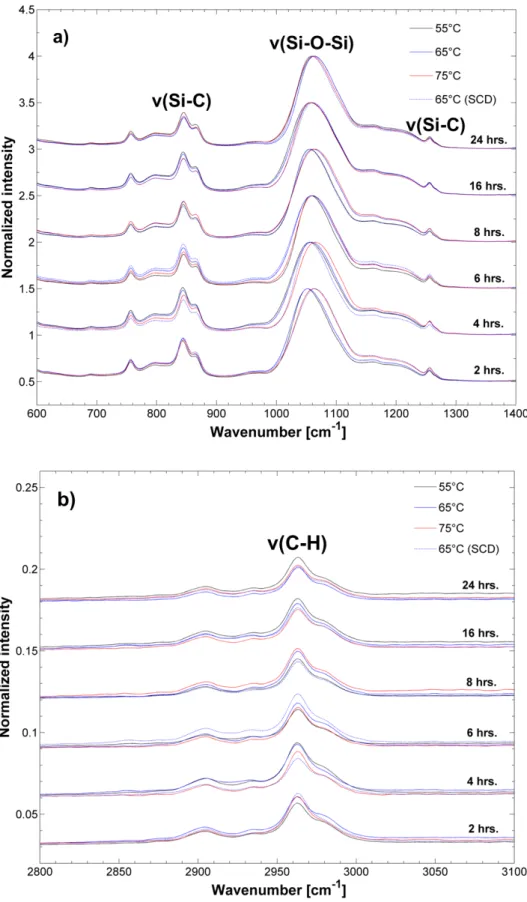
Figure S5. ATR-FTIR spectra of ambient dried silica aerogels aged at 65°C at 6 aging times (a) Si-C; Si-O-Si region and (b) C-H region.
7
NMR data
8
Figure S7. Surface modification of ambient dried silica aerogels aged at 65°C as a function of aging time expressed as (a) mmol/g, and (b) molecules/nm2.
9
Table S1. Surface modification of ambient dried silica aerogels aged at 65°C as a function of aging time.
Concentration (mmol/g) Surface coverage (molecules/nm2) Aging time (hrs.) SBET (m2/ g) TMS Ethoxy CH3 peak Ethoxy CH2 peak TMS Ethoxy CH3 peak Ethoxy CH2 peak 2 901 3.01 ± 0.15 1.40 ± 0.14 1.47 ± 0.14 2.01 ± 0.1 0.93 ± 0.1 0.99 ± 0.1 4 890 2.96 ± 0.15 1.49 ± 0.15 1.39 ± 0.14 2.01 ± 0.1 1.01 ± 0.1 0.94 ± 0.1 6 883 2.85 ± 0.14 1.41 ± 0.14 1.50 ± 0.15 1.94 ± 0.1 0.96 ± 0.1 1.02 ± 0.1 8 858 2.89 ± 0.14 1.22 ± 0.12 1.34 ± 0.13 2.03 ± 0.1 0.86 ± 0.1 0.94 ± 0.1 16 844 2.76 ± 0.14 1.50 ± 0.15 1.43 ± 0.14 1.97 ± 0.1 1.07 ± 0.1 1.02 ± 0.1 24 816 2.84 ± 0.14 1.34 ± 0.13 1.33 ± 0.13 2.10 ± 0.1 0.99 ± 0.1 0.98 ± 0.1
10
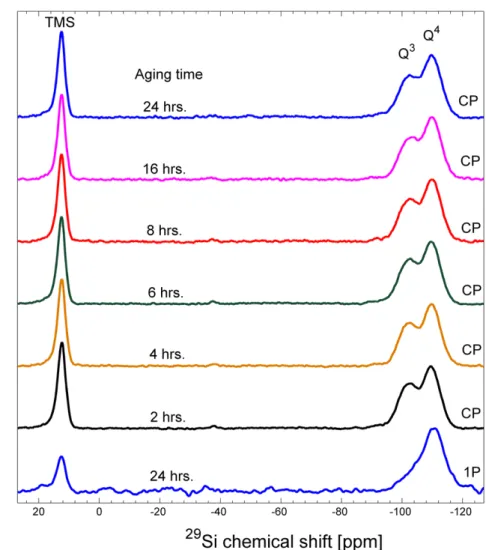
Figure S8. 1H-29Si cross polarization (CP) MAS NMR spectra of ambient dried silica aerogels aged at 65°C for 6 aging times and the quantitative 1H-29Si single pulse (1P)
MAS NMR spectrum of ambient dried silica aerogel aged at 65°C for 24 hours.
Note that cross polarization from 1H enhances the relative signal intensity for the TMS and Q3 relative to Q4 as the former are in closer proximity to hydrogen from the TMS, ethoxy or silanol groups and as a result, the 1H-29Si CP spectra selectively amplify the
TMS and Q3 signal compared to its abundance. Nevertheless, the observed trends in the Q3/Q4 peak area ratios between different samples are indicative of real variations in the Q3 content as all spectra were collected with the same CP conditions.
11
Figure S9. Gaussian fits to the Q3 and Q4 region of the 1H-29Si cross polarization (CP) MAS NMR spectra of ambient dried silica aerogels aged at 65°C for 6 aging times. The dots denote the experimental data; the lines correspond to the fitting envelope, fitted components and fit residual.
12
SAXS spectra
Figure S10. SAXS spectra as a function of the momentum transfer vector q of
supercritically dried (SCD) silica aerogels aged at 65°C for 6 aging times, indicated in the legends.
13
Figure S11. SAXS spectra as a function of the momentum transfer vector q of ambient dried silica aerogels aged at (a) 55°C and (b) 75°C, measured at aging times indicated in the legends.
14
Figure S12. SAXS spectra as a function of the momentum transfer vector q of ambient dried silica aerogel aged at 55°C for 4 hrs. The solid line denotes the experimental data; the dashed line corresponds to the fit of the scattered intensity experimental data by using the model (Main text, Equation 3-4).
15
Elemental analysis
Table S2. Elemental analysis of ambient dried silica aerogels for different aging times and temperatures. Aging time (hrs.) Carbon (%) Hydrogen (%)
Aging temperature - 55°C (APD) 2 15.39 ± 1.0 3.94 ± 0.5 4 14.56 ± 1.0 3.65 ± 0.5 6 14.55 ± 1.0 3.69 ± 0.5 8 14.03 ± 1.0 3.65 ± 0.5 16 13.85 ± 1.0 3.39 ± 0.5 24 14.05 ± 1.0 3.59 ± 0.5 Aging temperature - 65°C (APD)
2 14.87 ± 1.0 3.37 ± 0.5 4 15.13 ± 1.0 3.34 ± 0.5 6 14.20 ± 1.0 3.50 ± 0.5 8 14.01 ± 1.0 3.39 ± 0.5 16 14.02 ± 1.0 3.37 ± 0.5 24 13.54 ± 1.0 3.20 ± 0.5 Aging temperature - 75°C (APD)
2 14.10 ± 1.0 3.68 ± 0.5 4 14.26 ± 1.0 3.64 ± 0.5 6 14.10 ± 1.0 3.55± 0.5 8 14.10 ± 1.0 3.60 ± 0.5 16 13.86 ± 1.0 3.37 ± 0.5 24 13.56 ± 1.0 3.24 ± 0.5
16
Rheology data
Figure S13. (a) Storage modulus (G') and (b) Loss modulus (G'') of silica alcogels aged at 65°C at different deformation strains for 6 aging times.