Measurement of Converting Enzyme Activity
by Antibody-Trapping of Generated
Angiotensin II
Comparison With Two Other Methods
Jurg Nussberger, Dorette Brunner, Irene Keller, and Hans R. Brunner
Activity of the angiotensin converting enzyme (ACE) is usually measured in vitro by estimation of products cleaved by the enzyme from synthetic substrates. These substrates have affinities for ACE different from the natural substrate angiotensin I, and insensitive detection systems necessitate milli-molar substrate concentrations while physiological angiotensin I concentrations are in the picomolar range.
A new assay for ACE activity measurement was developed which reliably quantitates femtomoles of generated angiotensin II in plasma from angio tensin I added at a 17 pmol/mL concentration. The production of high affinity monoclonal antibodies against angiotensin II (Kd = 7 X 1 0 "1 1 mol/L) al
lowed a quantitative trapping (and thus protection from degrading enzymes) of angiotensin II gener ated during the incubation step and subsequent ra dioimmunoassay by simple dilution with labelled angiotensin II.
Using 40 //L plasma, the detection limit was 20
fmol/mL/min. Normal human plasma has an ACE activity of 335 ± 83 fmol/mL/min (mean ± SD). Precision was characterized by coefficients of varia tion of ^ 11% both within-assay and between-assays. Accuracy of the new method was estab lished by comparing ACE activity with the ratio of plasma angiotensin II/angiotensin I in plasma ob tained from normal volunteers 0.5 to 24 h after oral administration of 20 mg enalapril. The percentage of ACE inhibition indicated by both methods was almost identical (r = 0.93, η = 60, Ρ < .001). Since the latter ratio appears to reflect in vivo ACE activ ity, these results indicate that accurate measure ment in vitro of ACE activity in vivo has been achieved. Am J Hypertens 1992;5:393-398
KEY WORDS: Angiotensin converting enzyme inhi bition, antibody-trapping assay, monoclonal anti bodies, plasma angiotensin II/angiotensin I ratio, enalapril, accuracy, precision.
I
n vitro measurement of the enzyme activity of an giotensin converting enzyme (ACE) in plasma and other biological samples is based on cleavage of synthetic substrates by the ACE. Products cleaved from these substrates under standardized reaction con ditions are quantitated in order to estimate ACEReceived February 4, 1991. Accepted December 10, 1991. From the Division of Hypertension, University Hospital, Lausanne, Switzerland.
Address correspondence and reprint requests to Jurg Nussberger, MD, Division of Hypertension, CHUV, 1011 Lausanne, Switzerland.
activity.1"3 Over the last two decades, ACE inhibiting
drugs became available and today are widely used for the treatment of hypertension and congestive heart fail ure. Plasma ACE activity is measured for drug mon itoring in patients treated with ACE inhibitors and the conventional methods used so far provided well-repro ducible results. However, in contrast to such consist ency in measurement (precision), absolute ACE activi ties were found to differ considerably (accuracy) when measured in a given plasma with different methods.4
pending on which particular ACE inhibitor is moni tored. This is necessary to obtain the appropriate paral lelism between results in vivo and in vitro.4 The
inaccuracy of conventional methods may be caused by several factors: first, the substrates used are chemically different from the natural substrate angiotensin I; sec ond, the insensitive detection systems used to quantitate products cleaved by ACE from these substrates necessi tate very high substrate concentrations (millimolar); and third, the dilution of biological samples in vitro induces reaction conditions that are different from those in vivo. The present paper introduces a new and accurate method of measurement of ACE activity that overcomes the above-mentioned difficulties. Plasma ACE activity is estimated in minimally diluted specimens, using the
7 η 5 -T r a p p e d Angiotensin II (pmol / ml)
3H
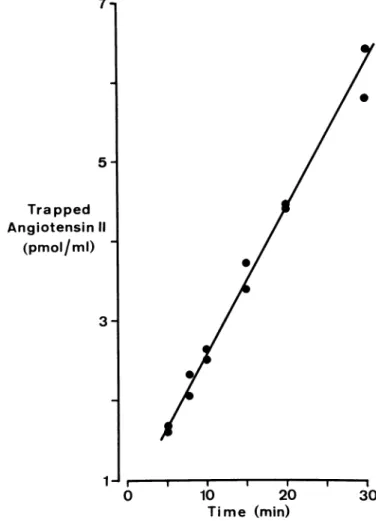
1J ι 1 1 1 1 1 1 0 10 2 0 3 0 T i m e (min)FIGURE 1. Linearity of generation of angiotensin II in a plasma sample incubated at 37°C: generated angiotensin II is trapped by added high affinity monoclonal antibodies and protected against enzymatic degradation. Subsequent dilution makes it possible to quantitate angiotensin II radioimmunologically by using these antibodies.
concentrations after ACE inhibition). Femtomoles of generated angiotensin II are trapped by specific high affinity monoclonal antibodies and thus protected from degradation by angiotensinases during the incubation step. The same antibodies are subsequently used for quantitation by radioimmunoassay.7
METHODS
Study Protocol Ten normal human volunteers aged 20 to 28 years (body weight 63 to 85 kg) participated in the study. On the study day, they came to the hospital at 7 AM and were installed in the supine position. At 8 AM, the subjects ingested 20 mg enalapril, an inhibitor of angio tensin converting enzyme. Venous blood samples were collected before (time 0) and at 0.5, 1, 2, 4, 8, and 24 h after enalapril intake. Subjects remained in the supine position for 1 h prior to blood sampling and no food intake was permitted for the 3 h prior to sampling. Blood Sampling For the measurement of ACE activity, blood samples (5 mL) were collected from the antecubi-tal vein into prechilled glass tubes containing heparin (56 USP) and 25 //L renin inhibitor CGP 29287 (Ciba-Geigy, Basel, Switzerland) at a concentration of 1 mmol/L water. Blood was centrifuged at 4°C and 2000 g for 10 min and plasma aliquots of 0.5 mL were snap frozen in liquid nitrogen and stored at — 70 ° C until analyzed.
For the measurement of Ang II8 and immunoreactive
Ang I,9 another 10 mL blood were collected on an inhibi
tor cocktail containing EDTA and renin inhibitor to pre vent degradation and generation of these peptides in vitra. Samples were centrifuged at 4°C and plasma ali quots of 2.2 mL snap frozen and stored as described above.
Material Monoclonal antibodies against angiotensin II were produced by the somatic cell fusion technique1 0 as
previously described in detail.1 1 However, we used SP
2 / 0 myeloma cells and spleen lymphocytes of a C3H mouse hyperimmunized with Ang II coupled to bovine thyroglobulin.1 2 For the measurement of ACE activity, a
high-affinity monoclonal angiotensin II antibody (Kd =
7 Χ 1 0 ~n mol/L) of the IgGl class was used which
cross-reacted with the carboxyterminal fragments of Ang II at 75 to 105% and less than 1% with Ang I and aminoterminal fragments. No cross-reaction (below 10~6 %) was found with angiotensinase inhibitors such
as tripotassium ethylenediaminetetraacetate (EDTA, purchased from Fluka, Buchs, Switzerland) or bacitracin (Grossman Pharmaca, Basel, Switzerland).
The albumin buffer consisted of a 0.1 mol/L Tris buffer (Sigma, St. Louis, MO) containing 5 g/L heat-in activated bovine serum albumin (Sigma), 20 mmol/L
AJH-JUNE 1992-VOL. 5, NO. 6, PART 1 ACE MEASUREMENT BY TRAPPING ANGIOTENSIN II 395
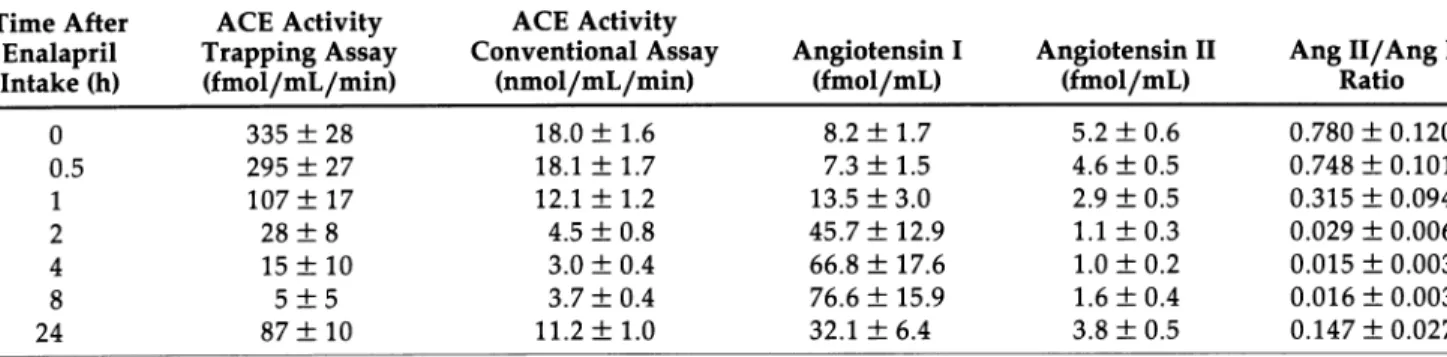
TABLE 1. PLASMA CONVERTING ENZYME ACTIVITY AND ANGIOTENSIN CONCENTRATIONS IN HEALTHY HUMANS AFTER A SINGLE ORAL DOSE OF 20 mg ENALAPRIL (MEAN ± SEM, η = 10) Time After ACE Activity ACE Activity
Enalapril Trapping Assay Conventional Assay Angiotensin I Angiotensin II Ang 11/Ang I
Intake (h) (fmol/mL/min) (nmol/mL/min) (fmol/mL) (fmol/mL) Ratio
0 335 ± 28 18.0 ± 1.6 8.2 ± 1.7 5.2 ± 0 . 6 0.780 ±0.120 0.5 295 ± 27 18.1 ± 1.7 7.3 ± 1.5 4.6 ± 0 . 5 0.748 ±0.101 1 107 ± 17 12.1 ± 1.2 13.5 ± 3 . 0 2.9 ± 0.5 0.315 ± 0.094 2 28 ± 8 4.5 ± 0 . 8 45.7 ± 12.9 1.1 ± 0 . 3 0.029 ± 0.006 4 15 ± 10 3.0 ± 0 . 4 66.8 ± 17.6 1.0 ± 0 . 2 0.015 ± 0.003 8 5 ± 5 3.7 ± 0 . 4 76.6 ± 15.9 1.6 ± 0 . 4 0.016 ±0.003 24 87 ± 10 11.2 ± 1.0 32.1 ± 6 . 4 3.8 ± 0 . 5 0.147 ±0.027
bacitracin, and 200 mg/L sodium azide (Merck, Darm stadt, Germany). The pH was adjusted to 7.5 at room temperature. Angiotensin I and angiotensin II standard peptides were purchased from Peninsula Labs (St. Helens, Merseyside, England). 1 2 5I-Ang II was obtained
from New England Nuclear Inc. (Boston, MA). Measurement of Plasma ACE Activity All proce dures were done in an ice-water bath unless stated otherwise. Plasma was thawed and centrifuged at 4°C and 40 supernatant was pipetted into a small poly propylene tube. We added 10 μΙ., monoclonal antibody (mouse ascites diluted 1:8400 in 3 mol/L Tris buffer at pH 7.3). We added 1 pmol angiotensin I in 10 //L albu min buffer. For blank determination, a duplicate 40 //L plasma sample was processed identically, but the albu min buffer contained in addition to angiotensin I also EDTA at a 0.2 mol/L concentration. After mixing and cold centrifugation in order to concentrate the mixture at the bottom of the tube (1 min at 2000 g) samples were incubated in a water bath at 37°C for 20 min. Incuba tion was stopped by returning the samples to the ice-water bath. We added 40 //L albumin buffer without/ with 0.05 mol/L EDTA to blanks/samples in order to equalize conditions. Each tube (total 100 μΐ) finally re ceived 1 mL albumin buffer containing 1 fmol 1 2 5I-Ang
II (2000 counts/minute) and EDTA at 0.02 mol/L con centration. After a 24 h incubation at 4°C, antibody-bound and free Ang II were separated by adding 0.3 mL water containing 2% dextran-coated charcoal, mixing for 10 min, centrifuging at 4°C (for 20 min at 6000 g), and decanting the supernatant. Supernatant and pellet were counted in a ten-well scintillation counter (Gam-mamaster, Wallac, Turku, Finland) and generated Ang II was read from a simultaneously established standard curve.
For the standard curve, increasing amounts of unla b e l e d Ang II ranging from 16 to 4000 fmol in 40 //L albumin buffer were added to 40 /iL pooled plasma that contained unmeasurably low endogenous Ang I and Ang II and renin inhibitor CGP 29287 at a 0.01 mmol/L concentration; we added antibody in a 3 mol/L Tris
buffer (10 μΐ) and 1000 fmol Ang I in EDTA-albumin buffer (10 //L) in order to obtain conditions identical to the unknown samples. Plasma ACE activity was also measured by an established method using as substrate synthetic carbobenzoxy-Phe-His-Leu at 1.8 mmol/L concentration.3 , 4 The ratio of the plasma concentrations
Ang II/Ang I was used for estimation of ACE activity "in vivo".6
RESULTS
Characteristics of Trapping-Assay for Plasma ACE Activity Sensitivity The present assay is optimized for a final dilution of the monoclonal antibody at 1:924,000. The smallest amount of unlabelled Ang II (16 fmol/tube) added to the standard curve results in antibody-binding of 50% of the tracer angiotensin. This is more than two standard deviations less than tracer binding in the absence of unlabelled Ang II. Thus, the smallest possible amount of Ang II that can be read from the standard slope is 16 fmol. The theoretical detection limit for ACE activity in a 40 μΐ, plasma sample that was incubated for 20 min at 37°C is 20 fmol/mL/min (16 X 25/20). The actual detection limit is zero, since EDTA-blanks may contain more than 16 fmol Ang II and these blanks are subtracted from Ang II generated during the incubation.
Specificity ACE is a relative unspecific enzyme since it
cleaves substrates other than Ang I, such as bradykinin or substance P. The present assay measures specifically Ang II (carboxyterminal-specific monoclonal antibody) and uses Ang I as substrate under conditions in vitro approaching those found in vivo. Endogenous Ang II is subtracted as well as Ang II generated in plasma despite renin inhibition and ACE inhibition by EDTA (blanks).
Precision Within-assay precision was determined by
repeated measurement within a single assay of plasma aliquots containing low, intermediate, or high ACE ac tivity (n = 10 each). The results were (mean ± SD) 87.3 ± 9.4 fmol/mL/min, 144.9 ± 9.2 fmol/mL/min, 205.5 ± 13.9 fmol/mL/min, and 389.0 ± 21.3 fmol/ mL/min, respectively. The corresponding coefficients
ι ι 1 ι 1 1 1 1 1 I I I I
Ο 0.6 1.2
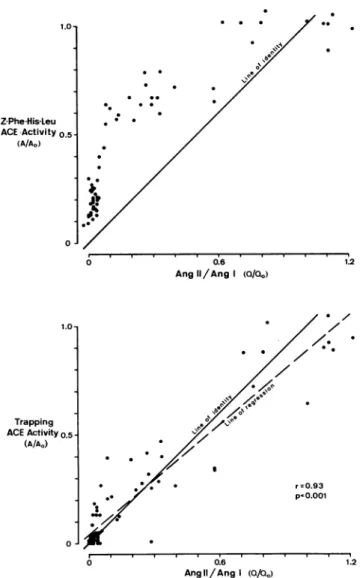
A n g I I / A n g I (Q/QG)
FIGURE 2. Assessment of converting enzyme (ACE) inhibition
in vitro (ordinate) and in vivo (Ang II/Ang I): ACE activity in the plasma of 10 normal men up to 24 h after ingestion of 20 mg enalapril (n = 60). In vitro measurement by conventional proce dure using carbobenzoxy-Phe-His-Leu (Z-Phe-His-Leu) as sub strate (upper panel) underestimated ACE inhibition, whereas the new trapping method (lower panel) indicated similar ACE activ ity in vitro (A) as estimated in vivo (Q) by the ratio of plasma angiotensin II to angiotensin I. Plasma ACE activity before enala pril ingestion is A0 in vitro and Q0 in vivo.
of variation (CV) for within-assay precision were 10.8%, 6.4%, 6.8%, and 5.5%. Similarly, a plasma was analyzed on 24 different days and it was found to con tain an ACE activity of 228.6 ± 24.9 fmol/mL/min, ie, a CV for between-assay precision of 10.9%.
Normal Values Plasma ACE activity in 22 normal
human subjects was found to be 334.7 ± 82.9 fmol/ mL/min (mean ± SD) with a range between 178 and 475.
Results are shown in Figure 1: there was a good linearity throughout the entire test period.
Accuracy of Trapping Assay Table 1 shows the effect of a single oral dose of 20 mg enalapril in 10 volunteers on plasma ACE activity, plasma levels of Ang I and Ang II, and the ratio of plasma Ang II to Ang I. All parameters reached peak effects at 4 and 8 h after enalapril adminis tration. The ACE results obtained with the trapping method were well correlated with those obtained by the conventional method (r = 0.95, Ρ < .001). Convention ally measured ACE activity was related to but different from the plasma angiotensin II/angiotensin I ratio (Fig ure 2, upper panel). In contrast, the results of the trap ping method (y)—unlike conventionally obtained results — are virtually identical with ACE activity in vivo (x): y = 0.82x + 4.64 (Figure 2, lower panel).
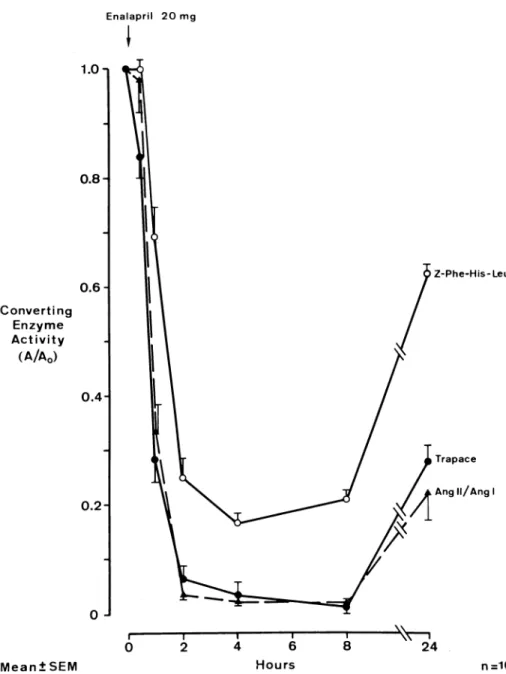
Measured ACE activities were expressed for every subject as a percent of baseline ACE activity and means ± SEM were calculated for each time point (Fig ure 3). In vivo ACE activity (ratio of plasma Ang II to Ang I) reached minima at 4 and 8 h after enalapril intake of 2.1 ± 0.3 and 2.0 ± 0.4%. On the following morning (24 h) in vivo ACE activity was still only 21.9 ± 5.0%. This was in excellent agreement with ACE activities measured in vitro with the trapping assay: 3.6 ± 2.4, 1.3 ± 1.3, and 27.4 ± 3.4%. In contrast, the conven tional method for ACE activity measurement in vitro provided different results: at 4, 8, and 24 h after enala pril administration, plasma ACE activities were found to be at 16.5 ± 1.7, 20.8 ± 1.7 and 62.6 ± 1.6% of pre treatment values.
DISCUSSION
Accuracy of test results is a key issue for comparing the biochemical effects of different drugs of the same class of therapeutic agents. Most studies involving ACE inhib itors so far were endorsed by the established measure ment of plasma ACE activity using a high concentration of substrates with more or less affinity for the A C E .1 - 3
Recently, studies comparing the effects of different ACE inhibitors in normal volunteers provided evidence for the clear dependency of results on methods used for ACE measurement and the need for reliable measure ment of plasma angiotensin I and II has been empha sized.4 , 6 Therefore an assay was developed which could
accurately reflect ACE activity (and ACE inhibition) as found in the living organism and which would allow us to compare the efficacy of different ACE inhibitors. The present paper confirms our hypothesis that ACE activity
AJH-JUNE 1992-VOL 5, NO. 6, PART 1 Enalapril 2 0 mg
ι
Converting Enzyme A c t i v i t y ( A / A0) M e a n + SEM Hoursmeasured in vitro under more "physiological" condi tions is virtually identical with ACE activity in vivo.
In our volunteers, the ratio of plasma Ang II and Ang I was used to estimate in vivo ACE activity. Activity de creased by 98% at peak inhibition and returned to 22% ACE activity at 24 h. Very similar results were obtained for plasma ACE activity measured in vitro with the new method based on trapping by monoclonal antibodies of generated Ang II (decrease by 99% at peak inhibition and return to 27% ACE activity at 24 h). In contrast, the conventional method of ACE activity estimation pro vided different results: peak ACE inhibition with only 83% decrease from baseline and a substantial return towards baseline with 66% ACE activity at 24 h. Thus, the new method of ACE activity measurement provided more accurate results than the established method, if the
ACE MEASUREMENT BY TRAPPING ANGIOTENSIN II 397
FIGURE 3. In vivo (dashed line)
and in vitro (solid lines) plasma con verting enzyme (ACE) activity in 10 normal men before and up to 24 h after ingestion of 20 mg enalapril In vivo ACE activity was estimated by the ratio of plasma angiotensin II to angiotensin I (Ang II/Ang I). In vitro measurement using the new trapping assay (Trapace, filled circles)gave vir tually identical results as those mea sured in vivo. Conventional measure ment of ACE activity in vitro using the substrate carbobenzoxy-Phe-His-Leu (Z-Phe-carbobenzoxy-Phe-His-Leu, open cir cles) underestimated ACE inhibition.
η =10
ratio of plasma Ang II/Ang I is accepted as a standard. Our results were obtained in subjects treated with ena lapril. Further experience must now be gained with other ACE inhibitors. Changes in endogenous angio tensin I concentration may have different impacts de pending on the ACE inhibitor used. The effect of the relationship between plasma and tissue ACE inhibition with different inhibitors remains to be established. If this method were to be adapted for measurement of ACE activity in tissues, serine protease inhibitors would have to be added during the incubation step to prevent angiotensin II generation by enzymes other than ACE. The new method of ACE activity measurement in vitro compares favorably with established procedures: femtomoles rather than nanomoles can be detected, which may be helpful in comparing the peak effects of
Ang II and the natural substrate Ang I is used under conditions in vitro approaching those found in vivo. In comparison, conventional methods use diluted plasma and extremely high concentrations of substrates with affinities that are different from that of Ang I. Conven-tional methods may therefore, in the presence of high-affinity ACE inhibitors, lead to underestimation or overestimation of ACE inhibition. The Ang I concentra-tion in almost undiluted plasma of the trapping assay is sufficient to warrant linearity of the Ang II production during the incubation step as demonstrated in Figure 2. The precision of the trapping method is not better than that of the conventional techniques, but coefficients of variation below 1 1 % for both within- and between-as-say precision certainly demonstrate the validity of the new procedure. The high accuracy appears to be a major advantage of the trapping method. Finally, equipment needed for the new procedure is that of a routine radio-immunoassay laboratory including a y-counter. Mono-clonal antibodies and labelled and unlabelled angioten-sins are or will be commercially available.
In conclusion, we have introduced a reliable and accu-rate new method for the measurement of plasma ACE activity that is based on the trapping of generated Ang II during the enzymatic reaction by high-affinity monoclo-nal antibodies which are subsequently used to quanti-tate the peptide by radioimmunoassay.
REFERENCES
1. Cushman DW, Cheung HS: Concentrations of angioten-sin converting enzyme in tissues of the rat. Biochem Biophys Acta 1971;250:261-265.
3. Piquilloud Y, Reinharz A, Roth M: Studies on the angio-tensin converting enzyme with different substrates. Bio-chem Biophys Acta 1970;206:136-142.
4. Juillerat L, Nussberger J, Menard J, et al: Determinants of angiotensin II generation during converting enzyme inhi-bition. Hypertension 1990;12:87-92.
5. Giese J, Rasmussen S, Damkjaer MN, Ibsen H: Biochemi-cal monitoring of vasoactive peptides during angiotensin converting enzyme inhibition. J Hypertens 1983;l(suppl l):31-36.
6. Nussberger J, Juillerat L, Perret F, et al: Need for plasma angiotensin measurements to investigate converting en-zyme inhibition in humans. Am Heart J 1989;117:717-722.
7. Poulsen K, Jorgensen J: An easy radioimmunological mi-croassay of renin activity, concentration and substrate in human and animal plasma and tissues based on angio-tensin I trapping by antibody. J Clin Endocrinol Metab 1974;39:816-825.
8. Nussberger J, Brunner DB, Waeber B, Brunner HR: True versus immunoreactive angiotensin II in human plasma. Hypertension 1985;7(suppl I):I1-I7.
9. Nussberger J, Brunner DB, Waeber B, Brunner HR: In vitro renin inhibition to prevent generation of angioten-sins during determination of angiotensin I and II. Life Sci 1988;42:1683-1688.
10. Kohler G, Milstein C: Continuous cultures of fused cells secreting antibody of predefined specificity. Nature 1975;256:495-497.
11. Nussberger J, Mudgett-Hunter M, Matsueda GR, Haber E: A monoclonal antibody specific for the carboxy-ter-minus of angiotensin II. Hybridoma 1984;3:373-376. 12. Nussberger J, Matsueda GR, Re R, Haber E: Selectivity of
angiotensin II antisera. J Immunol Methods 1983;56:85 -96.