Ameliorating the Overhead of Dynamic
Optimization
Qin Zhao, Weng-Fai Wong
Singapore-MIT Alliance, National University of Singapore
Abstract— Dynamic optimization has several key advantages.
This includes the ability to work on binary code in the absence of sources and to perform optimization across module boundaries. However, it has a significant disadvantage viz-a-viz traditional static optimization: it has a significant runtime overhead. There can be performance gain only if the overhead can be amortized. In this paper, we will quantitatively analyze the runtime overhead introduced by a dynamic optimizer, DynamoRIO. We found that the major overhead does not come from the optimizer’s operation. Instead, it comes from the extra code in the code cache added by DynamoRIO. After a detailed analysis, we will propose a method of trace construction that ameliorate the overhead introduced by the dynamic optimizer, thereby reducing the runtime overhead of DynamoRIO. We believe that the result of the study as well as the proposed solution is applicable to other scenarios such as dynamic code translation and managed execution that utilizes a framework similar to that of dynamic optimization.
Index Terms— Dynamic Optimization, DynamoRIO, overhead,
Indirect Jump.
I. INTRODUCTION
M
ODERN software engineering enable us to construct complex software by componentization and hierarchi-cal design. While reining in design complexity, the side effect of such an approach is the reduction of the efficacy of static optimizations. For example, separate compilation and dynamic linking allow us to divide a large software project into several smaller and simple components, maintaining them separately. However, within the smaller modules, opportunities for optimization is limited. The lack of global information further worsen the situation. Developments in programming languages and computer architectures also have an impact on traditional static optimization. For instance, the trend towards portable languages like Java widens the gap between the ap-plication program and the hardware. The introduction of new architectures means that legacy code have to be recompiled if they are to benefit from the new features offered by these new architectures. However, the source code of these applications may not be easily recompilable given new operating system versions or may not even be available.In response to these obstacles and problems, dynamic op-timization, a novel technology that complements traditional static optimization has been proposed. Dynamic optimization is a technique that collects information about a program’s execution behavior at runtime, and accordingly performs op-Qin Zhao and Weng-Fai Wong is with Singapore-MIT Alliance, National University of Singapore. Email: zhaoqin, [email protected]
timization on the fly. There are several key advantages to dynamic optimization.
Firstly, the optimization opportunities available to dynamic optimization are different and possibly more than that for static optimization. Due to the difficulty in predicting a program’s runtime behavior during static analysis, there are optimization opportunities that only manifest themselves at runtime and cannot be exploited at compile time.
Secondly, dynamic optimization works on binary code, making it possible to optimize legacy binaries whose source code are no longer available. Furthermore, working on the binary code help protect the original program’s intellectual property rights.
Thirdly, dynamic optimization can cross the boundaries between the dynamically linked libraries (dll) and the ap-plication’s modules. This further enlarges the scope of the optimization.
Fourthly, dynamic optimization can adapt to different situa-tions with different optimization strategies. Few optimizasitua-tions can guarantee performance improvement without possible negative side effects. Utilizing runtime information, dynamic optimization can make decisions with reasonable tradeoffs.
Finally, dynamic optimization can take advantage of machine-specific features, such as more registers, multipro-cessor, and implementation-specific cache parameters. Legacy programs as well as programs written in portable languages like Java can have a significant semantics gap between appli-cation programs and the machines that run them. Often such applications cannot benefit from the power of a new machine. Dynamic optimization can offer a client-side performance improvement mechanism that allows the hardware system vendors to provide performance enhancement features without the software vendors’ involvement.
Although dynamic optimization has many advantages, it has a significant disadvantage that has thus far prevented its widespread adoption: the runtime overhead. Dynamic op-timization performs profiling and opop-timization at the same time as the application executes. This overhead of dynamic optimization can significantly affect performance and has to be amortized over the lifetime of the application’s execution before any performance improvement can be achieved. Fur-thermore, due to the high overhead, dynamic optimization can-not use detailed profiling to obtain accurate information. This can limit the precision and effectiveness of optimizations. In addition, due to the overhead, only light-weight optimizations can be applied.
identifying the runtime overhead caused by dynamic optimiza-tion. Armed with the insight about the source of the overhead, we can hopefully alleviate the situation. The remainder of the paper is organized as follows. Section 2 analyzes the runtime overhead in DynamoRIO, and in Section 3 we will propose our solution for reducing the overhead and discusses its implementation on DynamoRIO. In Section 4, we present the performance evaluation of our solution comparing them with the original DynamoRIO as well as native execution using best effort compiler optimized code. Section 5 surveys some related works. This is followed by the conclusion.
II. THEOVERHEAD INDYNAMO-RIO
DynamoRIO [3] is a dynamic optimization system for the Intel x86 architecture developed by MIT and HP. It evolved from Dynamo [2], which is a dynamic optimization system running on the HP-PA architecture. DynamoRIO inherited a number of techniques and strategies from Dynamo.
A. DynamoRIO Framework
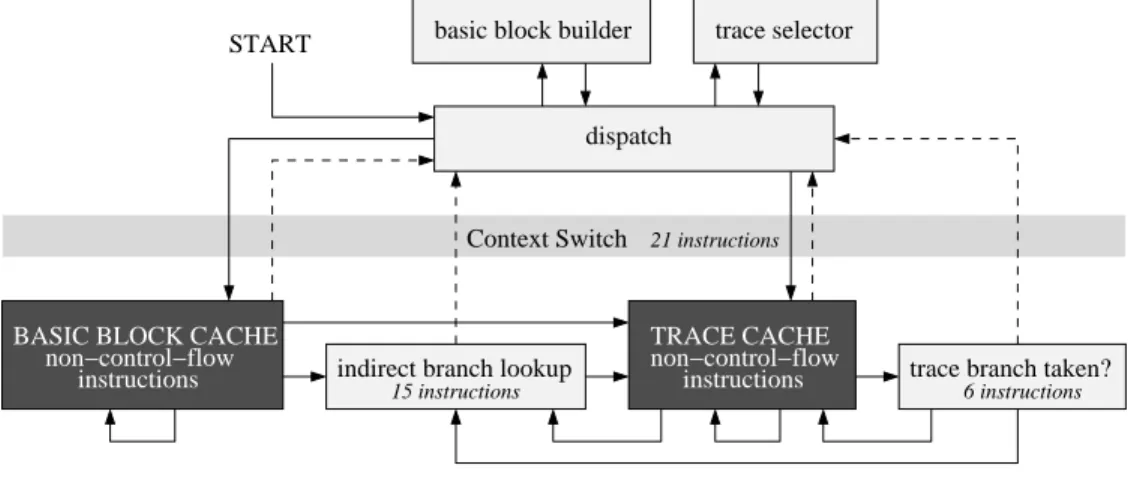
The Intel IA-32 instruction set has few registers, which translates to higher overhead during interpretation but rela-tively lower context switching cost. DynamoRIO “interprets” the application by copying the code into a cache and executes from there. Fig. II-A is the flow chart showing the operation of DynamoRIO.
The dark shaded areas indicate where the application code is put and the rest is the DynamoRIO system. DynamoRIO first gains control from the application to be optimized, and from that point, the whole application runs under its control. The dispatcher is the main control of DynamoRIO and it will decide what action to take and orchestrates the interaction between the original program and the runtime system. Appli-cation code is first copied into the basic block cache in units of basic blocks, and the application executes there. Targets of backward branches and trace exits are identified as trace heads. Each trace head is associated with a counter to record its execution frequency. When a counter exceeds a threshold, DynamoRIO enters the trace creation mode. In this mode, it starts building up the trace until a backward branch is taken, or another trace is reached. The trace head and subsequently executed basic blocks form a trace fragment and is copied into trace cache. There are several potential exits at a joint of the basic blocks in the trace. Indirect branch are inlined with checking code to ensure only the matched target is continued. In the following two subsections, we will first analysis where the potential overhead are in DynamoRIO, and what DynamoRIO do to keep reduce the overhead. Using experi-ments, we will identify the major source of overhead. B. Overhead and Solutions in DynamoRIO
1) DynamoRIO Operation: One obvious source of over-head is DynamoRIO’s operations, including the construction of basic blocks, selection and construction of traces, and the dispatcher’s operation.
• Construction of basic blocks. Because only code in the caches are executed, DynamoRIO needs to identify basic
blocks and copy them from the original application code segment into the basic block cache before executing them. To reduce the decoding overhead, DynamoRIO does not decode instructions in its entirety but only decode enough to identify if the instruction is a control transfer instruction (CTI), and only CTIs will be decoded fully so as to locate the target. Besides decoding and copying, DynamoRIO also needs to mangle the control transfer instructions to maintain control over the application. The CTI target is changed to an exit stub, which will be discussed later.
• Selection and construction of traces. DynamoRIO moni-tors the application’s execution by counting the number of times trace heads are executed. The trace creation mode is entered when a trace head counter exceeds a certain threshold. While constructing a trace, DynamoRIO does not select the path based on the execution frequency. Instead, it just follows the current execution flow in extending the trace. This is based on the heuristic that the current execution flow being extended is likely to be a frequently executed path. Because the target of indirect branches may change later, comparisons are added before extending beyond the current target, so that execution will leave the trace if the target turns not to match the target assumed when the trace was created.
The standard DynamoRIO system does not perform any further optimization beyond putting traces into the trace cache. DynamoRIO, however, provides APIs for implementing optimizations. Bruening, Garnett and Ama-rasinghe [4] implemented and evaluated several light weighted optimization like strength reduction using these APIs.
In summary, the overhead can be reduced at the price of less accurate profile information and fewer optimizations. • The dispatcher’s operation. Whenever control is trans-ferred to the dispatcher, DynamoRIO will check if the target fragment is in cache, and transfers control to the target fragment if it is found. Otherwise, a new basic block is constructed in the basic block cache and executed. In addition, DynamoRIO will link up those code fragments built. Again, this will be discussed later. There could be thousands of basic blocks and traces during the program execution, making it necessary to maintain a large table for searching and linking code frag-ments. Hashing is used to make the searching efficient. 2) Context Switch: The second source of overhead comes from the context switches between executing in DynamoRIO and executing the application code in the code cache. The ma-chine context includes general purpose registers, theeflags
register, the stack, and the application error number.
Before executing the code in the cache, DynamoRIO’s context is saved and the application’s state is restored from a special area maintained by DynamoRIO. When a CTI in the application is encountered, a cache exit context switch is performed, and the application’s machine state is spilled and DynamoRIO’s state is restored.
Compared to basic block execution, the cost of a context switch is significant and may even be greater. To avoid
BASIC BLOCK CACHE non−control−flow instructions TRACE CACHE non−control−flow instructions Context Switch 21 instructions
trace branch taken? 6 instructions START
indirect branch lookup 15 instructions
basic block builder
dispatch
trace selector
Fig 1. Flow chart of the DynamoRIO infrastructure
frequent context switching, a technique called fragment linking is used in DynamoRIO. For a CTI having a direct target, DynamoRIO patches the CTI which originally targets the exit stub with a branch to the corresponding code fragment in the caches. For indirect branches such as procedure returns, DynamoRIO first performs an internal indirect branch lookup (IBL). If the target is found, control is transfered to the corresponding code in the caches. However, if it cannot find the target, there will be a context switch back to the dispatcher of DynamoRIO to perform basic block building.
There are two strategies to link up code fragments. In the lazy linking strategy, the first time any fragment executes a CTI, the context is switched to the DynamoRIO dispatcher which then proceeds to construct the target fragment in the basic block or trace cache, after which it will create a link between the source and the destination of the CTI. DynamoRIO however takes a more aggressive strategy of performing all possible links when a fragment is first created. The implementors found that the second aggressive approach yielded better performance.
3) Extra Code Injected by DynamoRIO: Besides the sources of overhead mentioned above, another source of overhead is the extra code injected into the application’s code residing in the caches.
To keep the application execution under its control, Dy-namoRIO modify the end of each basic block in cache to a jump to a piece of code called an exit stub. Each exit stub terminates with a jump to the exit context switch routine, which eventually transfers control back to the DynamoRIO dispatcher.
There are two types of exit stub, namely the direct exit stub and the indirect exit stub. Direct exit stubs are used for control transfer instructions having a direct target such as direct jumps, or direct procedure calls. It consists of only three instructions that will spill theeax, load the pointer to the exit stub table into the eax register, and a jump to the code for performing a context switch. Indirect exit stubs are used for those instructions having an indirect target such as procedure return. Before jumping into the indirect exit stub, the target is first stored into the ecxregister. In the indirect exit stub, the
TABLE I BENCHMARKS USED. Acronym SPEC Benchmark Input gzip1 164.gzip input.graphic
gzip2 164.gzip input.log
gzip3 164.gzip input.program
gzip4 164.gzip input.random
gzip5 164.gzip input.source
vpr1 175.vpr reference (place) vpr2 175.vpr reference (route) gcc1 176.gcc reference (166) gcc2 176.gcc reference (200) gcc2 176.gcc reference (expr) gcc2 176.gcc reference (integrate) gcc2 176.gcc reference (scilab) mcf 181.mcf reference
crafty 186.crafty reference
vortex1 255.vortex reference (lendian1) vortex2 255.vortex reference (lendian3) bzip1 256.bzip2 input.source bzip2 256.bzip2 input.graphic bzip2 256.bzip2 input.program
twolf 300.twolf reference
internal branch table is looked up. This hash table maintains addresses that hashed to the same bucket as linked lists. The first entry in the linked list is checked first as this is most likely to be the right match. If it is a match, control can then be transfered to the corresponding code fragment. Otherwise, control is transferred to the internal IBL code to search the entire linked list of the bucket to locate the target fragment. If target is found, the prefix code, which restores the spilled registers used in the exit stud, is executed before control is transfered to the target fragment. Otherwise, the cache exit context switch is performed and the DynamoRIO dispatcher takes over.
In summary, the runtime overhead in DynamoRIO comes from three sources: the operations of DynamoRIO, the context switches between DynamoRIO and the application, and IBL as well as other extra code injected by DynamoRIO into the application running in the caches. In the next section, we will quantify the relative importance of these sources before proposing a solution to alleviate the problem.
C. Overhead Analysis
Before proposing any method to improve the situation, we need to understand the relative importance of the overhead described above. In order to do this, we conducted a series of experiments with DynamoRIO. We do not have access to anything beyond what is publicly released by the DynamoRIO group, in particular the source code. We ran the experiments on a hyperthreaded 3 GHz Intel Pentium 4. The operating system is Linux Fedora Core 1 with recompiled perfctr
patch [16]. The memory hierarchy consists of a 12 KB L1 instruction cache (8-way associative), a 8 KB L1 data cache (4-way associative), and a 512 KB unified L2 cache (8-way associative). All of the results in this section are for the SPEC2000 benchmarks running on Linux. The details are shown in Table I. In all the experiments, the benchmarks were compiled with full optimization (gcc -O3). All the reported results are averaged over 3 runs. We shall call the straight-forward execution of the -O3 optimized application without DynamoRIO the “native execution”.
Table II gives the slowdown of execution under DynamoRIO compared to native execution. It is fairly obvious that a program that completes in a short period of time is not suitable for a dynamic optimizer like DynamoRIO. This was the case for 176.gccwithexpror integrateinputs. In these runs, the program exited before the code in the trace is executed long enough to offset the overhead introduced by DynamoRIO.
TABLE II
SLOWDOWN CAUSED BYDYNAMORIO. Bench. Native DynamoRIO Slowdown
(secs) (secs) (%) gzip1 31.819 38.676 21.550 gzip2 13.219 14.152 7.058 gzip3 49.045 53.389 8.857 gzip4 25.714 30.646 18.180 gzip5 27.358 29.767 8.805 mcf 231.708 234.492 1.202 vpr1 114.557 125.243 9.328 vpr2 109.600 110.498 0.819 gcc1 22.516 30.495 35.437 gcc2 39.567 64.474 62.949 gcc3 3.665 8.289 126.166 gcc4 4.248 8.432 98.493 gcc5 22.580 39.939 76.877 crafty 101.884 167.921 64.845 vortex1 51.336 87.743 70.919 vortex2 55.399 94.164 69.974 bzip1 58.096 61.247 5.424 bzip2 71.529 75.787 5.9528 bzip3 56.448 59.607 5.596 twolf 394.854 440.854 11.650
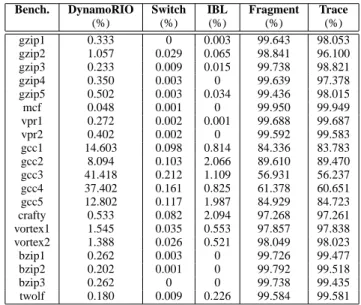
Table III shows the breakdown of each benchmark’s execu-tion time spent in different parts of DynamoRIO. The times were collected by using the PC sampling mechanism provided by DynamoRIO. In Table III, the columns ‘DynamoRIO’, ‘Switch’, ‘IBL’, ‘Fragment’, and ‘Trace’ represent the per-centage of time spent in DynamoRIO operations, context switching, internal branch lookup, executing in either caches, and executing only in the trace cache, respectively. Some other minor portions such as percentage of time spent in handling
system call or signal have been omitted. From the table, we can see that most of the time is spent in the trace cache, as it should be. This shows that DynamoRIO does a good job in keeping its own operations overhead low and avoiding frequent context switching.
TABLE III
BREAKDOWN OFEXECUTIONTIMEUNDERDYNAMORIO. Bench. DynamoRIO Switch IBL Fragment Trace
(%) (%) (%) (%) (%) gzip1 0.333 0 0.003 99.643 98.053 gzip2 1.057 0.029 0.065 98.841 96.100 gzip3 0.233 0.009 0.015 99.738 98.821 gzip4 0.350 0.003 0 99.639 97.378 gzip5 0.502 0.003 0.034 99.436 98.015 mcf 0.048 0.001 0 99.950 99.949 vpr1 0.272 0.002 0.001 99.688 99.687 vpr2 0.402 0.002 0 99.592 99.583 gcc1 14.603 0.098 0.814 84.336 83.783 gcc2 8.094 0.103 2.066 89.610 89.470 gcc3 41.418 0.212 1.109 56.931 56.237 gcc4 37.402 0.161 0.825 61.378 60.651 gcc5 12.802 0.117 1.987 84.929 84.723 crafty 0.533 0.082 2.094 97.268 97.261 vortex1 1.545 0.035 0.553 97.857 97.838 vortex2 1.388 0.026 0.521 98.049 98.023 bzip1 0.262 0.003 0 99.726 99.477 bzip2 0.202 0.001 0 99.792 99.518 bzip3 0.262 0 0 99.738 99.435 twolf 0.180 0.009 0.226 99.584 99.581
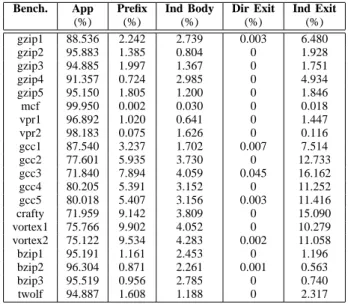
Table IV shows the breakdown of time spent executing in the trace cache. The total time an application spends executing in the trace cache can be broken into execution of the application code (App), the prefix code of a indirect target (Prefix), the code in the trace body for indirect branch (Ind Body), the direct exit stub (Dir Exit), and indirect exit stub (Ind Exit). Apart from App, all others are extra code added by DynamoRIO for maintaining control. The conclusion one can draw from this analysis is that the extra code for indirect jump accounts for a big part of the execution time pie. On the other hand, direct exit stubs are not executed much thanks to the code fragment linkage mechanism.
Using the performance counters of the Intel Pentium 4, we were able to collect even more accurate execution information. In Table V, ‘NIC’ and ‘NII’ are the total number of instruction completed and indirect instructions completed, respectively, in the native execution. ‘IR’ is the indirect jump rate or the number of indirect jumps for every 1000 instructions. ‘NCS’ is the number of stall cycles in the native execution. ‘DIC’, ‘DCS’ are the total number of instructions completed and stall cycles when the application runs under DynamoRIO control. We can see a significant correlation between the slowdown in execution and the number of indirect jumps. The higher the indirect instruction rate is, the higher the overhead. There are exceptions such as 175.vpr which has high indirect jump rate but a relatively small amount of slowdown. This is due to the fact that in these applications, the indirect jumps tend to have fixed targets. This can be infered from Table IV which shows that the percentage of time spent in the indirect branch body (Ind Body) is significantly higher than that for the exit (Ind Exit). In other words, it is unlikely that control will leave the trace after the check at the indirect jump site. We
TABLE IV
BREAKDOWN OFEXECUTIONTIME IN THETRACECACHE. Bench. App Prefix Ind Body Dir Exit Ind Exit
(%) (%) (%) (%) (%) gzip1 88.536 2.242 2.739 0.003 6.480 gzip2 95.883 1.385 0.804 0 1.928 gzip3 94.885 1.997 1.367 0 1.751 gzip4 91.357 0.724 2.985 0 4.934 gzip5 95.150 1.805 1.200 0 1.846 mcf 99.950 0.002 0.030 0 0.018 vpr1 96.892 1.020 0.641 0 1.447 vpr2 98.183 0.075 1.626 0 0.116 gcc1 87.540 3.237 1.702 0.007 7.514 gcc2 77.601 5.935 3.730 0 12.733 gcc3 71.840 7.894 4.059 0.045 16.162 gcc4 80.205 5.391 3.152 0 11.252 gcc5 80.018 5.407 3.156 0.003 11.416 crafty 71.959 9.142 3.809 0 15.090 vortex1 75.766 9.902 4.052 0 10.279 vortex2 75.122 9.534 4.283 0.002 11.058 bzip1 95.191 1.161 2.453 0 1.196 bzip2 96.304 0.871 2.261 0.001 0.563 bzip3 95.519 0.956 2.785 0 0.740 twolf 94.887 1.608 1.188 0 2.317
can see that the number of stall cycles increased much more substantially than the increase in the number of completed instructions. We further used the performance counters to gather cache miss rates. We found that the cache miss rates for native execution and DynamoRIO do not differ by much. Therefore, we can conclude that indirect jump handling in DynamoRIO not only increase the number of instruction executed, but it is the culprit behind the increase in stall cycles which we attribute to the loss of instruction level parallelism when indirect jumps are executed by the processor.
From these experiments, we can conclude that there are two types of programs that results in high overhead when executed under DynamoRIO. The first type are programs that does not spend sufficiently long time executing in some stable core. They make the work done by DynamioRIO futile. For instance, while running 176.gcc, DynamoRIO spends an average of 25% time operating in DynamoRIO, context switching and IBL. Such programs either complete execution very quickly or have large, independent and rapidly changing working sets. Such a program may change its working set before DynamoRIO can even complete its profiling. These applications are therefore inherently not suitable for dynamic optimization. The other type of programs that can induce large overheads in DynamoRIO are those with high percentages of indirect jumps. DynamoRIO injects quite a number of instructions to maintain control for a single indirect jump. A program with a high indirect jump rate would therefore have a large number of DynamoRIO injected instructions executed.
III. THEPROPOSEDSOLUTION
The experiments have shown that in a good number of pro-grams the major overhead comes from the handling of indirect jumps. Indirect jumps like the procedure return instruction are very common in any program’s execution. So a program with a significant number of indirect jumps, as would be the case in a procedure call-intensive program, would have much higher overhead that cannot only be matched by the performance
gain through improvements in cache locality. Unfortunately, modern software with features such as late binding show a trend of increasing uses of indirect jumps. Smaller functions also introduce higher call return overhead. To make dynamic optimization more efficiently, we decided to focus on the overhead caused by indirect jump.
A. Basic Idea
In order to handle indirect jumps more efficiently, we need to treat different types of indirect jumps differently. Procedure return instructions can be handled by procedure inlining. On the other hand, calling a function in a shared object is usually done by a indirect jump in procedure linkage table (PLT). But the target is fixed after the first call which triggers the action of the dynamic loader that eventually patches the PLT entry with a jump to the final location of the function. Therefore, the procedure call can be changed to a direct jump. For calls to external functions, if we are sure it is a safe function call such asprintf, which does not care about the return address nor pass function pointers, we will make a direct call to the function instead of its PLT entry. However, this cannot be done for certain function calls such asstart_mainthat has call back functions.
For the general case, i.e. those not covered by the above, we adopted the following strategy. We record up to sixteen targets when the application executes in the basic block cache. If it is upgraded to the trace cache, we choose the last four targets which were visited at least twice. We call these the ‘qualified targets’. Inlined compare instructions are injected to check for these four targets. A jump to the hash table lookup routine is inserted after these four checks.
We further assumed that eflags do not have effects across indirect branch boundaries. This will help us reduce the amount of code to be injected.
B. Implementation Details
1) Basic Block Cache Build-up: DynamoRIO builds basic block by adding instructions to the current code fragment in the basic block cache, stopping at the conditional branch or a indirect branch. Profile code is injected into conditional branches and indirect jumps in order to perform edge profiling needed for trace construction. DynamoRIO provides APIs for instrumenting function calls in order to collect edge profile information. We used these APIs to instrument indirect jumps, and separately instrumented conditional branches using only 5 instructions. For each indirect jumps, we record up to sixteen targets, as well as count the total number taken branches, and the number of times these targets were taken.
2) Trace Construction: With no access to DynamoRIO’s source code, in order to realize our proposal on reducing the overhead in indirect branch handling, we had to implement our own method of trace construction. DynamoRIO’s default trace building mechanism is stopped and Algorithm 1 is used to construct traces based on the information collected during profiling.
Instructions that are not control transfer instructions are merely appended to the trace that is being built. If a direct
TABLE V
DATA OBTAINED BYPERFORMANCECOUNTERS OF THEPENTIUM4.
Bench. NIC NII NCS IR DIC DCS
(×109) (×109) (×109) (×109) (×109) gzip1 72.106 0.802 16.223 11.123 83.657 29.051 gzip2 28.164 0.102 6.342 3.609 29.952 7.128 gzip3 104.104 0.451 7.355 4.330 115.383 10.667 gzip4 58.190 0.516 19.159 8.867 64.447 29.605 gzip5 54.890 0.279 6.879 5.099 60.387 8.978 mcf 49.681 0.030 73.155 0.612 50.297 73.083 vpr1 111.712 1.173 13.155 10.500 127.692 16.350 vpr2 89.386 1.127 20.399 12.608 93.962 28.828 gcc1 19.846 0.134 21.042 6.802 23.895 23.506 gcc2 66.361 0.917 17.703 13.818 81.992 21.317 gcc3 6.692 0.090 1.560 13.449 10.098 2.431 gcc4 6.613 0.059 3.700 8.922 9.422 5.455 gcc5 36.010 0.551 11.578 15.3013 46.319 14.348 crafty 215.205 2.129 20.744 9.893 256.507 24.671 vortex1 99.579 2.028 29.277 20.366 125.115 40.803 vortex2 110.781 2.251 29.414 20.319 139.003 47.296 bzip1 82.272 0.844 16.412 10.259 88.450 20.058 bzip2 108.561 0.956 29.915 8.806 115.691 39.997 bzip3 96.756 0.849 15.692 8.775 103.177 20.553 twolf 287.849 2.112 38.761 7.337 309.557 44.445
Algorithm 1: Macro for EndBranch
/* The macro EndBranch */ EndBranch:
begin
Add an exit jump to T ;
if aStack is empty then exitP := true; else curPC
:= pop aStack;
end
jump or a direct call is encountered, procedure inlining is achieved by extending the trace in the direction of the destina-tion of the branch. However, we only inline one level of calls in the trace because multi-level calls will make the inlining too complicated, and the trace too large. When a conditional jump is encountered, a decision is made as to whether the branch is to be inverted. Branch inversion is performed so that the more frequently executed branch will be in the fall-through path of the branch. After branch inversion, a check is made to see if the non-fall-through arm of the branch executes frequent enough to qualify for possible placement in the trace cache. If its execution frequency exceeds a certain threshold, it is pushed onto the stack for trace cache placement consideration. Otherwise, it is linked to an exit stub. Next, the fall-through branch is considered. If its execution frequency do not exceed a preset threshold, a direct jump to an exit stub is added, and the stack is popped for another branch to consider. If, however, the stack is empty, trace construction is considered complete. When an indirect branch is encountered, the situation is more complex. If it is a return instruction and we have already entered a call, the epilogue of the procedure can be optimized away. If it is a indirect call and we have already entered a call, the current branch is stopped. For all other situations, we will select up to four latest qualified targets and add checking code to see if the actual target is the same as any of these. The checking code is such that if they are the same, a direct branch is taken to that target code. Otherwise, a branch is taken to
the code performing indirect branch lookup. IV. EVALUATION OF THENEWTRACE
CONSTRUCTIONALGORITHM
Using the same experimental setup as before, we evaluated the effectiveness of our new trace construction algorithm. The results are shown in Fig. III-B.2 and it shows that for most applications our solution showed better performance than execution under standard DynamoRIO. On the average, standard DynamoRIO showed a slowdown of 20.6% while our solution had a slowdown of 14% when compared to the native solution. In the case ofmcfandvpr2, we even did better than the native execution. In the best case for vortex2, the new solution is 27% better than DynamoRIO in terms of slowdown. The reader should bear in mind that we do not have access inside DynamoRIO. If we do, we should be able to reduce duplicate work like trace building, and the result should be even better.
Although the indirect jumps can have multiple targets, in some cases, such asvpr2, it is almost always the same target. This leads to a relative low overhead in handling indirect jump because the DynamoRIO also always has a correct prediction of the jump target, avoiding the expensive hash table searching. With our assumption about eflags, the overhead of the check can be reduced to only two instructions. Given that there is only one target, as is the case for DynamoRIO, this leads to a lower overhead in checking.
Some indirect jumps have many targets that are equally probable to be taken. DynamoRIO can only predict and extend on one target, which leads to much high rate of failure in checking, thereby causing significant overhead in executing indirect exit stubs, IBL, and prefix. Using our low overhead checking, we can check more targets. Compared to the over-head caused by a check failure, this overover-head is lower, and therefore the new scheme performs better.
For extreme cases such as crafty andtwolf, they are many indirect jumps which have more than five targets, all of
0 0.2 0.4 0.6 0.81 1.2 1.4 1.6 1.8
gzip1gzip2gzip3gzip4gzip5 mc f vpr1 vpr2 craft y vort ex1 vort ex2
bzip1bzip2bzip3 twol f Avg Benchmark Slowdown Native DynamoRIO Our Solution
Fig 2. Performance of our trace construction algorithm.
which are equally probable. Even checking up to four targets can still result in a high chance of checking failure. Adding more checks would lead to a higher overhead for checking, which cannot be offset by the improvement in the checking success rate. According to our experiments, doing at most 4 checking seems best.
In summary, if the overhead of indirect jumps can be controlled effectively, we may even get better results than native execution.
V. RELATEDWORK
Besides its predecessor, Dynamo [2], systems in the same flavor as DynamoRIO includes Wiggins/Redstone [7], which optimizes for the Alpha architecture, and Microsoft’s Mojo [5], a dynamic optimization system running in the Windows NT-x86 environment. However, not much details are available es-pecially about the internals of these systems. Recently, Kistler and Franz [10] also proposed the idea of utilizing dynamic optimization as a continuation of the lifelong optimization of an application.
Software dynamic optimization system is used extensively with the managed execution environment such as the Java Virtual Machine [1] or the Common Language Runtime [14] where just-in-time (JIT) compilation is applied to recompile and optimize hot functions. DynamoRIO, on the other hand, is a transparent dynamic native-to-native optimization sys-tem where the issue of runtime overhead is more severe. LLVM [12] is another virtual machine research that will operate at a level close to the hardware. One of the many projects inspired by LLVM is Lifelong Code Optimization [11] which will use dynamic optimization as part of their ambitious framework.
There have been proposals for the use of hardware support to reduce the overhead of dynamic optimization. For example, instead of keeping the application running under its control for profiling, ADORE [13] samples performance related events by utilizing the Performance Monitoring Unit found in Intel’s Itanium processors. It then performs optimization based on information collected by sampling, and rewrites the application to incorporate the optimized trace. In this way, the accuracy
of the collected runtime information is traded off for lower profiling overhead. Merten et. al. proposed an architectural framework to perform dynamic optimization which reduces the overhead with special hardware support [15].
Software approaches have also been proposed. Burst pro-filing is a technique proposed by Chilimbi and Hirzel [6] to reduce the overhead in collecting information about hot data streams for prefetch optimization. Joshi et al. presented targeted path profiling [8] as a low overhead technique for staged dynamic optimization systems.
VI. CONCLUSION ANDFUTUREWORK
The contribution of this paper may be summarized as follows:
• the runtime overhead of an actual dynamic optimizer was quantitatively analyzed;
• the dominant component of the overhead has been iden-tified as the handling of indirect jumps;
• a solution to overcome the overhead was proposed. Our proposed solution was able to recover performance loss incurred by a dynamic optimizer. In many cases, it achieved performance that is comparable to compiling the source code of the application at the highest level of optimization, doing better than even that in some cases. At best, 27% of perfor-mance lost to dynamic optimization was recovered. At worst, it was only slightly worsed off. This was achieved without any further optimization other than our trace construction algorithm.
Besides performance optimization, there have been pro-posed use of frameworks similar to that of dynamic optimizer studied in this paper for machine code translation [17], security verification [9], and application scenarios that requires binary applications to be operating under the auspices of a managed runtime environment. Our proposal will be useful in recovering part of the performance traded off for the need to maintain control over the application.
As future work, we plan to improve the algorithm of trace construction. The current algorithm is a greedy scheme due to lack of global view. With the help of control flow graph or
information gathered from previous executions, optimization can be done accumulatively [11].
REFERENCES
[1] M. Arnold, S. Fink, D. Grove, M. Hind, and P. Sweeney. Adaptive Optimization in the Jalape˜no ”JVM”. In Proceedings of the ACM
Conference on Object-Oriented Programming, Systems, Languages and Applications (OOPSLA’00), pages 47 – 65. ACM Press, October 2000.
[2] V. Bala, E. Duesterwald, and S. Banerjia. Dynamo: a transparent dynamic optimization system. In Proceedings of the ACM SIGPLAN
2000 conference on Programming language design and implementation,
pages 1–12. ACM Press, 2000.
[3] D. Bruening, E. Duesterwald, and S. Amarasinghe. Design and im-plementation of a dynamic optimization framework for windows. In
Proceedings of the 4th Workshop on Feedback-Directed and Dynamic Optimization (FDDO4), December 2001.
[4] D. Bruening, T. Garnett, and S. Amarasinghe. An infrastructure for adaptive dynamic optimization. In Proceedings of the international
symposium on Code generation and optimization (CGO’03), pages 69–
78. IEEE Computer Society, March 2003.
[5] W.-K. Chen, S. Lerner, R. Chaiken, and D. M. Gillies. Mojo: A dynamic optimization system. In Proceeding of the 3rd Workshop on
Feedback-Directed and Dynamic Optimization (FDDO3), December 2000.
[6] T. M. Chilimbi and M. Hirzel. Dynamic hot data stream prefetching for general-purpose programs. In Proceedings of the ACM SIGPLAN
2002 Conference on Programming language design and implementation,
pages 199–209. ACM Press, 2002.
[7] D. Deaver, R. Gorton, and N. Rubin. Wiggins/Redstone: An on-line program specializer. In Proceedings of the Hot Chips 11, 1999. [8] R. Joshi, M. D. Bond, and C. Zilles. Targeted path profiling: Lower
overhead path profiling for staged dynamic optimization systems. In
Proceedings of International Symposium on Code Generation and Optimization (CGO’04), pages 239 – 250, March 20 - 24 2004.
[9] V. Kiriansky, D. Bruening, and S. Amarasinghe. Secure execution via program shepherding. In Proceedings of the 11th USENIX Security
Symposium, 2002.
[10] T. Kistler and M. Franz. Continuous program optimization: A case study.
ACM Trans. Program. Lang. Syst., 25(4):500 – 548, 2003.
[11] The Lifelong Code Optimization project. http://www-faculty.cs.uiuc.edu/ vadve/lcoproject.html.
[12] The LLVM compiler infrastructure. http://www.llvm.org.
[13] J. Lu, H. Chen, R. Fu, W.-C. Hsu, B. Othmer, P.-C. Yew, and D.-Y. Chen. The performance of runtime data cache prefetching in a dynamic optimization system. In Proceedings of the 36th Annual
IEEE/ACM International Symposium on Microarchitecture, page 180.
IEEE Computer Society, 2003.
[14] E. Meijer and J. Gough. A technical overview of the Common Language Infrastructure. http://research.microsoft.com/ emeijer/Papers/CLR.pdf. [15] M. C. Merten, A. R. Trick, R. D. Barnes, E. M. Nystrom, C. N. George,
J. C. Gyllenhaal, and W.-M. Hwu. An architectural framework for runtime optimization. IEEE Transactions on Computers, 50(6):567–589, Jun 2001.
[16] PAPI: Performance application programmer interface. http://icl.cs.utk.edu/projects/papi.
[17] D. Ung and C. Cifuentes. Machine-adaptable dynamic binary translation. In Proceedings of ACM SIGPLAN Workshop on Dynamic and Adaptive
Compilation and Optimization, pages 41 – 51, 2000.
Algorithm 2: Algorithm for Trace Construction.
Input: First instruction of trace head t Output: Trace T
aStack := φ; curPC := address of t ; exitP := false; retPC := 0; InlCount := 0 ; while ¬ exitP do
i := instruction at curPC ;
if i is not a CTI then
Add i to T ; curPC++ ;
else
switch CTI type of i do case i is a direct jump
curPC := branch target of i ; case i is a procedure call
if i is a call through the PLT then
if call is to a known safe function then
Add i to T ; curPC++ ;
else EndBranch; else
if InlCount < 1 then
/* Inline target */
retPC := addr of last instr. in T + 1 ;
Add ‘push retPC’ instr. into T ;
curPC := target of i ; else EndBranch;
end
case i is a conditional branch
if i has been previously handled then
/* CFG is a DAG so this is possible */ Insert a jump to where the previous instance of i is located;
EndBranch ; else
curPC := more frequent branch of i ;
/* Check the other branch */
if other branch freq. below threshold then
Insert DynamoRIO trace exit stub ;
else
/* Note it for future exploration */ Push other branch into aStack ; Insert a cond. branch; target to be fixed later ;
end end
case i is a indirect branch
if i has been previously handled then
Insert a jump to where the previous instance of i is located;
EndBranch ; else
if (i is a return instruction) and
(InlCount = 1) then
curPC := retPC; InlCount := 0 ; else
if (i is a indirect call) and
(InlCount = 1) then Add i to T ; EndBranch ;
else
Insert code to check for qualified targets ; EndBranch ; end end end end end end