OATAO is an open access repository that collects the work of Toulouse
researchers and makes it freely available over the web where possible
Any correspondence concerning this service should be sent
to the repository administrator:
[email protected]
This is an author’s version published in:
http://oatao.univ-toulouse.fr/24243
To cite this version: Yazdani, Morteza and Kahraman, Cengiz and Zaraté,
Pascale and Onar, Sezi Cevik A fuzzy multi attribute decision framework with
integration of QFD and grey relational analysis. (2019) Expert Systems with
Applications, 115. 474-485. ISSN 0957-4174
…
A
fuzzy
multi
attribute
decision
framework
with
integration
of
QFD
and
grey
relational
analysis
Morteza
Yazdani
a,∗,
Cengiz
Kahraman
b,
Pascale
Zarate
c,
Sezi
Cevik
Onar
ba Universidad Loyola Andalucía, Departamento Gestión Empresarial, Sevilla 41014, España b Istanbul Technical University, Department of Industrial Engineering, Macka, Istanbul 34367, Turkey c University of Toulouse, IRIT, Toulouse, France
a
b
s
t
r
a
c
t
Objective: Thispaperproposesamultiattributedecisionsupportmodelinasupplychaininorderto solvecomplex decisionproblems.The paperprovidesaplatformtoeasedecisionprocess throughthe integrationof quality functiondeployment(QFD)and greyrelational analysis (GRA) indemonstrating mainsupplychaindriversunderfuzzyenvironment.
Methodology: Theproposedmethodisimportantbecauseofseveralpoints:Firstofall,inasupplychain system,evaluationfactorsarenotreallyindependentandmustbeaddressedinrelationtotheexternal factorssuchas customerrequirements.Hence,wehave appliedQFDtool.Second,duetotheconstant uncertaintyinthesupplychainenvironment,fuzzinessamongthefactors hastobeconsidered.So,an intervalvaluedfuzzymodelwasimplemented.Third,toexaminetheproposeddecisionsysteminreality, itwasappliedinRiskandUncertainConditionsforAgricultureProductionSystems(RUC-APS)project. Contribution: AnintegratedversionofQFDandGRAispresented.ItisassumedthatQFDcanactto mea-sureoptimalsolutionsbasedonthedistancetoidealsolutions.Inaninterval-valuedfuzzyenvironment theenormousvolumeofcomputationbyEuclideandistancedoesn’tallowdecisionmakerstoobtainthe resultseasily. Thisdrawbackisaddressedusinggray relational analysis.Thegray relationalcoefficient isintegratedtothefuzzyQFDtomeasurethedistanceofpotential solutionsfromidealsolutions.This integrationfacilitatesdecisionmakingprocessinfurtherproblemsoncebigdataareavailable.
Results: Toobtaintheimportancedegreesoflogisticindicatorsinthesupplychain,expertteam consid-eredtheenvironmental,social& cultural,and economicfactors asexternaldimensionoftheQFD. The otherdimensionofQFDincludes supplychaindriverssuchasquality,environmentalmanagement sys-tem,supplychainflexibility,corporatesocialresponsibility,transportationservicecondition,andfinancial stability.The decisionmodelis solvedandthe rankingofindicatorsis achieved.Asensitivity analysis helpstotestandchecktheperformanceofthedecisionmodel.
1. Introduction
Aprocessofsupplyingrawmaterialsfromsupplier, transform-ing them intofinal products, thendelivering anddistributingthe product to customers through logisticsand retailchannels is ex-pressed as a supply chain (Genovese, Acquaye, Figueroa, & Koh, 2017). Asupply chainis sustainable ifthe products are designed underenvironmentalregulations;naturalresourcesandenergyare consumed efficiently; thefinal product are guaranteed; customer services are met; and employment ethical issues are considered
(Tavana, Yazdani, & Di Caprio, 2017). A sustainable supply chain
∗ Corresponding author.
E-mail addresses: [email protected] (M. Yazdani), [email protected] (C.
isgovernedbyprominentcustomer/stakeholderrelationsand cus-tomersatisfactionplaysakeyrole.Manystudiesemphasizedonly on the influence of the traditional criteria on the performance of the supply chain. However, dealing with an intelligent deci-sion making systemwith inclusion of customer factors not only improve internal processes and practices, but also enhances the company reputation andcustomer loyalty. Therefore,an effective customer-drivensystem to translate customer factors into supply chainindicatorshassignificantachievementforthecompany.The nature ofmultiattribute decision making (MADM)permitsusto explorenoveldecisionapproaches.
Establishing knowledge-based techniques has become one of the essential programs for competitive companies (Cantor, Black-hurst,Pan,&Crum,2014;Patil&Kant,2014).Significantattention is devoted to the knowledge-based decision models in academia
Kahraman), [email protected] (P. Zarate), [email protected] (S.C. Onar).
and industry.Configuringan intelligent decisionsystem to facili-tatemanagerialdecisionsisthefundamentalissueofmanyoriginal researches andinternationalprojects (Shi, Guo, & Fung,2017). In decisionmakingenvironments,anexpertsystem(ES)isrecognized asanintelligent andcomputerizedsystemthatsupports manage-mentdecisionmakingoperations(Koh etal.,2013;Lolli,Ishizaka,
Gamberini, Rimini, & Messori, 2015). It builds a platform to
an-alyze strategic decisions and to support decision makers (DMs) in acomplex andweakly structuredsituation. Oneof the advan-tages ofsuch kindof systemis to assist top managers andDMs in theirtasks inorder toimprovethe qualityof decisionmaking (Yazdani,Chatterjee,Zavadskas,&Zolfani,2017).
Developmentofthelogisticsandsupplychainmanagement de-pendsontheapplicationandimplementationofintelligentand ad-vanced systems.Such system mustenable supplychain to incor-porate in fundamental decisionprocess, information-sharing, and tocreatevalueaddedtotheproductionsystemandservices.Over the last decades, the direction of companies in managing deci-sion has changed drastically. For instance, to manage the mate-rial costs in a manufacturing system, a semi intelligent decision model was developed to choose efficient scenario of total man-ufacturing costs reduction (Wong & Leung, 2008). Application of the decision making systems provides competitive advantages of knowledge sharing with customers and stakeholders in a sup-ply chain to improve coordination and communication abilities among them (Ngai etal. 2014). Liuet al. (2012) built a sustain-ableframeworkinasupplychainwiththeintegrationoflifecycle assessmentandmulti-attributedecisiontoolsto support environ-mental,social andtheeconomic aspects. Seuring(2013) reported thatan initialandstrategicsustainablesupplychaindecisionsare taken efficientlyonly ifit is defined undera well-structured ap-proach. Bhattacharya et al. (2014) demonstrated a green supply chain performancemeasurement perspective anddelivereda col-laborative decision-making model using fuzzy analytical network process. Accorsi, Manzini, and Maranesi (2014) developed a de-cision making system for the design, management, and control of warehousing systems withsolid architecture. Guo, Ngai, Yang,
and Liang (2015) proposed radio frequency identification-based
intelligent decision system to handle production monitoring and schedulinginadistributedmanufacturingenvironment.Arecently developeddecisionsupportsystemforpurchasingmanagement re-alizedthatthecapital-constrainedretailer’spurchasetiming, quan-tity and financing decisions are necessary for seasonal products (Shi et al., 2017). To be accurate, none of the mentioned mod-els could create a fuzzy group decision system withaggregation of QFD and MADM tools. The present paper proposes GRA as a strategicMADMtooltobelogicallyintegratedwithQFD.Thewide rangesofstudies arepresentedintheliteraturereview sectionin ordertocomparethemwithourproposedmodel.
The expert’s judgments on the assessment of logistic factors in the supply chain such as environmental, economic, and so-cial factors in decision-making processes always involve impre-cise andvague information.Expert’s linguisticassessments of lo-gistic factors generally involve thiskind of uncertainty. Our pro-posedintelligentframeworkhandlesthevaguenessand imprecise-nessthroughthefuzzysettechniques.
Section 2presentssome evidencesfromtheliterature,
presen-tationoffuzzyintervalandfuzzyQFDandjustificationofthe pro-posedmethod.Italsodiscussestheresearchcontributionand ap-plicationofdecisionmakingsysteminasupplychainproject.The mathematicalrelations,definitions andformulasinorderto com-posetheproposedmodelare deliveredasSection3.InSection4, an extended version of fuzzyQFD withinterval valuedand inte-grationofgreyrelationalanalysisisformulated.Acasestudyis of-fered totest andvalidatethemodelalongwithasensitivity
anal-ysisinSection5.ConclusionwillbehighlightedasSection6.
2. Literaturereview
The literature review presents severalsections to present the existing decision modelsincluding QFD,GRA andother extended tools,tocomparetheir performanceandfinallyfillingtheexisting gapbytheproposedmodelinthisstudy.
2.1. QFDintegratedtechnologies
Quality function deployment was developed as a practical problem-solvingtechniqueforexecutingproductdesignand plan-ning to meet clients need and expectations (Onar, Büyüközkan,
Öztay¸si,&Kahraman,2016).ThemodelwasinitiatedatMitsubishi
CompanyandthenToyotaandotherJapanese companiesadopted ittofacilitateproductdevelopmentprocess.Ithelpstorealize cus-tomers’ needs and meet those needs within their currentability and resources (Liang, 2010). The coreof theQFD is thehouse of quality (HoQ)matrix whichdemonstratesa bridgebetween engi-neering characteristics and customers’requirements (Büyüközkan
& Çifçi, 2012; Ignatius, Rahman, Yazdani, Šaparauskas, & Haron,
2016; Tavana et al., 2017). In a decision making system,
some-times designing that bridge containscomplex variables and sub-jective preferences.Mayother approachescan aidusatthis.This isasubjectthat matersinvestigationtodevelopan integrated de-cisionformula.
Fu, Zhu, and Sarkis (2012) depicted that gray system theory
can achieve satisfactory outcomes using a small amount of data or with a large amount of variability in the factors. Gray rela-tional analysis originates from gray system theory which mainly is incorporated to ambiguity and uncertainty in particular deci-sion situations (Deng, 1989; Kuo, Yang, & Huang, 2008; Olson & Wu, 2006). GRAwas successfully applied in solving a variety of MADMproblems,suchasthesupplychain(Hashemi,Karimi,&
Ta-vana,2015;Huang,Chiu,&Chen,2008;Morán,Granada,Míguez,&
Porteiro,2006; Rajesh&Ravi,2015),materialandmechanical
en-gineeringforoptimizationofmachiningparameters(Lin,Chang,&
Chen, 2006; Sarıkaya& Güllü, 2015), etc. Amongthem, Yang and
Chen (2006) addressed the AHP and GRA to evaluate suppliers
considering qualitative andquantitative criteria inan outsourcing manufacturing organization.AHPwas usedto delivertheweights of the decision factors andno integration to the GRA happened.
Li,Yamaguchi,andNagai(2008)proposedaroughsetGRAto
vali-datesupplier’sperformancetodealwithuncertaininformation.To introduce a model for evaluating internal barriers of automobile sector, Xia,Govindan,andZhu (2015) unifiedDEMATEL tool with GRA toconsider factorsrelationships witheach other,andfinally generateweightsofbarriers.AgainlikeaboveAHPcase,therewas notanykindofintegration.
The dynamism of gray theory is certified through empirical examples. These studies indicated that futurecustomer needs an effective prediction perspective which is possible through log-ical combination of the quality function deployment and GRA for evaluating and adjusting the importance of customer re-quirement (Golmohammadi & Mellat-Parast, 2012; Wu, 2006).
Song, Ming, andHan (2014) investigated on the development of
QFD model by rough set theory and GRA. The approach utilizes GRA in the structuring an analytical framework and discovering requiredinformationofthedatainteractions.Inaddition,they re-ported customer relation matrix analysiscan be composed using GRAmethod.Inthiscase,alsotherewasnotanyevidencetoshow that GRAactsasafunction inQFD.Yeh andChen (2014)applied theKanomodelandgrayrelationalanalysiswiththequality func-tion deployment to improve servicequality in nursing homesin Taiwan.Theliterature reviewofMADMintelligentsystemssuffers fromarobustcombinationofQFDandGRAandwecanclaimthat
Table 1
Fuzzy QFD studies and applications.
Author (s) Methodology used (Sole/Combined) Application area
Yang et al. (2003) Fuzzy QFD Design of building
Bevilacqua et al. (2006) Fuzzy QFD Supplier evaluation
Bottani and Rizzi (2006) Fuzzy QFD Logistics and service management
in Italian company
Chen, Fung, and Tang (2006) Fuzzy weighted average in the fuzzy expected value
operator Flexible manufacturing
Chen and Ngai (2008) Fuzzy QFD Improvement of the design of a motor car
Su and Lin (2008) Fuzzy QFD and TRIZ Creative solutions for service quality
improvement
Celik et al. (2009) F-AHP & fuzzy axiomatic design Shipping investment decisions in maritime transportation
Liang (2010) Fuzzy QFD Service management requirement
Vinodh and Kumar (2011) Fuzzy QFD Quality management with lean practices
Lee and Lin (2011) Fuzzy Delphi, fuzzy interpretive
structural modeling & Fuzzy ANP Thin film transistor liquid crystal display company
Lin, Huang, and Yeh (2012) Fuzzy group decision making &
Fuzzy QFD Development of service innovation
Yang et al. (2013) Fuzzy QFD Design for remanufacturing in automobile industry
Aya ˘g et al. (2013) Multi objective Mathematical
programming Supply chain strategy in Turkish dairy industry
Wang (2014) Fuzzy relative preference relation, fuzzy QFD in fuzzy MCDM
–
Zaim et al. (2014) ANP and Fuzzy QFD Developing equipment to squeeze the
polyethylene pipes to stop the gas flow
Jamalnia et al. (2014) fuzzy QFD and fuzzy goal
programming Facility allocation problem
Büyüközkan and Güleryüz (2015) Group decision making & fuzzy QFD IT Planning in Collaborative Product Development in Turkish software company
Ma et al. (2016) Fuzzy FMEA, Fuzzy permanent
function Identification of the to-be-improved components for the operation device of crawler crane
Onar et al. (2016) New hesitant fuzzy QFD based on AHP & TOPSIS Computer workstation selection
Lima-Junior and Carpinetti (2016) MCDM and F-QFD Supplier selection in automotive company
Arsenyan and Büyüközkan (2016) Fuzzy-QFD, fuzzy axiomatic design, fuzzy rule-based
systems Collaborative product development in IT sector
Haq and Boddu (2017) TOPSIS, AHP Identify the appropriate agile enablers in Indian food
processing industry
noneoftheaforementionedworksimplementedagraycorrelation indextotheothertools.
2.2. FuzzyQFDandMADMtheories
ApplicationoffuzzyQFDinMADMbasedresearchisvast. Prac-titionersinvariousareashaveelaboratedtheemploymentoffuzzy
QFD as seen in Table 1 (Chen & Ngai, 2008; Yang, Ong, & Nee,
2013). One of thefirst studies was reportedby Yang, Wang,
Du-laimi, and Low (2003) in buildings design. Bevilacqua,
Ciara-pica, and Giacchetta (2006) and Bottani and Rizzi (2006) used
fuzzy QFD in the supplychain andsupplier evaluation. Their ef-fort improvedsupplier selectionprocess inlogisticsmanagement.
Celik,Cebi,Kahraman,andEr(2009)identifiedacombinedmodel
offuzzyQFDandfuzzyAHPinshippinginvestmentdecisions.This is a classical approach to implement fuzzy AHP and obtain the decision criteria weights to be used in fuzzyQFD. This isa very simple function andisregardedasan initial capabilityofMADM theories.AlthoughZhai,Khoo,andZhong(2010)designedarough based fuzzy QFD expert system, the extended model deals with a differentuncertaintyandisdistinctto ourapproachinthis
pa-per.Aya˘g,Samanlioglu,andBüyüközkan(2013)conductedamodel
which includes fuzzy QFD toinitiate a development program for supplychainrequirementsinthedairyindustryinTurkey.This re-search didnot providean integratedmodelofQFD.Ma,Chu,Xue,
and Chen (2016) introduced a mixture of fuzzyFMEA and fuzzy
QFD toidentifytheto-be-improved componentsfortheoperation deviceofcrawlercrane.Jamalnia,Mahdiraji,Sadeghi,Hajiagha,and
Feili (2014) overcome the difficulty ofa facility location problem
with utilizationoffuzzy QFDto decide thebest international fa-cility location.Then, the outputs are applied fora goal program-mingallocationproblem.BüyüközkanandGüleryüz(2015)focused
on IT planning in a product development program in a Turkish SoftwareCompanywithoutintegrationofanyconcepttotheQFD.
Zaimetal.(2014)applied a fuzzyQFDandANP tooptimally
de-signaproductdevelopmentplan.TheauthorsindicatetheQFDto identifycustomerneeds andANPto ranktechnicalcharacteristics ofa product. Itis figured out that QFD delivers relevantweights forANP analysisand thereforeit does not propose an integrated decision structure. In Indian food processing industry, Haq and
Boddu (2017)demonstratedthe appropriate agileenablersby
us-ingAHP,TOPSIS,andfuzzyQFD.Aquickreviewtoallofthe stud-iesprovidedinTable1,youcaneasilyseethegrowingimportance offuzzyQFD model.This table announcesthat there isno study assignedtofuzzyQFDandGRA.Moreover,ourproposedmodel de-finesanewstructuretointegratetheQFDandgrayrelationindex that was scarce in the literature. List of the implemented works whicharerelevanttofuzzyQFDisgiveninTable1.
2.3.Researchproblemandjustification
QFDmethodis integratedwithfuzzysets toincrease the pre-cisenessandperformanceasTable1shows.Researchersdiscussed the advantages of QFD in order to extendand improveits more efficientmodelswhichareflexible andadjustabletodifferent ap-plications.Ingeneral, extensionsofMADMtechniquestotheQFD enhancethequalityofthedecisionmaking(Hashemietal.,2015;
Yazdani, Chatterjee et al., 2017; Zaim et al., 2014). It is noticed
herethatourpurposeofintegratingisnotjusttousetheoutputs ofa methodas inputsforanother method.We extenda method throughtakingthebenefitofaconceptortoolreasonablyinorder toimprovetheresultsanddecreasecomputation.Thepaper intro-ducesanewformoftheQFD withtheaidoftheinterval valued
fuzzysetsandgrayrelationalindexwithrespect tothefollowing contributions:
1 InQFDtool,HoQmatrixhasthemainresponsibilitytoconvert customervariablestotechnicalfactors.Itsometimesgets diffi-culttoadjustthismatrixandintegrate ittoother tools. How-ever,inthis researchwe suppose HoQ asan MADMstructure with customer requirements (CR) and technical factors (since nowitiscalledsupplychaindrivers).Itisentirelyaswehave alternativesandcriteriainatypicalMADMproblem.Thisisthe transformationthatenhancesthedynamismoftheQFDand en-ablesDMstoextendandintegrateothertoolsfaster,easierand moreconvenient.
2 TheintegrationoffuzzyQFDandMADMtoolsiscapableof ex-tractinguncertaintyandvaguenessincustomerbehaviorwhen suchdecisionsbecomecomplex(Hsu,Chang,&Luo,2017;
Yaz-dani, Zarate, Coulibaly, & Zavadskas 2017). The proposed QFD
basedGRAwiththeusageofinterval-valuedfuzzyvalues sug-gests the variety of preference judgment to the decision ex-pertsinwhichtheyfeel lesscomplexity andcancount onthe reliability ofthe outcomes. The literature could not bringany similar structure to coherentlyrelease an intelligent decision-makingmodel.
3 In an interval-valued fuzzyenvironment, the huge volume of computationisadealandEuclideandistancemeasuremakesit difficultfordecisionmakers toobtainthesolution.This draw-back is addressed using gray relational analysis. The gray re-lationalcoefficient is attachedto the HoQ matrix to measure thedistanceofpotentialsolutionsfromidealsolutions. Utiliza-tionofgreycorrelationcoefficientinQFDevaluationprocess re-leasesflexibility in MADMandenablesusers to makequicker andmoreintelligentdecisions.
2.4. Applicationinsupplychainresearchproject
Risk and Uncertain Conditions for Agriculture Production Systems(RUC-APS,2016)isaEuropeanCommissionprojectwhich aims to support advanced knowledge in agricultural production andsupplychainprocess.Theprojectisentitledas“Enhancingand implementingKnowledgebasedICTsolutionswithinhighRiskand Uncertain Conditions for Agriculture Production Systems” . This project gets benefit from the development of a high impact re-search project inorderto integrate real-life basedagriculture re-quirements,alternativelandmanagementscenarios.Itsupports in-novation in the development of agriculture production systems, operations, logistics and supply chain management and the im-pactofthesesystemsovertheend-usersandcustomers.RUC-APS modelsintelligentdecisionsystemstofacilitateawaytoachievea sustainableagriculture supplychainunderriskanduncertainty.It containsinternationalacademic andnon-academicpartners com-ing from seven countries (UK, Spain, France, Poland, Chile, Ar-gentina andItaly). The project domain covers sort of theoretical studies, investigation aswell technical achievements. Part of the projectisassociatedtosomescientificobjectivestomodeland op-timizeinnovativetransport-logisticssolutionsofhorticulture prod-ucts acrossthe full value chain structure. Underdomain of RUC-APS,thispaperisassignedtomeasuresupplychainindicatorswith theaidoftheproposedgroupfuzzydecisionsupportsystem.
3. Definitions,materialsandmodels
Thissection providesrequiredmaterials andmethodsinorder to propose our integrated model. At first, QFD method is intro-duced. Then greyrelational analysistool is presentedalong with relevant formulasandmathematicalcomputations. Finally, opera-tionsandarithmeticrelationsassignedtofuzzyintervalvaluedare interpreted.
3.1. QFDstructure
QFD (Büyüközkan&Cifci,2013;Yazdani,HashemkhaniZolfani,
& Zavadskas, 2016)is an engineeredtechnique,to transformsthe
requirementsofcustomersintospecificandmeasurable character-istics of theproduct design. QFD transformationsare handled by amatrixdisplayingtherelationshipsbetweenthecustomers’ pref-erences andtheoperationalmeasures. Thismatrixis usually rec-ognizedtoexpresstherelationshipbetweentheCRs(WHATs)and thetechnicalmeasures(HOWs)(Ignatiusetal.,2016).Thegeneral stepsfortheimplementationoftheQFDmodelareasfollow:
Step1– ToidentifytheWHATsandtheHOWs. Step2– ToassignpriorityweightstotheCRs.
Step3– TolinkWHATSstotheHOWsinordertobuilda rela-tionship matrix(usingtheknowledgeofthedecisionmakerusing afour-pointscale(Formoreinformation,seeTavanaetal.2016).
Step4– Torevealthepriorityoftechnicalcriteria,supposethat n technicalcriteria aregoing tosatisfy m customer requirements. In thismanner, thesignificance oftechnical factorswjwhile j=1,
2,..,nisattainedasfollows: wj= m X i=1 Ri j×Ti (1)
where j=1,2,.., nandi=1,2,.., m, Rij denotestherelationship
matric betweenCRsandtechnicalcriteria andTiindicates impor-tanceofCRs.Thenormalizedweightofeachtechnicalcriterionis achievedasthis: ˙ wj= wj Pn j=1wj (2)
3.2. Greyrelationalanalysis
Greyrelationanalysiscanbeannouncedtocapturethe correla-tions betweenthereferences(desired) alternativeandother com-pared alternativesin asystem. The methodologyin GRAaidsthe MADMproblemsbycombiningtheentirerangeofperformance at-tributevaluesbeingconsideredforevery alternativeintoone sin-gle value.Thisfunctionleadstoreductionoftheoriginalproblem toasingleattributedecisionmakingproblem,sothosealternatives withmultipleattributescanbecomparedeffectivelyaftertheGRA process(Kuo,Liang,&Huang,2006).
GRAmethodincludessome stepsasgreyrelationalgeneration, reference sequencedefinition,greyrelationalcoefficient computa-tion andgreyrelationalgradeformation(Zhang,Jin,&Liu(2013). The computationprocessoftheGRAmethodisbriefly introduced asfollows:
Let X={x0,x1,x2,…, xi,…xm} be a sequence (alternative)set. x0 expressesthereferential alternativeandxireferstothecompared
alternative.Supposex0jandxijaretherespectivevaluesatcriterion
j,while j=1, 2,….,nforx0 andxi .The greyrelationcoefficient
γ
(x0j,xij)ofthealternativesatcriterionjcanbeobtainedbyγ
¡
x0j,xi j
¢
=min
i minj
1
i j+ζ
maxi maxj1
i j1
i j+ζ
maxi maxj
1
i j, (3)
where
1
ij=|x0j−xij|,and ζ istheresolvingcoefficientwhichusu-allyconsidered0.5, ζ ∈[0,1].Nowthegreyrelationalgrademust becomputed:
γ
(
x0,xi)
= n X j=1 wjγ
¡
x0j,xi j¢
, n X j=1 wj=1 (4)Fig. 1. An interval-valued triangular fuzzy number.
3.3. Intervalvaluedfuzzysetsandarithmeticoperations
In fuzzy sets theory, it is often tough for a decision ex-pert to precisely quantify his/her opinion as a number in in-terval [0, 1]. Interval-valued fuzzy numbers efficiently address the ambiguity existing in the available information, as well as the essential fuzziness in human judgment and preference. It is more suitable to represent this degree of certainty by an in-terval value. The benefit of interval-valued fuzzy sets is to pro-vide more flexibility to represent the imprecise/vague informa-tion resulting froma lack of data (Ashtiani, Haghighirad, Makui,
& ali Montazer, 2009; Kahraman, Öztay¸si, Sarı, & Turano˘glu,
2014; Vahdani, Hadipour, Sadaghiani, & Amiri, 2010). Primarily
Gorzalczany (1989)andTurksen(1996)studiedoninterval
exten-sion offuzzysets.WangandLi(1998)introducedinterval-valued fuzzynumbers(IVFN)andextendedoperations.
We consider extension of QFD by using interval-valued fuzzy sets. A typicalinterval-valued fuzzysetA˜definedon (∞,−∞)is supposedbyGorzalczany(1989)andgivenby
˜ A=
©
x,£µ
A˜L(
x)
,µ
A˜U(
x)
¤ª
,x∈ ( ∞,−∞)
,µ
A˜L,µ
A˜U : ( ∞,−∞)
→[0,1],µ
A˜(
x)
=£µ
A˜L(
x)
,µ
A˜U(
x)
¤
,µ
A˜L(
x)
≤µ
A˜U(
x)
,∀
x∈ ( ∞,−∞)
, where µA˜L(
x)
and µA˜U(
x)
are the lower and upperlimits ofthedegreeofmembership.
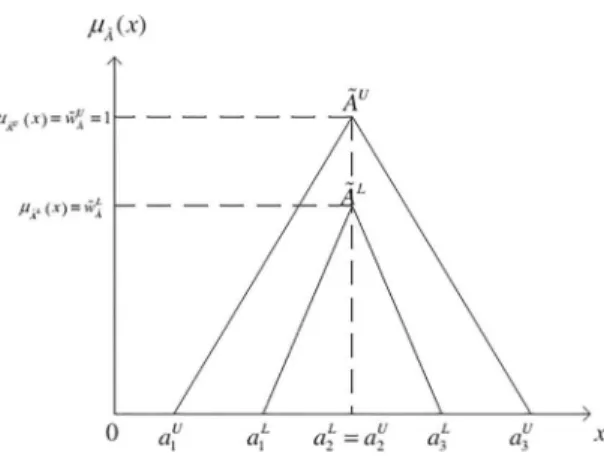
Definition 1. An interval-valuedtriangular fuzzynumber (Fig. 1)
canbedepictedbyA˜=[A˜L
x,A˜Ux]=[
(
aL1,aL2,aL3;wˆLA˜)
,(
aU
1,aU2,aU3;wˆUA˜
)
], whereA˜L andA˜U statestheloweranduppervaluesofaninterval-valued triangular fuzzy number and
µ
A˜(
x)
is the membership function(Yao&Lin,2002).Inthisstage,themembershipfunction defines the degree inwhich an eventx maybe a memberof A˜;µ
A˜L(
x)
=wˆLA˜ and µA˜U(
x)
=wˆU˜A are thelower anduppermember-shipfunctions,respectively.AsseeninFig.1,theoperationsamong interval-valuedfuzzynumberscanbeexplainedasfollows:
1.1. If A˜L=A˜U, then we call A˜ a generalized triangular fuzzy
number. 1.2. If aL 1=aU1=aU2 =aL2=aL3=aU3 and alsowˆUA˜=wˆ L ˜ A,then we
callA˜acrispvalue. 1.3. If wˆU ˜ A =wˆ L ˜ A and a U 2=aL2 , an interval-valued tri-angular fuzzy number A˜ is introduced as A˜=[A˜L
x,A˜Ux]=
[
(
aU1,aL1
)
,(
aL2=a2U)
,(
aL3,aU3;)
].It is supposed that two triangular interval-valued fuzzy numbers can be expressed based on definition (1.3.) as A˜= [
(
aU1,aL1
)
,(
a2)
,(
aL3,aU3;
)
] and B˜=[(
bU1,bL1)
,(
b2)
,(
bL3,bU3;
)
], respec-tively. Then, the arithmetic relation betweenthem can be inter-pretedasbelow(Vahdanietal.,2010):1.4.AdditionofIVFNs:
˜
A+B˜=
£¡
aU1+bU1,aL1+b1L
¢
,a2+b2,¡
aU3+bU3,aL3+bL3
¢¤
. (5) 1.5.SubtractionoftwoIVFNs:˜ A− ˜B=
£¡
aU 1−bU3,aL1−b3L¢
,a2−b2,¡
aU 3−bU1,aL3−bL1¢¤
. (6) 1.6.MultiplicationofIVFNs: ˜ A× ˜B=£¡
aU 1×bU1,aL1×bL1¢
,a2×b2,¡
aU 3×bU3,aL3×bL3¢¤
. (7)1.7.GeneraldivisionofIVFNs:
˜
A÷ ˜B=
£¡
aU1÷bU3,aL1÷bL3¢
,a2÷b2,
¡
aU3÷bU1,aL3÷bL1¢¤
. (8) Definition2. Linguisticvaluesareusedwhenthestructureof
de-cisionproblemisill-definedandacomplexdecisionmodelis run-ning.Thesevaluesthencanbeexpressedquantitativelyasthe con-ventionalfuzzynumbers.Inthispaper, decisionvariablesaswell ascriteriaweights,arerepresentedbylinguisticvariables.The con-ceptofalinguisticvariableismuchrecommendedindealingwith situationsthataretoocomplextobereasonablydescribedin con-ventional quantitative expressions (Zadeh, 1975). Interval-valued fuzzy sets can generate more flexibility to represent the impre-cise/vagueinformation(Ashtianietal.,2009;Bigand&Colot,2010).
4. AnextensionofIVF-QFDandgreyrelationalcoefficient
Thissectionprovidesanewmodelforqualityfunction deploy-mentbasedoncombiningtheconceptsofGRAandinterval-valued fuzzysets.Thismodelcontrolstechnicalcriteriainteractionon fi-naloutputsofQFDthroughadistancebasedapproachthatagrey relationalcoefficientalsogeneratesinnovativemeasureparticularly assignedto idealsolutions. It isperceived that through interval-valued fuzzy sets, the proposed model is strong enough to deal withvague information/datafrom customer attitudes.In this pa-per,we aregoingto proposeQFDasaMADMtoolandtryto ex-tenditbyIVFapproach.InfuzzyQFDproblemsasafuzzyMADM approach,performance ratingvaluesandrelativeweightsare usu-ally characterized by fuzzy numbers (Li, Jin, and Wang 2014). A fuzzy number is a convex fuzzy set, defined by a given interval ofrealnumbers,each withamembershipvalue between0and1
(Ashtianietal.,2009;Zadeh,1975).
LetX˜=[x˜i j]n×mbeafuzzyQFDmatrixforadesignorevaluation
processinwhichT1,T2,…..,Tn arenpossiblecriteria andc1,c2,…..,
cm are m customer requirements(CRs).Therefore, the ratingand
interrelationbetweeneachTiwithrespecttocriterioncjisdeclared asx˜i j .In this case, w˜j is counted asweights of each CR. In an
intervalvaluedfuzzyenvironmentwithtriangularnumbers,x˜can berepresentedasx˜=
{
(
x1,x2,x3)
,(
x˙1,x2,x˙3)
.Then x˜ can be demonstrated as x˜=[
(
x1,x˙1)
;x2;(
x˙3,x3)
]. The developmentofinterval-valuedfuzzynumberspretendsanofferto thedecisionmakers(DMs)todefine lowerandupperbounds val-uesintermsof intervalformain QFDelements andalsoweights ofeachcriterion.InagroupQFDprocesswithkexperts,therating forhouseofqualitymatrixandimportanceweightsofthecriteria areobtainedas:˜ xi j=1 k
£
˜ x1i j+x˜2i j+...+x˜k i j¤
(9) ˜ wj= 1 k£
˜ w1j+w˜2j+...+w˜k j¤
(10)Thesetwoequationsexplainhowtheopinionofeachexpertin QFDcanbe incorporatedandaggregated.Clearlytheoutput must beanIVFN.TheproposedalgorithmtodevelopanIVF-QFDcanbe releasedasfollows:
Givenx˜i j=[
(
ai j,a˙i j)
;bi j;(
c˙i j,ci j)
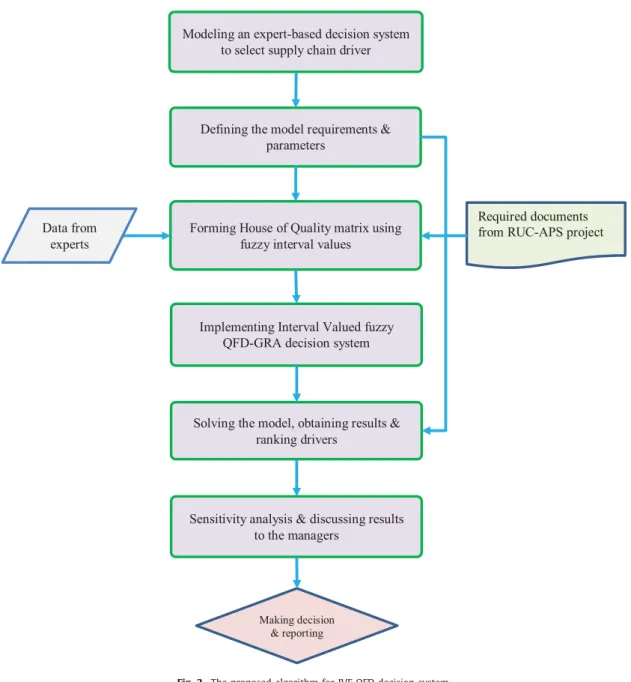
], then the normalized matricModeling an expert-based decision system
to select supply chain driver
Defining the model requirements &
parameters
Data from
experts
Forming House of Quality matrix using
fuzzy interval values
Implementing Interval Valued fuzzy
QFD-GRA decision system
Solving the model, obtaining results &
ranking drivers
Sensitivity analysis & discussing results
to the managers
Making decision & reporting
Required documents
from RUC-APS project
Fig. 2. The proposed algorithm for IVF QFD decision system.
Table 2
Fuzzy linguistic terms for rating.
Linguistic labels Triangular fuzzy interval values Very poor (VP) [(0,0),0,(1,1.5)] Poor (P) [(0,0.5),1,(2.5,3.5)] Moderately poor (MP) [(0,1.5),3,(4.5,5.5)] Fair (F) [(2.5,3.5),5,(6.5,7.5)] Moderately good (MG) [(4.5,5.5),7,(8,9.5)] Good (G) [(5.5,7.5),9,(9.5,10)] Very good (VG) [(8.5,9.5),10,(10,10)] ˜ R=
£
˜ri j¤
n×m ˜ ri j=·µ
a i j c∗ j ,a˙i j c∗ j
;bi j c∗ j ;µ
c˙ i j c∗ j ,ci j c∗ j¶¸
,i=1,2,..,m,j∈B (11) ˜ ri j=·µ
a− j ˙ ai j , a− j ai j
; a− j bi j ;µ
a− j ci j , a− j ˙ ci j¶¸
,=1,2,..,m,j∈C (12) c∗ j=maxci j, j∈B a− j =mina˙i j, j∈CWhereBisthebenefitcriteriaset,andCisthecostcriteriaset. The above formulas assure the property, theelements of nor-malizedtriangularIVFNbelongto[0,1].Werepresent an interval-valuedtriangularfuzzynumberas
˜
ri j=
£¡
ℓ1i j,ℓ2i j¢
,mi j,
¡
r2i j,r1i j¢¤
Now, two referential sequences of positive andnegative ideas solutions(A∗,A−)mustbeclarifiedbytheequations:
A∗= ( r˜∗ 01,r˜∗02,...,r˜∗0m
)
(13) A−=¡
˜ r− 01,r˜−02,...,r˜−0m¢
(14) wherer˜∗ 0j=[(
1,1)
,1,(
1,1)
]andr˜−0j=[(
0,0)
,0,(
0,0)
],j=1,2,..,nAs mentionedpreviously,thepapercombinesa greyrelational coefficientapproachintotheQFD.Atthisstage,theweightedgrey relationalcoefficient(WGRC)valuesbetweeneachcriterion(inthis studyitiscalledsupplychaincriteria)andothercriteriashouldbe determinedbythefollowingformulas:
Table 3
Linguistic terms for the importance of each criterion. Linguistic labels Triangular fuzzy interval values Very low (VL) [(0,0),0,(0.1,0.15)] Low (L) [(0,0.05),0.1,(0.25,0.35)] Medium low (ML) [(0,0.15),0.3,(0.45,0.55)] Medium (M) [(0.25,0.35),0.5,(0.65,0.75)] Medium high (MH) [(0.45,0.55),0.7,(0.8,0.95)] High (H) [(0.55,0.75),0.9,(0.95,1)] Very high (VH) [(0.85,0.95),1,(1,1)] D∗=
γ
¡
˜ r∗ 0j,r˜i j¢
=Ã
miniminj
1
¡
w˜jr˜0∗j,w˜jr˜i j¢
+ζmax
imaxj1
¡
w˜jr˜∗0j,w˜jr˜i j¢
1
¡
r˜∗ 0j,r˜i j¢
+ζ
maximaxj1
¡
˜ r∗ 0j,r˜i j¢
!
(15) D−=γ
¡
˜ r− 0j,r˜i j¢
=Ã
miniminj1
¡
˜ wjr˜−0j,w˜jr˜i j¢
+ζ
maximaxj1
¡
˜ wjr˜0−j,w˜jr˜i j¢
1
¡
r˜− 0j,r˜i j¢
+ζmax
imaxj1
¡
˜ r− 0j,r˜i j¢
!
(16)where w˜j represents the fuzzy weights of supply chain criteria
and;
1
¡
r˜∗ 0j,r˜i j¢
=¯
¯˜
r∗ 0j−˜ri j¯
¯
(17)Oncetheweighted distancesaremade,itisrequiredtoobtain theexpectedscoreoffuzzyintervalinordertocontinue computa-tionandachievemeaningfuloutcomes.TocomputeIVFNexpected scoreE[S]degreeforanintervalnumberlike[(a,b),c,(d,e)](Wu&
Chiclana,2012),thefollowingrelationmustberegulated:
E[S]=
·
(
1−c)
×(
d−a)
+c×(
e−b)
+1 2¸
(18)As before denoted
1
ij realizedistance and ζ is the resolvingcoefficient ζ ∈[0, 1].
1(
r˜−0j,r˜i j
)
is obtainedby the same in(17).Here, ζ=0.5isconsidered.InEqs.(15) and(16),D∗andD− pro-duce thepositive ideal GRC andnegative ideal GRC, respectively. Using Eq.(18), the expectedvalues are achieved. The final rank-ing oftechnical factorscan be detected basedon computationof relativecoefficientthis:
c= D
−
D−+D∗ (19)
ThehighestvalueinEq.(19)deliversbestcriterionforthe pro-posed QFD model.In summary the IVF-QFD based on grey rela-tionalanalysiscanbeinterpretedbythestepsbelow:
Step 1 – Forming QFD team and determining list of effective criteriaandcustomer/stakeholderrequirements.
Step 2 – Rating each criterion withrespect to each customer attitudeandbuildahouseofqualitymatrixusingtriangularfuzzy interval values inTable2. Thisstep producesa performance ma-trix.
Step 3 – Determine theweights ofcriteria throughfuzzy lin-guistic labelsinTable3.Theseweights mustbe aggregatedusing Eq.(10) andtheyareutilizedfortheevaluationofcriteriainfinal steps.
Step 4 – Aggregating performance matrix by Eq.(9) and nor-malizingitusingEqs.(11)and(12).
Step5– Calculating WGRCforpositiveandidealsolutions us-ing Eqs.(15)–(16).The IVFNexpectedscoredegreeforaninterval numberisobtainedusingEq.(18).
Table 4
Initial decision maker’s relationship matrix.
DM 1 T 1 T 2 T 3 C 1 VP G MP C 2 MG MG F C 3 G MP G C 4 G VG F C 5 F MG MG C 6 G G F weight M M H DM 2 C 1 P G G C 2 F G MG C 3 G MG MP C 4 G G F C 5 F MG MG C 6 G G F weight ML MH M DM 3 C 1 MG MG MP C 2 F F G C 3 MP F G C 4 G F F C 5 MG F MP C 6 G G G weight H M L
Step6 – Measuring relative closeness score (Eq. (19)) to pro-duce criteria ranking. Then each criterion can be ranked accord-ingly.
5. Results
5.1. Casestudysummaryanddecisionproblemsolution
Theroleoflogisticmanagementinasupplychainisvery con-siderable inorder to support a stableproduction process, satisfy customerandstakeholdersandmeetdemands.Withinthedomain ofRUC-APS,whilean agriculturesystemrequiresa systematic lo-gistic performance assessment, it is convincingly a favor to es-tablish such kind of intelligent decision making models. In this way, we have proposed a case study assigned to the French as-sociation of supply chain and logistics (ASLOG). This is a refer-ence organization for many companies to gather, categorize and organize logistic andtransportation systems.It is always encour-aged to involve logistics and supply chain directions in the top levelof the management decisions.ASLOG is a multi-activity as-sociationwith over four hundred companies andnetwork which standsastheleading Frenchnetworkofsupplychainandlogistics professionals.The objectiveis to provideforward-lookingvisions, to generate standards and qualifications, to measure and evalu-atelogisticsindicators,andultimatelytoproduceresearch dissem-ination in partnership with the academic sector andbenchmark bestpractices(www.aslog.org).Forthisresearch,theessential cus-tomervariablesandthecorresponding technicalcriteria are inter-pretedandintroduced.Theproposedalgorithmforthiscasestudy ispresented inFig.2.To evaluatethe performance oflogistic in-dicators in the supply chain, two approaches have been chosen by a committeeof experts. We consider the environment, social and economic issues in the perspective and guidelines of stake-holdersandexternalcustomers.Themainfactorsinclude environ-mentalindicators(T1),economicdownturn(T2),andsocialand cul-turalcomplains(T3).Eachofthosefactorscanthen besubsidedto lower levels. For example, one who gives judgment on environ-mentalfactors must consider naturaldisaster andpolitical insta-bility,emissionofpollution&hazardousmaterials,re-cycling pro-cessetc.Tothesocialaspects,socialresponsibility,commitmentto healthofemployee, participatinginsocialandculturalevents,
of-Table 5
The aggregated matric and weights from DMs.
T 1 T 2 T 3 C 1 [(1.5,2),2.7,(3.84,4.8)] [(5.17,6.84),8.4,(9,9.84)] [(1.84,3.5),5,(6.17,7)] C 2 [(3.17,4.17),5.7,(7,8.17)] [(4.17,5.5),7,(8,9)] [(4.17,5.5),7,(8,9)] C 3 [(3.7,5.5),7,(7.8,8.5)] [(2.4,3.5),5,(6.4,7.5)] [(3.7,5.5),7,(7.8,8.5)] C 4 [(5.5,7.5),9,(9.5,10)] [(5.5,6.84),8,(8.7,9.17)] [(2.5,3.5),5,(6.5,7.5)] C 5 [(3.17,4.17),5.7,(7,8.17)] [(3.8,4.8),6.4,(7.5,8.9)] [(3,4.17),5.7,(6.84,8.17)] C 6 [(5.5,7.5),9,(9.5,10)] [(5.5,7.5),9,(9.5,10)] [(3.5,4.8),6.4,(7.5,8.4)] Weights [(0.27,0.41),0.57,(0.68,0.77)] [(0.32,0.42),0.57,(0.7,0.82)] [(0.27,0.38),0.5,(0.62,0.7)] Table 6
Interval valued fuzzy normalized matrix.
T 1 T 2 T 3 C 1 [(0.15,0.2),0.27,(0.39,0.49)] [(0.52,0.7),0.85,(0.9,1)] [(0.18,0.36),0.5,(0.6,0.7)] C 2 [(0.35,0.46),0.63,(0.78,0.9)] [(0.46,0.61),0.78,(0.89,1)] [(0.46,0.6),0.78,(0.89,1)] C 3 [(0.43,0.65),0.8,(0.92,1)] [(0.27,0.41),0.59,(0.74,0.88)] [(0.43,0.65),0.82,(0.92,1)] C 4 [(0.55,0.75),0.9,(0.95,1)] [(0.55,0.68),0.8,(0.87,0.917)] [(0.25,0.35),0.5,(0.65,0.75)] C 5 [(0.36,0.47),0.64,(0.8,0.92)] [(0.43,0.54),0.7,(0.85,1)] [(0.34,0.47),0.64,(0.77,0.92)] C 6 [(0.55,0.75),0.9,(0.95,1)] [(0.55,0.75),0.9,(0.95,1)] [(0.35,0.48),0.64,(0.75,0.84)] Table 7
The calculated distances from positive ideal point.
T 1 T 2 T 3 C 1 [(0.5,0.6),0.72,(0.8,0.85)] [(0,0.08),0.15,(0.3,0.47)] [(0.28,0.37),0.5,(0.64,0.81)] C 2 [(0.09,0.22),0.37,(0.53,0.65)] [(0,0.11),0.22,(0.39,0.53)] [(0,0.11),0.22,(0.39,0.53)] C 3 [(0,0.07),0.17,(0.35,0.57)] [(0.11,0.25),0.41,(0.59,0.72)] [(0,0.078),0.17,(0.35,0.56)] C 4 [(0,0.05),0.1,(0.25,0.45)] [(0.08,0.14),0.2,(0.31,0.45)] [(0.25,0.35),0.5,(0.65,0.75)] C 5 [(0.07,0.2),0.36,(0.52,0.64)] [(0,0.15),0.28,(0.45,0.57)] [(0.075,0.22),0.35,(0.52,0.66)] C 6 [(0,0.05),0.1,(0.25,0.45)] [(0,0.05),0.1,(0.25,0.45)] [(0.17,0.25),0.37,(0.51,0.65)]
fering safe and durableproduct, and sustainable productionmay beconsidered.Andaseconomicfactors,availabilityandan afford-ablepricecanbeminded.
The team of managers is composed of experts from the fi-nance department,engineering department andsupply chain ex-ecutive. Theybelieve thatthe informationanddataabout perfor-mance of the supply chain can be gathered and then reported using fuzzy approach. The decision-making committee assesses therelationbetweenfactorsfromcustomer/stakeholderviewpoint (call itTi) andsupplychaininternal criteria(cj). Thecriteria
rele-vant tothe supplychainare based onthe followingitems: qual-ity (c1); environmental management system (c2); Supply chain and procurement flexibility (c3); corporate social responsibility (c4); Transportation servicecondition (c5); andFinancial stability (c6).
The QFD committee members are labeled as DM1, DM2, and DM3, respectively. Each member has to present his/her assess-mentsbasedonthelinguisticvariablesforratingeachfactorwith respect to the criterion by a linguistic variable as depicted in
Tables2and3.Table4exhibitstherelationshipbetweeneachpair
ofsupplychainfactorandcustomer factorsderived bythree deci-sionmakers(DM).DMsarealsoaskedtoassigntheweightofeach customer.
The linguistic values of decisionmatrix and weights are con-verted to fuzzy interval values andthen it is needed to accom-plishtheaggregationrules.Theaggregatedmatrixincludingmain decisionmatrix andweights foreach customer factorcan be ob-tainedusingfuzzyoperationsEq.(5))andthenEqs.(9) and((10).
Table5releasestheaggregatedQFDmatrixbasedontriangular
in-tervalvaluedfuzzynumbers.
After obtaining the interval-valued fuzzy performance matrix andinterval-valuedfuzzyweightmatrix,theintervalvaluedfuzzy normalizedmatrix(asshowninTable6)mustbecalculatedusing Eqs.(11)and(12).
Table 8
Weighted distances from positive and negative ideal points.
1( ˜ wj ˜ r∗0j , ˜ wj ˜ ri j) 1( ˜ wj ˜ r−0j , ˜ wj ˜ ri j) C 1 [(0.21,0.43),0.75,(1.15,1.61)] [(0.25,0.51),0.88,(1.3,1.7)] C 2 [(0.02,0.18),0.45,(0.88,1.31)] [(0.37,0.68),1.18,(1.7,2.21)]] C 3 [(0.03,0.17),0.42,(0.87,1.43)]] [(0.31,0.69),1.21,(1.71,2.18)] C 4 [(0.09,0.21),0.42,(0.79,1.23)] [(0.38,0.73),1.21,(1.65,2)] C 5 [(0.04,0.23),0.54,(1,1.41)] [(0.32,0.6),1.1,(1.61,2.18)] C 6 [(0.04,0.13),0.3,(0.66,1.16)] [(0.41,0.81),1.3,(1.77,2.17)] Table 9
Expected values, grey distance and supply chain criteria ranking.
Expected values Expected values D∗ D− c ranking 1( ˜ wj ˜ r0∗j , ˜ wj ˜ ri j) 1( ˜ wj ˜ r−0j , ˜ wj ˜ ri j) C 1 1.0576 1.0825 0.8822 1 0.5313 1 C 2 0.9887 1.2832 0.9223 0.8961 0.4928 5 C 3 1.0061 1.2591 0.9119 0.9074 0.4988 3 C 4 0.9187 1.1587 0.9669 0.9578 0.4976 4 C 5 1.0406 1.2962 0.8918 0.8901 0.4995 2 C 6 0.8708 1.1772 1 0.9481 0.4867 6 Min 0.8708 1.0825 Max 1.0576 1.2962
Herein, two referentialsequences of positive ideapoint A∗and negativeidealpointA− aredeterminedasfollows:
A∗=
{
[(
1,1)
,1,(
1,1)
],[(
1,1)
,1,(
1,1)
],[(
1,1)
,1,(
1,1)
]}
A−=
{
[(
0,0)
,0,(
0,0)
],[(
0,0)
,0,(
0,0)
],[(
0,0)
,0,(
0,0)
]}
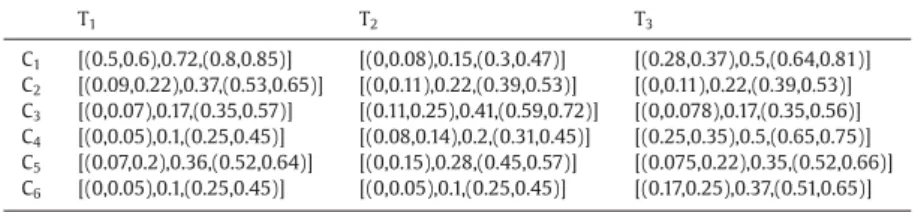
Currently,thedistancebetweeneachreferencesequence (posi-tiveidealpointandnegativeidealpoint)andothercompared alter-nativescanbecalculated.Thedistancefrompositiveidealpointis computedusingEq.(6)andisshowninTable7.Atthesametime, weighted distancematrixfrompositive andnegative ideal pointsTable 10
Eight scenarios for supply chain drivers.
S(1) T1 T2 T3 S(3) T1 T2 T3 S(5) T1 T2 T3 S(7 ) T1 T2 T3 D1 VH VL VL D1 VL VL VH D1 VL VH VH D1 VL VL VL D2 VH VL VL D2 VL VL VH D2 VL VH VH D2 VL VL VL D3 VH VL VL D3 VL VL VH D3 VL VH VH D3 VL VL VL S(2) T1 T2 T3 S(4) T1 T2 T3 S(6) T1 T2 T3 S(8) T1 T2 T3 D1 VL VH VL D1 VH VH VL D1 VH VL VH D1 VH VH VH D2 VL VH VL D2 VH VH VL D2 VH VL VH D2 VH VH VH D3 VL VH VL D3 VH VH VL D3 VH VL VH D3 VH VH VH 0.42 0.44 0.46 0.48 0.5 0.52 0.54 0.56 0 0.1 0.2 0.3 0.4 0.5 0.6 0.7 0.8 0.9 1
Sensivity analysis with respect to DM1
c1 c2 c3 c4 c5 c6 0.45 0.46 0.47 0.48 0.49 0.5 0.51 0.52 0.53 0.54 0.55 0 0.1 0.2 0.3 0.4 0.5 0.6 0.7 0.8 0.9 1
Sensivity analysis with respect to DM2
c1 c2 c3 c4 c5 c6 0.44 0.46 0.48 0.5 0.52 0.54 0.56 0 0.1 0.2 0.3 0.4 0.5 0.6 0.7 0.8 0.9 1
Sensivity analysis with respect to DM3
c1 c2 c3 c4 c5 c6
Fig. 3. Sensitivity analysis based on the changes in the weights of decision makers.
isattainableaswell whichisdemonstratedinTable8.
Table 9 reportsthe fuzzy expectedvalues and grey distances
which are obtainedas D∗and D−. The ranking of the factors in-dicatesthat thequality(c1) isregardedasthemostsignificant in supplychain,whilec6isconsideredastheworstoption.
5.2. Sensitivityanalysis
Inthissub-section,weapplyasensitivityanalysistocheckthe robustness ofthe given decisions withrespect to thechanges in theweightsofcustomer valueswithrespecttothechangesinthe weightsofdecisionmakers.Wedesigneightscenariosforthe sen-sitivity of customer values as given in Table 10. These scenarios have been conductedby usingextreme linguisticterms,e.g. very low andveryhighinordertoseethelimitsofpossibleoutcomes.
Thesamelinguisticevaluationsbythedecisionmakersareusedto obtaintheextremelinguistictermsasanaverage.
UsingthedatainTable10,therelativecoefficientsofthe crite-riaare obtainedasinTable11.Quality(c1) isthemostimportant criterioninScenarios1,2,3,5and7.Financialstability(c6)isthe mostimportantcriterioninScenarios4and8.Supplyand procure-mentflexibility(c3)isthemostimportantcriterioninScenario6. Quality(c1) isstill inthe firstrankeven theextreme evaluations occurinalmostallscenarios.Theseresultsshowthatfinancial sta-bility(c6) isaffectedby the mainfactoreconomic downturn(T2) atmost.Lowlevel of“economicdownturn (T2)” causesthe “sup-plyandprocurement(c3)” tobeinthefirstrank.
Inthe proposed method, thedecisions makers are considered tohaveequalimportance.Theweightsofdecisionmakerscan dif-ferbasedontheirexpertiselevels.Inthissub-section,theweights
Table 11
Relative coefficients of the criteria with respect to scenarios. Scenarios Relative coefficients
c 1 c 2 c 3 c 4 c 5 c 6 S(1) 0.512 0.495 0.493 0.492 0.498 0.487 S(2) 0.514 0.501 0.505 0.501 0.505 0.496 S(3) 0.512 0.495 0.494 0.499 0.5 0.494 S(4) 0.485 0.473 0.483 0.498 0.47 0.5 S(5) 0.511 0.492 0.496 0.492 0.483 0.5 S(6) 0.492 0.486 0.509 0.498 0.483 0.5 S(7) 0.511 0.496 0.495 0.496 0.501 0.49 S(8) 0.45 0.4 4 4 0.475 0.476 0.424 0.5
of decisionmakers are changedby usingone at a time sensitiv-ity analysis. The relative coefficients of the criteria obtained by the sensitivityanalysisaregivenin Fig.3.It isobservedthat the tendency of decision factors is different among decision makers. WhileDM1andDM2areexperiencingstableandconstantgrowth, DM3 receiveskindofincremental growth.Thechangesinthefirst and second decision makers’ weights do not change the ranking ofquality(c1).Itkeepsits positionasthefirstrank.However,the ranking of c1 changes when the weight of DM3 becomes larger thanabout0.7.After thispoint,“supplyandprocurementflexibility (c3)” takesthefirstrank.
6. Conclusionandfutureinvestigations
In this paper, we propose a new MADM based fuzzy QFD methodology. TheclassicalQFD isextendedby usinginterval val-uedfuzzysetsandgreyrelationalanalysisinordertoincrease pre-cisenessanddecreasevagueness. Thegreyrelationalcoefficientis used intheproposed fuzzyQFD tomeasure thesimilarity tothe idealsolution.
The article adopts fuzzy extension of QFD and GRA decision aidunderintervaltype-2fuzzyvariables.Weappliedtheproposed modeltoperformance measurementofthesupplychain.The pro-posed modelprovides aframework forsharing knowledge ofthe supply chain decisionmaking process. It is able to take into ac-count thesubjectivityofthesupplychaintocope withimprecise conditions in an ever complex decision environment. Conversely, integrating customers’subjective judgment into thesupply chain performance is considerably practical. Our findings indicate that aggregationofthegrayrelationaldistancemeasurementwith qual-ityfunctiondeploymentwiththebenefitofagroupdecision mak-ingsystembringssufficientcapacityindealingwithfuzziness.The sensitivityanalysisisemployedtochecktherobustnessofthe ob-tainedrankingswithrespecttothechangesintheweightsof fac-torsandtheweightsofdecisionmakers.Thequalityofservice(c1) isaninsensitivecriteriontothechangesintheseweights.
The investigationteam andsupplychain expertsinthisstudy agree that the proposed decision making approach is acceptable andcapableofassistingcompanyinfurtheractions.Thisprepares managers tothink of implementing the modelpractically, to en-large it. It opens a window inthe scientific based decision plat-forms of the entire organization. The results of the model can be analyzed tounderstand theweakness andstrongpoints of all thesupplyindicators.Inthisstudy,wemadeaneffort todevelop a foundation for company to identify, analyze andmonitor sup-plyandlogistic dimensionsaccordingtocustomer/stakeholder at-titude.Thisisan initiativeformanagerstosavetime, moneyand workforceandmovetowardaproductivesupplychainsystem.Itis assuredthatourproposedmodelallowsthecompanypolicy mak-erstoactivelyparticipatetothedecisionmakingprocessandto ul-timatelyachievecompanyglobalvaluesbasedonthedetailed cus-tomer parametersandneeds. Evaluationofthedrives reflectsthe
performanceofthesupplychainstrategiesandgivesthemanagers thechancetorethinkaboutsupplychainpracticesandoperations. Anotherwaytogetbenefitfromthismodelforinstanceistoadopt andapplyittoothersectorsofthecompanylikeMarketing strat-egy, humanresource andquality management system to namea few.
The proposed framework is based on multi-expert and intel-ligent group decision making. Through the gray relational analy-sis, the integratedversion ofQFD andGRAunderinterval-valued fuzzyenvironmenthassuccessfullyremovedtheenormousvolume ofEuclideandistancecomputations.Thegrayrelationalcoefficient has beenintegratedto thefuzzyQFD tomeasure thedistance of potential solutions from ideal solutions. The proposed intelligent framework couldprocesstheexperts’linguisticassessments effec-tively.Thesecontributions makeourframework superiorto other similarapproaches.
It is recommendedto seek intheseareas to build further re-search direction. (1) QFD is flexible, its application is wide and can be applied/adjusted to other decision making techniques or weighting toolslike SWARA, DEMATEL etc. (2) Each fuzzy
exten-sion has the capacity in making decision convenient, consistent andlesscomplex,Fuzzyextension ofQFDandGRAmustbe con-sideredsuchasintuitionisticfuzzysets,type-2fuzzysets,hesitant fuzzy sets,neutrosophic sets,fuzzymulti setsandnon-stationary fuzzyaresomeexamples.(3)Oneofthesignificanttopicsin sup-ply chain is supplier selection problem; the future research can shifttotheutilizationofanyfuzzyQFDextensionswiththe appli-cation ofthe rank-based methodsasTOPSIS, VIKOR,COPRAS and MABAC, EDAS, MOORAetc. The task ofQFD is to set the impor-tancedegreesofdecisionfactorsandthementionedmethods pro-duce the supplier priorities. (4) The contribution of rough based multi attributedecisionmaking isincreasingly growing andisan interesting topicformanyresearchprojects,thereforeone can di-rect a rough based approachcombined tosome newborn MADM and comparethe resultswithother similar projects toverifythe performance.Obviouslythismodelisabletobeestablishedin var-iousmanagementdecisionmakingareas.
References
Accorsi, R. , Manzini, R. , & Maranesi, F. (2014). A decision-support system for the design and management of warehousing systems. Computers in Industry, 65 (1), 175–186 .
Arsenyan, J. , & Büyüközkan, G. (2016). An integrated fuzzy approach for information technology planning in collaborative product development. International Journal
of Production Research, 54 (11), 3149–3169 .
Ashtiani, B. , Haghighirad, F. , Makui, A. , & ali Montazer, G. (2009). Extension of fuzzy TOPSIS method based on interval-valued fuzzy sets. Applied Soft Computing, 9 (2), 457–461 .
Aya ˘g, Z. , Samanlioglu, F. , & Büyüközkan, G. (2013). A fuzzy QFD approach to de- termine supply chain management strategies in the dairy industry. Journal of
Intelligent Manufacturing, 24 (6), 1111–1122 .
Bhattacharya, A. , Mohapatra, P. , Kumar, V. , Dey, P. K. , Brady, M. , & Ti- wari, M. K. ,&Nudurupati,S. S. (2014). Green supply chain performance measure- ment using fuzzy ANP-based balanced scorecard: A collaborative decision-mak- ing approach. Production Planning & Control, 25 (8), 698–714 .
Bevilacqua, M. , Ciarapica, F. E. , & Giacchetta, G. (2006). A fuzzy-QFD approach to supplier selection. Journal of Purchasing and Supply Management, 12 (1), 14–27 . Bigand, A. , & Colot, O. (2010). Fuzzy filter based on interval-valued fuzzy sets for
image filtering. Fuzzy Sets and Systems, 161 (1), 96–117 .
Bottani, E. , & Rizzi, A. (2006). Strategic management of logistics service: A fuzzy QFD approach. International Journal of Production Economics, 103 (2), 585–599 . Büyüközkan, G. , & Çifçi, G. (2012). A new incomplete preference relations based ap-
proach to quality function deployment. Information Sciences, 206 , 30–41 . Büyüközkan, G. , & Cifci, G. (2013). An integrated QFD framework with multiple for-
matted and incomplete preferences: A sustainable supply chain application. Ap-
plied Soft Computing, 13 (9), 3931–3941 .
Büyüközkan, G. , & Güleryüz, S. (2015). Extending fuzzy QFD methodology with GDM approaches: An application for IT planning in collaborative product develop- ment. International Journal of Fuzzy Systems, 17 (4), 544–558 .
Cantor, D. , Blackhurst, J. , Pan, M. , & Crum, M. (2014). Examining the role of stake- holder pressure and knowledge management on supply chain risk and de- mand responsiveness. The International Journal of Logistics Management, 25 (1), 202–223 .
Celik, M. , Cebi, S. , Kahraman, C. , & Er, I. D. (2009). An integrated fuzzy QFD model proposal on routing of shipping investment decisions in crude oil tanker mar- ket. Expert Systems with Applications, 36 (3), 6227–6235 .
Chen, Y. Z. , & Ngai, E. W. T. (2008). A fuzzy QFD program modelling approach using the method of imprecision. International Journal of Production Research, 46 (24), 6 823–6 840 .
Chen, Y. , Fung, R. Y. , & Tang, J. (2006). Rating technical attributes in fuzzy QFD by integrating fuzzy weighted average method and fuzzy expected value operator.
European Journal of Operational Research, 174 (3), 1553–1566 .
Deng, J. (1989). Control problems of grey systems. Systems and Control Letters, 1 , 288–294 .
Fu, X. , Zhu, Q. , & Sarkis, J. (2012). Evaluating green supplier development programs at a telecommunications systems provider. International Journal of Production
Economics, 140 (1), 357–367 .
Guo, Z. X. , Ngai, E. W. T. , Yang, C. , & Liang, X. (2015). An RFID-based intelligent decision support system architecture for production monitoring and scheduling in a distributed manufacturing environment. International journal of production
economics, 159 , 16–28 .
Genovese, A. , Acquaye, A. A. , Figueroa, A. , & Koh, S. L. (2017). Sustainable supply chain management and the transition towards a circular economy: Evidence and some applications. Omega, 66 , 344–357 .
Golmohammadi, D. , & Mellat-Parast, M. (2012). Developing a grey-based decision– making model for supplier selection. International Journal of Production Eco-
nomics, 137 (2), 191–200 .
Gorzałczany, M. B. (1989). An interval-valued fuzzy inference method—some basic properties. Fuzzy Sets and Systems, 31 (2), 243–251 .
Haq, A. N. , & Boddu, V. (2017). Analysis of enablers for the implementation of leagile supply chain management using an integrated fuzzy QFD approach. Journal of
Intelligent Manufacturing, 28 (1), 1–12 .
Hashemi, S. H. , Karimi, A. , & Tavana, M. (2015). An integrated green supplier se- lection approach with analytic network process and improved Grey relational analysis. International Journal of Production Economics, 159 , 178–191 .
Huang, S. J. , Chiu, N. H. , & Chen, L. W. (2008). Integration of the grey relational analysis with genetic algorithm for software effort estimation. European Journal
of Operational Research, 188 (3), 898–909 .
Turksen, I. B. (1996). Interval-valued strict preference with Zadeh triples,. Fuzzy Sets
and Systems, 78 , 183–195 .
Ignatius, J. , Rahman, A. , Yazdani, M. , Šaparauskas, J. , & Haron, S. H. (2016). An Inte- grated fuzzy ANP–QFD approach for green building assessment. Journal of Civil
Engineering and Management, 22 (4), 551–563 .
Jamalnia, A. , Mahdiraji, H. A. , Sadeghi, M. R. , Hajiagha, S. H. R. , & Feili, A. (2014). An integrated fuzzy QFD and fuzzy goal programming approach for global facil- ity location-allocation problem. International Journal of Information Technology &
Decision Making, 13 (02), 263–290 .
Kahraman, C. , Öztay ¸s i, B. , Sarı, ˙I. U. , & Turano ˘glu, E. (2014). Fuzzy analytic hierarchy process with interval type-2 fuzzy sets. Knowledge-Based Systems, 59 , 48–57 . Kuo, M. S. , Liang, G. S. , & Huang, W. C. (2006). Extensions of the multicriteria anal-
ysis with pairwise comparison under a fuzzy environment. International Journal
of Approximate Reasoning, 43 (3), 268–285 .
Kuo, Y. , Yang, T. , & Huang, G. W. (2008). The use of grey relational analysis in solv- ing multiple attribute decision-making problems. Computers & Industrial Engi-
neering, 55 (1), 80–93 .
Koh, S. L. , Genovese, A . , Acquaye, A . A . , Barratt, P. , Rana, N. , & Kuylen- stierna, J. (2013). Decarbonising product supply chains: Design and development of an integrated evidence-based decision support system–the supply chain en- vironmental analysis tool (SCEnAT). International Journal of Production Research,
51 (7), 2092–2109 .
Zadeh, L. (1975). The concept of a linguistic variable and its application to approxi- mate reasoning - I. Information Science, 8 , 199–249 .
Lee, A. H. , & Lin, C. Y. (2011). An integrated fuzzy QFD framework for new product development. Flexible Services and Manufacturing Journal, 23 (1), 26–47 . Li, G. D. , Yamaguchi, D. , & Nagai, M. (2008). A grey-based rough decision-making
approach to supplier selection. The International Journal of Advanced Manufac-
turing Technology, 36 (9-10), 1032 .
Li, M. , Jin, L. , & Wang, J. (2014). A new MCDM method combining QFD with TOP- SIS for knowledge management system selection from the user’s perspective in intuitionistic fuzzy environment. Applied Soft Computing, 21 , 28–37 .
Liang, G. S. (2010). Applying fuzzy quality function deployment to identify ser- vice management requirements for customer quality needs. Quality & Quantity,
44 (1), 47–57 .
Lima-Junior, F. R. , & Carpinetti, L. C. R. (2016). A multi criteria approach based on fuzzy QFD for choosing criteria for supplier selection. Computers & Industrial
Engineering, 101 , 269–285 .
Lin, C. T. , Chang, C. W. , & Chen, C. B. (2006). The worst ill-conditioned silicon wafer slicing machine detected by using grey relational analysis. The International Jour-
nal of Advanced Manufacturing Technology, 31 (3-4), 388–395 .
Lin, L. Z. , Huang, L. C. , & Yeh, H. R. (2012). Fuzzy group decision-making for ser- vice innovations in quality function deployment. Group Decision and Negotiation,
21 (4), 495–517 .
Liu, X. , Yang, J. , Qu, S. , Wang, L. , Shishime, T. , & Bao, C. (2012). Sustainable produc- tion: practices and determinant factors of green supply chain management of Chinese companies. Business Strategy and the Environment, 21 (1), 1–16 . Lolli, F. , Ishizaka, A. , Gamberini, R. , Rimini, B. , & Messori, M. (2015). Flow-
Sort-GDSS–A novel group multi-criteria decision support system for sorting problems with application to FMEA. Expert Systems with Applications, 42 (17), 6342–6349 .
Ma, H. , Chu, X. , Xue, D. , & Chen, D. (2016). Identification of to-be-improved compo- nents for redesign of complex products and systems based on fuzzy QFD and FMEA. Journal of Intelligent Manufacturing , 1–17 .
Morán, J. , Granada, E. , Míguez, J. L. , & Porteiro, J. (2006). Use of grey relational anal- ysis to assess and optimize small biomass boilers. Fuel Processing Technology,
87 (2), 123–127 .
Ngai, E. W. T. , Peng, S. , Alexander, P. , & Moon, K. K. (2014). Decision support and intelligent systems in the textile and apparel supply chain: An academic review of research articles. Expert Systems with Applications, 41 (1), 81–91 .
Olson, D. L. , & Wu, D. (2006). Simulation of fuzzy multi attribute models for grey relationships. European Journal of Operational Research, 175 (1), 111–120 . Onar, S. Ç. , Büyüközkan, G. , Öztay ¸s i, B. , & Kahraman, C. (2016). A new hesitant fuzzy
QFD approach: An application to computer workstation selection. Applied Soft
Computing, 46 , 1–16 .
Patil, S. K. , & Kant, R. (2014). A fuzzy AHP-TOPSIS framework for ranking the so- lutions of Knowledge Management adoption in Supply Chain to overcome its barriers. Expert Systems with Applications, 41 (2), 679–693 .
Rajesh, R. , & Ravi, V. (2015). Supplier selection in resilient supply chains: A grey relational analysis approach. Journal of Cleaner Production, 86 , 343–359 .
RUC-APS project. https://ruc-aps.eu/ .
Sarıkaya, M. , & Güllü, A. (2015). Multi-response optimization of minimum quantity lubrication parameters using Taguchi-based grey relational analysis in turning of difficult-to-cut alloy Haynes 25. Journal of Cleaner Production, 91 , 347–357 . Seuring, S. (2013). A review of modeling approaches for sustainable supply chain
management. Decision support systems, 54 (4), 1513–1520 .
Shi, J. , Guo, J. E. , & Fung, R. Y. (2017). Decision support system for purchasing man- agement of seasonal products: A capital-constrained retailer perspective. Expert
Systems with Applications, 80 , 171–182 .
Song, W. , Ming, X. , & Han, Y. (2014). Prioritizing technical attributes in QFD un- der vague environment: A rough-grey relational analysis approach. International
Journal of Production Research, 52 (18), 5528–5545 .
Tavana, M. , Yazdani, M. , & Di Caprio, D. (2017). An application of an integrated AN- P–QFD framework for sustainable supplier selection. International Journal of Lo-
gistics Research and Applications , 1–22 .
Vahdani, B. , Hadipour, H. , Sadaghiani, J. S. , & Amiri, M. (2010). Extension of VIKOR method based on interval-valued fuzzy sets. The International Journal of Ad-
vanced Manufacturing Technology, 47 (9-12), 1231–1239 .
Vinodh, S. , & Kumar Chintha, S. (2011). Application of fuzzy QFD for enabling lean- ness in a manufacturing organisation. International Journal of Production Re-
search, 49 (6), 1627–1644 .
Wang, G. , & Li, X. (1998). The applications of interval-valued fuzzy numbers and interval-distribution numbers. Fuzzy Sets and Systems, 98 , 331–335 .
Wang, Y. J. (2014). A criteria weighting approach by combining fuzzy quality func- tion deployment with relative preference relation. Applied Soft Computing, 14 , 419–430 .
Wong, M. L. , & Guo, Y. Y. (2008). Learning Bayesian networks from incomplete databases using a novel evolutionary algorithm. Decision Support Systems, 45 (2), 368–383 .
Wu, H. H. (2006). Applying grey model to prioritize technical measures in quality function deployment. The International Journal of Advanced Manufacturing Tech-
nology, 29 (11-12), 1278–1283 .
Wu, J. , & Chiclana, F. (2012). Non-dominance and attitudinal prioritisation methods for intuitionistic and interval-valued intuitionistic fuzzy preference relations. Ex-
pert Systems with Applications, 39 (18), 13409–13416 .
Hsu, C. H. , Chang, A. Y. , & Luo, W. (2017). Identifying key performance factors for sustainability development of SMEs–integrating QFD and fuzzy MADM methods.
Journal of Cleaner Production, 161 , 629–645 .
Xia, X. , Govindan, K. , & Zhu, Q. (2015). Analyzing internal barriers for automo- tive parts remanufacturers in China using grey-DEMATEL approach. Journal of
Cleaner Production, 87 , 811–825 .
Yang, C. C. , & Chen, B. S. (2006). Supplier selection using combined analytical hier- archy process and grey relational analysis. Journal of Manufacturing Technology
Management, 17 (7), 926–941 .
Yang, S. , Ong, S. K. , & Nee, A. Y. C. (2013). Design for remanufacturing-A Fuzzy-QFD approach. In Re-engineering manufacturing for sustainability (pp. 655–661). Sin- gapore: Springer .
Yang, Y. Q. , Wang, S. Q. , Dulaimi, M. , & Low, S. P. (2003). A fuzzy quality function deployment system for buildable design decision-makings. Automation in Con-
struction, 12 (4), 381–393 .
Yao, J. S. , & Lin, F. T. (2002). Constructing a fuzzy flow-shop sequencing model based on statistical data. International Journal of Approximate Reasoning, 29 (3), 215–234 .
Yazdani, M. , Hashemkhani Zolfani, S. , & Zavadskas, E. K. (2016). New integration of MCDM methods and QFD in the selection of green suppliers. Journal of Business
Economics and Management, 17 (6), 1097–1113 .
Yazdani, M. , Chatterjee, P. , Zavadskas, E. K. , & Zolfani, S. H. (2017). Integrated QFD-MCDM framework for green supplier selection. Journal of Cleaner Produc-
tion, 142 , 3728–3740 .
Yazdani, M. , Zarate, P. , Coulibaly, A. , & Zavadskas, E. K. (2017). A group decision mak- ing support system in logistics and supply chain management. Expert Systems
with Applications, 88 , 376–392 .
Yeh, T. M. , & Chen, S. H. (2014). Integrating refined Kano model, quality function deployment, and grey relational analysis to improve service quality of nurs- ing homes. Human Factors and Ergonomics in Manufacturing & Service Industries,
24 (2), 172–191 .