Ancillary Services in the Airline Industry: Passenger Choice
and Revenue Management Optimization
by
Adam Bockelie
Bachelor of Science, Massachusetts Institute of Technology (2011)
Master of Engineering, Massachusetts Institute of Technology (2012)
Submitted to the Department of Civil and Environmental Engineering
in partial fulfillment of the requirements for the degree of
Doctor of Philosophy in Transportation
at the
MASSACHUSETTS INSTITUTE OF TECHNOLOGY
February 2019
Massachusetts Institute of Technology 2019. All rights reserved.
Signature redacted
Author ...
Department of Civil and Environmental Engineering
January 16, 2019
Signature redacted
C ertified by ...
...
Peter P. Belobaba
Principal Research Scientist in Aeronautics and Astronautics
Thesis Supervisor
Signature redacted
Accepted by...
Donald and Martha Harleman Professor
MASSACHUSETS INSTIUTEOF TECHNOWGY
LIBRARIES
...
Heidi Nepf
of Civil and Environ mental Engineering
Chair, Graduate FProgram Committee
co,77 Massachusetts Avenue
Cambridge, MA 02139 http://Iibraries.mit.edu/ask
MITLibraries
DISCLAIMER NOTICE
Due to the condition of the original material, there are unavoidable
flaws in this reproduction. We have made every effort possible to
provide you with the best copy available.
Thank you.
The images contained in this document are of the
best quality available.
Background speckling on numerous pages.
Ancillary Services in the Airline Industry: Passenger Choice and
Revenue Management Optimization
by
Adam Bockelie
Submitted to the Department of Civil and Environmental Engineering on January 16, 2019, in partial fulfillment of the
requirements for the degree of Doctor of Philosophy in Transportation
Abstract
The recent proliferation of ancillary services means that airline passengers can face sub-stantially different ancillary service prices and offerings based on their itinerary and fare class selection. At the same time, airlines have become interested in accounting for this supplementary revenue stream in their revenue management (RM) systems to maximize total, not just ticket, revenue. This thesis develops models for both of these issues, with a goal of providing a better understanding of how ancillary services affect the airline industry. We develop the Ancillary Choice Model (ACM) to describe how passengers make purchase decisions about ancillary services in conjunction with the selection of a fare class. We model two extremes of passenger knowledge and awareness of ancillary services, which we term
simultaneous and sequential. We show that under the simultaneous model, the presence
and price of ancillary services can affect the fare class selection of a passenger, even when all fare classes have the same ancillary prices.
The second part of this thesis studies total revenue optimization. We provide a detailed assessment of a prior total revenue maximization approach, the Optimizer Increment (01), proving that it can be an optimal revenue management strategy under limited conditi-ons, but also showing through the Passenger Origin-Destination Simulator (PODS) that it decreases revenue in more realistic environments.
We then develop a new revenue management optimization model, the Ancillary Choice Dy-namic Program (ACDP), which maximizes total revenue by explicitly including the revenue and fare class choice impacts of ancillary services. We describe an Ancillary Marginal De-mand (AMD) and Ancillary Marginal Revenue (AMR) transformation that can be used as heuristics to provide the ancillary and choice awareness benefits of ACDP to existing RM optimization models.
We test the revenue performance of our new AMD and AMR heuristics using PODS in a wide range of scenarios. In a network with competing airlines and hundreds of flights, our heuristics can increase total revenue by 2-3%. A consistent trend throughout our simulations is that the forecasting and optimization model that maximizes total revenue is often not the model that maximizes ancillary revenue, because models that maximize ancillary revenue often do so to the detriment of ticket revenue.
Thesis Supervisor: Peter P. Belobaba
Acknowledgments
I would like to thank my advisor, Peter Belobaba, for the wealth of knowledge he has passed to me. He has always provided very helpful feedback and support, allowing me to explore my interests. His mentorship has made me a better researcher.
My committee members, Carolina Osorio and Moshe Ben-Akiva, have also contributed to my learning and their suggestions have improved this thesis.
The feedback and funding from the members of MIT PODS Research Consortium has made this work possible. In particular, I'd like to thank Jonas Rauch, Eric Ruhlin, Dan Zawack, Thomas Fiig, Richard Cleaz-Savoyen, and Emmanuel Carrier for their very helpful discussions, as well as Amadeus for hosting me for a summer research visit. I would also like to thank the airline that supplied data for the choice model calibration in Appendix A. Testing the models developed in this thesis required modifying nearly every aspect of the PODS simulator, an extensive task accomplished by Craig Hopperstad and Matt Berge. Thank you for programming my wild ideas and for finding many unanswered implementation questions.
My sincerest thanks go to my friend and colleague Mike Wittman. You have been a con-stant source of much appreciated advice. Our extensive conversations on esoteric revenue management topics have helped me shape my views, improve my research, and enjoy my time in ICAT.
Of course there is more to life than convex hulls and ancillary services, and I'm grateful to have friends in Boston and beyond who remind me to take a break to ski, play games, or enjoy the beach.
None of this would have been possible without the lifelong support of my parents, who have always encouraged me to pursue my dreams. Thank you.
Contents
1 Introduction
1.1 Motivation and Context . . . .
1.1.1 Ancillary Revenue Reporting and Data Sources . . . .
1.1.2 Ancillary Service History and Trends . . . . 1.1.3 Overview of the Airline Industry . . . .
1.2 Research Objectives and Contributions . . . .. 1.3 Thesis O utline . . . .
I Impacts of Ancillary Services on Passenger Behavior
2 Literature Review: Passenger Behavior
2.1 Characteristics of the Passenger Choice Problem ... 2.2 Framework for Discrete Choice Modeling . . . .
2.2.1 Decision Rules . . . . 2.2.2 Rationality . . . .
2.2.3 Mathematical Formulations . . . .
2.3 Previous Approaches . . . .
2.3.1 Airline Passenger Choice . . . .
21 . . . . 22 . . . . 23 . . . . 25 . . . . 30 . . . . 34 . . . . 36
38
39 40 44 44 45 46 49 492.3.2 Bundled Goods . . . .
2.3.3 Add-ons . . . . .
2.4 Key Literature Gaps . . . .
3 Ancillary Choice Model
3.1 Model Formulation and Definitions . . . .
3.1.1 Sequential Passengers . . . .
3.1.2 Simultaneous Passengers . . . .
3.1.3 Key Differences in Behaviors . . .
3.1.4 Differences from Previous Models . 3.2 Passenger Origin-Destination Simulator .
3.2.1 Passenger Module . . . .
3.2.2 Airline Module . . . .
3.2.3 Networks . . . .
3.3 Booking and Revenue Impacts . . . .
3.4 Conclusions . . . .
II Revenue Management with Ancillary Services
4 Literature Review: Airline Revenue Management
4.1 Independent Demand Revenue Management ... 4.2 Choice-aware Revenue Management ...
4.3 Ancillary-aware Revenue Management ... 4.4 Key Literature Gaps ...
5 NaYve Total Revenue Optimization: The Optimizer Increment 6 51 . . 52 . . 54 56 . . . . 5 7 . . . . 5 9 . . . . 6 3 . . . . 6 4 . . . . 6 8 . . . . 6 8 . . . . 7 0 . . . . 7 4 . . . . 7 9 . . . . 7 9 . . . . 8 5
88
89 90 93 95 96 985.1 Optimality of the Optimizer Increment . . . . .
5.2 Simulated Performance of Optimizer Increment . . . . .
5.2.1 Result Analysis Methodology . . . . 5.2.2 Littlewood Conditions (Network C2) . . . . 5.2.3 One Airline, One Flight Leg Network (AlONE) 5.2.4 Two Airline, Many Flight Leg Network (D6) . 5.3 Conclusions . . . .
6 Ancillary Choice Dynamic Program
6.1 Model Formulation . . . . 6.1.1 Practical Constraints and Limitations . . . . 6.1.2 Ancillary Marginal Demand Transformation and Revenue Transformation Heuristics . . . . 6.1.3 Equivalence to Other Models
. . . . 99 . . . . 102 . . . . 103 . . . . 105 . . . . 116 . . . . 121 . . . . 131 133 135 139 . . . . Ancillary Marginal 141 . . . . 1 4 3 6.2 Operationalization . . . . 6.2.1 Gap-Filling . . . . 6.2.2 Demand Forecasting . . . . 6.2.3 Process Summary . . . .
6.3 Use in Larger Networks . . . .
6.4 Estimating Choice Probabilities . . . . 6.4.1 Raw Estimates . . . . 6.4.2 Heuristic Estimates . . . .
6.5 Conclusions . . . .
7 Simulated Performance of AMD and AMR
149 149 156 158 159 160 160 161 164 166
7.1 AMD and AMR Implementation within PODS .
7.2 Result Analysis Methodology . . . . 7.3 One Airline, One Flight Leg Network (A1ONE) . . . . 7.3.1 Experimental Outline . . . . 7.3.2 Initial Results . . . .
7.3.3 Effect of Gap-Filling . . . .
7.3.4 Sensitivity to Ancillary Prices and Disutilities . 7.3.5 Sensitivity to Demand Level . . . . 7.3.6 Sensitivity to Passenger Behavior Type . . . .
7.4 Two Airline, Two Flight Leg Network (A2TWO) . . .
7.4.1 Symmetric Competition . . . . 7.4.2 Asymmetric Competition . . . . 7.4.3 Choice Probability Estimation . . . .
7.5 Two Airline, Many Flight Leg Network (D6) . . . . 7.5.1 Symmetric Competition . . . . 7.5.2 Asymmetric Competition . . . . 7.5.3 Sample-by-Sample Analysis . . . . 7.6 Experiment Limitations . . . . 7.7 Conclusions . . . . 8 Conclusions
8.1 Research Findings and Contributions . . . . 8.2 Future Research Directions . . . .
A Calibrating the Ancillary Choice Model
. . . . 167 . . . . 168 . . . . 169 . . . . 171 . . . . 172 . . . . 177 . . . . 180 . . . . 183 . . . . 187 . . . . 198 . . . . 199 . . . . 204 . . . . 210 . . . . 218 . . . . 222 . . . . 226 . . . . 234 . . . . 236 . . . . 237 239 239 243 248 8
A.1 Airline Data. . . . .
A.2 Calibration Network
A.3 Calibration Process.
A.4 Results. . . . . A.5 Conclusions . . . . .
B Proofs
B.1 Proof of Optimizer Increment Convexity . . . . C Impact of Correlations Between Samples
C.1 Assessment of Correlations Between Samples . . . . C.2 Alternative Experimental Structure: More Trials, Fewer Samples . . . . . C .3 Conclusions . . . . . . . . . . . . . . . . . . . . . . . . 249 250 252 255 259 261 261 264 265 269 270
List of Figures
1.1 Portion of revenue from ancillary services for Ryanair, Allegiant, and Spirit
airlines . . . . 26
1.2 Baggage revenue for US network airlines . . . . 28
1.3 Total ancillary revenue for US airlines . . . . 29
1.4 Airline distribution system schematic. . . . 33
2.1 Possible dimensions in the airline passenger choice problem . . . . 41
3.1 Schematic view of Passenger Origin-Destination Simulator. Modified from W ittm an (2018). . . . . 70
3.2 Cumulative demand arrival curves for consumers in domestic markets in Net-work IJ10 ... ... ... 72
3.3 Standard FRAT5 curves in PODS . . . . 76
3.4 Network U10 map. . . . . 80
3.5 Network U10 enplanements by fare brand for fully bundled, partial bundling, and fully a la carte cases. . . . . 85
3.6 Network U10 change in enplanements by fare class for the fully a la carte case vs fully bundled case. . . . . 86
5.1 Network C2 change in total revenue due to optimizer increment vs baseline with various ancillary prices and market demand levels (known demand). . 107
5.2 Network C2 change in total revenue due to optimizer increment and 99% con-fidence interval vs baseline with various ancillary prices and market demand levels (known demand). . . . . 107 5.3 Network C2 change in bookings by fare class (left) and change in revenue
component (right) due to optimizer increment vs baseline with various ancil-lary prices (known demand, FC 1 p = 60, FC 2 p = 60). . . . . 109 5.4 Network C2 change in total revenue due to optimizer increment vs baseline
with various ancillary prices and market demand levels (forecasted demand). 110 5.5 Network C2 change in total revenue and 99% confidence interval vs baseline
with various ancillary prices and market demand levels (forecasted demand). 110 5.6 Network C2 change in bookings by fare class (left) and change in revenue
component (right) due to optimizer increment vs baseline with various ancil-lary prices (forecasted demand, FC 1 p = 60, FC 2 p = 60). . . . . 112
5.7 Network C2 total revenue with known and forecasted demand and with va-rious ancillary prices (FC 1 p = 60, FC 2 p = 60). . . . . 113
5.8 Network C2 baseline FC 1 forecast and baseline revenue components (FC 1
p = 60, FC 2 p = 60, $100 ancillary price). . . . . 114 5.9 Network C2 change in baseline total revenue due to demand forecasting vs
known demand with various ancillary prices and market demand levels. . . 115 5.10 Network AlONE change in total revenue due to optimizer increment and 99%
confidence interval vs baseline with various ancillary prices, market demand levels, and disutility scenarios (100% simultaneous passengers). . . . . 119 5.11 Network D6 map. . . . . 122 5.12 Network D6 change in Airline 1 and Airline 2 total revenue revenue due
to symmetric optimizer increment and 99% confidence interval vs baseline with various market demand levels and passenger behavior types (equally appealing disutility scenario). . . . . 124 5.13 Network D6 change in Airline 1 revenue component (left) and change in
book-ings by fare class (right) due to symmetric optimizer increment vs baseline with various market demand levels (100% simultaneous passengers, equally appealing disutility scenario). . . . . 125
5.14 Network D6 change in Airline 1 bookings by fare class and DCP due to sym-metric optimizer increment vs baseline (medium demand, 100% simultaneous passengers, equally appealing disutility scenario). . . . 126 5.15 Network D6 change in Airline 1 total revenue and change in Airline 1
re-venue component due to asymmetric optimizer increment vs baseline with various market demand levels and passenger behavior types (100% simulta-neous passengers for revenue component change, equally appealing disutility scenario). . . . . 127 5.16 Network D6 empirical cumulative distribution function of change in total
revenue by sample due to symmetric optimizer increment and asymmetric optimizer increment vs baseline (medium demand, 100% simultaneous pas-sengers, equally appealing disutility scenario). . . . 128 5.17 Network D6 actual and estimated Airline 1 average ancillary revenue per
passenger by fare class with symmetric optimizer increment using histori-cal average ancillary revenue per booking and historihistori-cal average ancillary purchase rate (medium demand, 100% simultaneous passengers, equally ap-pealing disutility scenario). . . . . 130 6.1 Portion of an example convex hull, showing efficient policies in blue circles
and inefficient policies in red squares. The slope (AMR adjusted fare) of various segments is indicated, with emphasis in red for inverted fares and in blue for gap-filled fares. . . . 152 6.2 AMD/AMR process diagram when used as a heuristic in conjunction with
EM SR .. . . . ... . . . 158
7.1 Cumulative average business and leisure consumer arrival curves. . . . 171 7.2 Total sale probability TPcp(k) for each class as computed by the airline
prior to any gap-filling (100% simultaneous passengers, $50 mean ancillary disutility, $50 ancillary price). . . . . 173 7.3 Change in bookings by fare class vs baseline (medium demand, 100%
simul-taneous passengers, $50 mean ancillary disutility, $50 ancillary price). . . . 176 7.4 Initial (DCP 1) demand and ticket revenue forecasts (medium demand, 100%
simultaneous passengers, $50 mean ancillary disutility, $50 ancillary price). 178 7.5 Availability for first 8 DCPs (medium demand, 100% simultaneous
passen-gers, $50 mean ancillary disutility, $50 ancillary price)... 178
7.6 Change in bookings by fare class vs baseline with various gap-filling settings (medium demand, 100% simultaneous passengers, $50 mean ancillary disuti-lity, $50 ancillary price). . . . . 181
7.7 Network AlONE change in total revenue vs baseline with various ancillary prices and disutility scenarios (medium demand, 100% simultaneous passen-gers). . . . . 182
7.8 Load factor with various ancillary disutility scenarios and prices (medium demand, 100% simultaneous passengers) . . . . 183
7.9 Change in bookings by fare class vs relevant baseline due to AMD and AMR with various ancillary disutility scenarios and prices (medium demand, 100% simultaneous passengers). . . . . 184
7.10 Network AlONE change in total revenue vs baseline with various ancillary prices and market demand levels (100% simultaneous passengers, $50 ancil-lary disutilities). . . . . 186
7.11 Load factor with various ancillary prices and market demand levels (100% simultaneous passengers, mean ancillary disutility equal to ancillary price). 186
7.12 Change in bookings by fare class vs relevant baseline due to AMD and AMR with various market demand levels (100% simultaneous passengers, $50 mean ancillary disutility, $50 ancillary price). . . . . 188
7.13 Change in ticket revenue by fare class vs relevant baseline due to AMD and AMR with various market demand levels (100% simultaneous passengers, $50 mean ancillary disutility, $50 ancillary price). . . . . 188
7.14 Ancillary purchase rate by fare class for baseline with various passenger be-havior types (medium demand, $50 mean ancillary disutility, $50 ancillary price). . . . . 190
7.15 Ancillary purchase rate for baseline with various passenger behavior types and with various ancillary disutilities and prices (medium demand). . . . . 191
7.16 Change in total revenue vs baseline with various passenger behavior types (medium demand, $50 mean ancillary disutility, $50 ancillary price). . . . . 194 7.17 Change in bookings by fare class vs baseline with various passenger behavior
types (medium demand, $50 mean ancillary disutility, $50 ancillary price). . 195
7.18 Network AlONE change in total revenue vs baseline with various ancillary prices and disutility scenarios (medium demand, 100% sequential passengers). 196
7.19 Network AlONE change in total revenue due to AMD and AMR vs baseline with various passenger behaviors, ancillary prices, and disutility scenarios (medium demand). . . . . 197 7.20 Network AlONE difference in differences for percentage change in total
re-venue due to AMD and AMR vs baseline for 100% sequential passengers vs 100% simultaneous passengers with various ancillary prices and disutility scenarios (medium demand). . . . . 197 7.21 Network A2TWO change in bookings by fare class due to symmetric AMD
and AMR vs baseline (medium demand, 100% simultaneous passengers, $50 ancillary price, $50 ancillary disutility). . . . 203 7.22 Network A2TWO change in Airline 1 total revenue due to symmetric AMD
and AMR vs baseline with 99% confidence interval with various passenger behaviors, ancillary prices, and disutility scenarios (medium demand). . . . 203 7.23 Network A2TWO change in Airline 1 and Airline 2 total revenue due to
change in ticket and ancillary sales volumes and yields due to asymmetric AMD and AMR vs baseline (medium demand, 100% simultaneous passen-gers, $50 ancillary price, $50 ancillary disutility). . . . 206 7.24 Network A2TWO change in bookings by fare class (left) and change in Airline
2 initial demand forecast mean (right) due to asymmetric AMD and AMR vs baseline (medium demand, 100% simultaneous passengers, $50 ancillary price, $50 ancillary disutility). . . . 207 7.25 Network A2TWO FC 6 availability with symmetric and asymmetric AMD
and AMR (medium demand, 100% simultaneous passengers, $50 ancillary price, $50 ancillary mean disutility). . . . 208 7.26 Network A2TWO change in Airline 1 total revenue due to asymmetric AMD
and AMR vs baseline with 99% confidence interval with various passenger behaviors, ancillary prices, and disutility scenarios (medium demand). . . . 209 7.27 Network A2TWO estimated total sale TPcp(k) for Airline 1 using the raw
estimator (left) or heuristic estimator with FRAT5 D (right) (medium de-mand, 100% simultaneous passengers, $50 ancillary price, $50 mean ancillary disutilities). . . . 211 7.28 Network A2TWO change in Airline 1 AMR fare due to estimated choice
probabilities vs true choice probabilities using the raw estimator (left) or heuristic estimator with FRAT5 D (right) (medium demand, 100% simulta-neous passengers, $50 ancillary price, $50 mean ancillary disutilities). . ... 212
7.29 Network A2TWO change in bookings by fare class due to symmetric AMD and AMR with heuristic estimated (FRAT5 D) or true choice probabilities vs baseline (medium demand, 100% simultaneous passengers, $50 ancillary price, $50 ancillary disutility). . . . . 216
7.30 Network A2TWO change in Airline 1 total revenue due to symmetric AMD and AMR with heuristic estimated choice probabilities (FRAT5 D) vs base-line with 99% confidence interval with various passenger behaviors, ancillary prices, and disutility scenarios (medium demand) . . . . 217
7.31 Network D6 change in total revenue and change in system load factor due to symmetric AMD and AMR with heuristic estimated choice probabilities using various FRAT5 curves (100% simultaneous passengers, ancillary price
40% FC 6 fare, equally appealing disutility scenario). . . . . 220 7.32 Network D6 Airline 1 network-averaged AMR fares (left) and fare class
inef-ficiency (right) (100% simultaneous passengers, ancillary price = 40% FC 6 fare, equally appealing disutility scenario). . . . . 221 7.33 Network D6 change in Airline 1 total revenue vs baseline due to
symme-tric AMD and AMR with 99% confidence interval with various passenger behaviors, ancillary prices, and disutility scenarios. . . . . 225
7.34 Network D6 change in total revenue and change in system load factor due to asymmetric AMD and AMR with heuristic estimated choice probabilities using various FRAT5 curves (100% simultaneous passengers, ancillary price = 40% FC 6 fare, equally appealing disutility scenario). . . . . 227
7.35 Network D6 change in system bookings by fare class for symmetric AMD and AMR and asymmetric AMD and AMR (100% simultaneous passengers, ancillary price = 40% FC 6 fare, equally appealing disutility scenario). . . . 228
7.36 Network D6 change in Airline 1 and Airline 2 total revenue by change in ticket and ancillary sales volumes and yields due to asymmetric AMD and AMR vs baseline (100% simultaneous passengers, ancillary price = 40% FC 6 fare, equally appealing disutility scenario). . . . . 229
7.37 Network D6 change in Airline I total revenue by change in ticket and ancillary sales volumes and yields due to asymmetric HF/FA or AMD and AMR vs baseline (100% simultaneous passengers, ancillary price = 40% FC 6 fare, equally appealing disutility scenario) . . . . . 232
7.38 Network D6 change in Airline 1 total revenue vs baseline due to asymie-tric AMD and AMR with 99% confidence interval with various passenger behaviors, ancillary prices, and disutility scenarios. . . . 233 7.39 Network D6 change in Airline 1 total revenue by sample vs baseline due to
symmetric (left) or asymmetric (right) AMD and AMR and baseline total revenue (100% simultaneous passengers, ancillary price = 40% FC 6 fare, equally appealing disutility scenario). . . . 234 7.40 Network D6 empirical CDF of Airline 1 total revenue change vs baseline for
symmetric and asymmetric cases (100% simultaneous passengers, ancillary price = 40% FC 6 fare, equally appealing disutility scenario). . . . 235 A.1 Evolution of total fit error by iteration. . . . . 255 A.2 Portion of revenue from ancillary services for various iterations for
Simulta-neous calibration (domestic markets only) . . . 256 A.3 Portion of revenue from ancillary services (left) and booking mix (right)
broken out by fare brand (domestic markets only) . . . 258 A.4 Ancillary purchase rate per enplanement (domestic markets only) . . . 258 A.5 Average ancillary revenue per enplanement (domestic markets only) . . . . 259 C.1 Network AlONE and Network D6 correlation between sample i and i - I
of total revenue changes due to 01 and AMD/AMR vs baseline for various value of 1 (medium demand, 100% simultaneous passengers, $50 ancillary price for AlONE and ancillary price equal to 40% of FC 6 fare for D6, equally appealing disutilities). . . . 266 C.2 Network D6 Airline 1 total revenue change due to symmetric 01 vs baseline
in sample i - 1 against sample i for 1 E {1, ... , 16} (100% simultaneous passengers, ancillary price = 40% of FC 6 fare, equally appealing disutilities). 267 C.3 Network D6 Airline 1 total revenue change due to symmetric 01 vs baseline
in sample i - I against sample i for 1 E {17, . ., 26} (100% simultaneous passengers, ancillary price = 40% of FC 6 fare, equally appealing disutilities). 268
C.4 Probability density function for t distribution with df = 49 and df = 2,499. 273
List of Tables
1.1 Ancillary service categorization . . . . 22
1.2 History of ancillary revenue at Allegiant Airlines . . . . 27
1.3 IdeaWorks estimates of ten largest airlines by ancillary revenue. . . . . 30
1.4 Restricted Boston-Detroit fare structure for Delta Air Lines in September 2013... ... 32
2.1 Summary of relevant choice modeling literature . . . . 55
3.1 Summary of ancillary choice model notation . . . . 60
3.2 Network UlO fare and ancillary fee structure. . . . . 81
3.3 Network UlO mean disutility ranges and price ranges for each restriction and ancillary service. . . . . 81
3.4 Network UlO Airline 1 simulation results with various ancillary +bundling strategies and passenger behavior types. . . . . 83
5.1 Network C2 fare and ancillary fee structure. . . . . 106
5.2 Network C2 simulation results with various ancillary prices and market de-mand levels (known dede-mand, FC 2 [ = 60). . . . . 108
5.3 Network C2 simulation results with various ancillary prices and market de-mand levels (forecasted dede-mand, FC 2 p = 60). . . . .111
5.4 Network AlONE fare and ancillary fee structure. . . . . 117
5.5 Ancillary disutility scenarios. . . . 117
5.6 Network AlONE baseline bookings and ancillary purchase data by fare class
(medium demand, 100% simultaneous passengers, $50 ancillary price, $50 ancillary disutility). . . . . 118 5.7 Network AlONE simulation results with various ancillary prices (medium
demand, 100% simultaneous passengers, equally appealing disutility scenario). 120 5.8 Network D6 fare and ancillary fee structure. . . . . 121 5.9 Network D6 baseline statistics (medium demand, 100% simultaneous
passen-gers, equally appealing disutility scenario) . . . . 123 5.10 Network D6 Airline 1 baseline bookings and ancillary purchase data by fare
class (medium demand, 100% simultaneous passengers, equally appealing disutility scenario). . . . . 123 5.11 Network D6 experimental outline . . . . 124 6.1 Example AMD mean demand gk, AMR fares
fk,
and associated EMSRbook-ing limits (BL) for DCP 2 with various gap-fillbook-ing methods. . . . . 153 7.1 Network AlONE and A2TWO fare and ancillary fee structure. . . . . 170 7.2 Network AlONE baseline bookings and ancillary purchase data by fare class
(medium demand, 100% simultaneous passengers, $50 ancillary price, $50 ancillary disutility). . . . . 174 7.3 Network AlONE simulation results for baseline and experimental cases
(me-dium demand, 100% simultaneous passengers, $50 ancillary price, $50 ancil-lary aisutilities). . . . . 175 7.4 Network AlONE simulation results for baseline and AMD and AMR cases
with various gap-filling mechanisms (medium demand, 100% simultaneous passengers, $50 ancillary price, $50 ancillary disutilities). . . . . 179 7.5 Network AlONE simulation results for baseline case with various market
de-mand levels (100% simultaneous passengers, $50 ancillary price, $50 ancillary disutilities). . . . . 185 7.6 Network AlONE simulation results for baseline cases with various passenger
behavior types (medium demand, $50 ancillary price, $50 ancillary disutilities).189
7.7 Network AlONE simulation results for baseline and experimental cases (me-diurn demand, 50% simultaneous and 50% sequential passengers, $50 ancil-lary price, $50 ancilancil-lary disutilities). . . . 192
7.8 Network AlONE simulation results for baseline and experimental cases
(me-dium demand, 100% sequential passengers, $50 ancillary price, $50 ancillary disutilities). . . . . 193 7.9 Network A2TWO baseline statistics (medium demand, 100% simultaneous
passengers, $50 ancillary price, equally appealing ancillary disutility scenario).198 7.10 Network A2TWO Airline 1 baseline bookings and ancillary purchase data
by fare class (medium demand, 100% simultaneous passengers, $50 ancillary price, $50 ancillary disutility). . . . 199 7.11 Network A2TWO Airline 1 simulation results for baseline and symmetric
experimental cases (medium deniand, 100% simultaneous passengers, $50 ancillary price, $50 ancillary disutilities). . . . 200 7.12 Network A2TWO Airline 2 simulation results for baseline and symmetric
experimental cases (medium demand, 100% simultaneous passengers, $50 ancillary price, $50 ancillary disutilities). . . . 201 7.13 Network A2TWO Airline 1 simulation results for baseline and asymmetric
experimental cases (medium demand, 100% simultaneous passengers, $50 ancillary price, $50 ancillary disutilities). . . . 204 7.14 Network A2TWO Airline 2 simulation results for baseline and asymmetric
experimental cases (medium demand, 100% simultaneous passengers, $50 ancillary price, $50 ancillary disutilities). . . . 205 7.1.5 Network A2TWO Airline 1 simulation results for baseline and symmetric
AMD and AMR cases with various choice probability estimation methods (medium demand, 100% simultaneous passengers, $50 ancillary price, $50 ancillary disutilities). . . . . 213 7.16 Network A2TWO Airline 2 simulation results for baseline and symmetric
AMD and AMR cases with various choice probability estimation methods (medium demand, 100% simultaneous passengers, $50 ancillary price, $50 ancillary disutilities). . . . 214 7.17 Network D6 Airline 1 simulation results for baseline and symmetric
expe-rimental cases (100% simultaneous passengers, ancillary price = 40% FC 6 fare, equally appealing disutility scenario). . . . 223
7.18 Network D6 Airline 2 simulation results for baseline and symmetric expe-rimental cases (100% simultaneous passengers, ancillary price = 40% FC 6 fare, equally appealing disutility scenario). . . . . 224 7.19 Network D6 distribution across network of symmetric AMD and AMR
in-creases in ticket revenue, dein-creases in bookings, and dein-creases in ancillary revenue vs baseline (100% simultaneous passengers, ancillary price = 40% FC 6 fare, equally appealing disutility scenario). . . . . 224
7.20 Network D6 Airline 1 simulation results for baseline and asymmetric expe-rimental cases (100% simultaneous passengers, ancillary price = 40% FC 6 fare, equally appealing disutility scenario). . . . . 230
7.21 Network D6 Airline 2 simulation results for baseline and asymmetric expe-rimental cases (100% simultaneous passengers, ancillary price = 40% FC 6 fare, equally appealing disutility scenario). . . . . 231
A.1 Ancillary fee structure in airline dataset and in PODS . . . . 251
A.2 Fare class restriction structure in airline dataset and in PODS. . . . . 252
C. 1 Network AlONE simulation results paired by sample or by trial for baseline and experimental cases with 50 trials and 50 unburned samples per trial (medium demand, 100% simultaneous passengers, $50 ancillary price, equally appealing disutility scenario). . . . . 271
C.2 Network D6 simulation results paired by sample or by trial for baseline and symmetric experimental cases with 50 trials and 50 unburned samples per trial (100% simultaneous passengers, ancillary price = 40% FC 6 fare, equally appealing disutility scenario). . . . . 272
Chapter 1
Introduction
Since the advent of discounted leisure fares in the 1970s, airlines have invested in revenue management systems to maximize the proceeds from ticket sales. In the mid-2000s, however, airlines began developing a secondary, ancillary, revenue stream by both unbundling their fares and offering new products, services, and amenities for sale. Because these ancillary services have been traditionally less important to overall profitability, or not offered at all, airlines do not have a good understanding of how passenger decisions to purchase ancillary services are related to decisions about itineraries and fare classes. As the number and price of ancillary services grow, the availability and price of ancillary services may alter the way in which passengers select itineraries and fare classes. In addition, airlines have little understanding of how to account for this new and growing revenue stream within revenue management systems to maximize total revenue, not just ticket revenue. This thesis explores both topics.
This chapter is organized as follows. Section 1.1 provides the motivation and context for the research, describing the development of ancillary services and their associated revenues, and describing the airline systems involved in selling tickets and ancillary services. Section 1.2 describes the research objectives and contributions of this thesis. Section 1.3 outlines
Table 1.1: Ancillary service categorization
Itinerary Trip Relationship
Baggage Hotels Loyalty
Seating Rental cars Co-branded credit card
Meals Destination activities Subscription clubs
Priority boarding Lounge access
the remaining chapters of the thesis.
1.1
Motivation and Context
Passenger airlines sell more than just basic transportation of passengers. In the broadest sense, all revenue from sources other than passenger tickets can be considered ancillary revenue: revenue from performing maintenance for other carriers; revenue from transporting mail, cargo, and freight; and non-ticket revenue from passengers, for example. This thesis focuses on non-ticket revenue from passengers, or revenue from selling passenger-related ancillary services.
Passenger-related ancillary services are optional services sold by airlines that are related, in some way, to passenger transportation. These services can be roughly divided into three groups: services related to a specific itinerary, services related to a particular trip, and services related to a passenger's relationship with the airline. Table 1.1 summarizes this categorization.
Itinerary-related services are directly related to a specific itinerary and are fulfilled as part of transporting the passenger. Examples include checked and carry-on baggage, seating upgrades and assignments, inflight meals and entertainment, priority boarding, and lounge access. Upgrade revenues for Delta's additional legroom Comfort+ seating section provided
22
$125 million in 4Q 2015, and the airline expected these revenues to grow.1
Spirit Airlines earns more than $110 million, or 5% of total operating revenue, from seat assignment fees.2
Checked and carry-on baggage fees provided nearly $1.5 billion for American Airlines in 2016, representing 2.8% of total operating revenue.3
Trip-related services are related to a specific trip, but are not fulfilled as part of transporting the passenger. Examples include hotel rooms, rental cars, and destination activities, which provided 3% of Allegiant Airline's total operating revenue in 2016.1
Relationship-related services are not linked to a specific trip or itinerary, but occur as part of a passenger's relationship with the airline. Examples include loyalty programs, co-branded credit cards, and subscription discount clubs. United Airlines reported more than $3 billion in revenue from frequent flyer mile sales (primarily related to a Chase Bank co-branded credit card)."
1.1.1 Ancillary Revenue Reporting and Data Sources
The revenue impact of ancillary services is difficult to quantify given limited data and reporting. Airlines in the United States are required to report financial information on Form 41 to the US Department of Transportation (DOT), which releases the data to the public. The US DOT typically defines ancillary revenue as three line items within Form 41, Schedule P-1.2: Reservation Cancellation Fees, Miscellaneous Operating Revenues, and Property
-Passenger Baggage Fees. These categorizations, however, provide only a limited view of ancillary services: they contain several revenue streams that are not typically considered as ancillary products (like reservation cancellation fees and compensation for collecting airport Passenger Facility Charges). They also exclude several important ancillary revenue
'Delta Air Lines Earnings Call (4Q 2015)
2
Spirit Airlines Form 10-K (2016)
3
US DOT Form 41, Schedule P-1.2 4
Allegiant Airlines Form 10-K (2016) 5
streams, like onboard food/drink sales (categorized as Transport Related Revenue, which also includes codeshare ticket revenue and contracted maintenance service revenue), loyalty program income. (categorized as ticket revenue) and seat assignment fees (categorized as ticket revenue). Outside of the United States, there are no comparable and consistent governmental financial reporting requirements.
Financial statements for publicly-traded airlines (such as 10-K and 20-F Securities and Exchange Commission (SEC) filings in the United States and equivalent filings in other countries) provide some additional data on ancillary services. However, each carrier has its own reporting methodologies and no two carriers use the same revenue categories. Low cost and ultra-low cost carriers (LCCs and ULCCs) that specifically target ancillary reve-nue tend to provide more detail about the revereve-nue impacts of their ancillary services. For example, Allegiant reports three different categories of scheduled service revenue in its 10-K filings: ticket revenue, "ancillary air-related revenue," and "ancillary third-party revenue" (charter operations are reported separately as well). Delta reports four different categories of passenger revenue: mainline and regional ticket revenue; "loyalty programs;" administra-tive fees, club, and on-board sales;" and baggage fees in its 10-K filings-a very different system than used by Allegiant. Other carriers have other schemes, and an individual carrier may change reporting practices over time, making comparisons between carriers and years challenging.
In general, the only comprehensive global ancillary revenue reports are estimated and compi-led by third-party consulting firms like IdeaWorks, by assessing 10-K and equivalent filings, Form 41 data, press releases, and executive interviews to assemble estimates. IdeaWorks therefore has a more holistic view of ancillary revenue than Form 41, but because of the variety of data sources, is potentially also more variable. In addition, IdeaWorks specifically attempts to include the impact of loyalty programs (e.g. sale of frequent flyer miles/points to banks issuing co-branded credit cards); such revenues are not otherwise considered in this thesis.
24
1.1.2
Ancillary Service History and Trends
IdeaWorks estimates that the major US carriers collected more than $18 billion in passenger-related ancillary revenue in 2015 (about 11% of total revenue), and that airlines around the world collected $59 billion in ancillary revenue in the same year,6 far greater than the global airline profit of $33 billion.7 Although ancillary revenue is clearly important to airlines today, it is a relatively new revenue stream that airlines have put substantial effort into developing over the last ten years. Airlines have increased ancillary revenues both by developing new products and by "unbundling," the practice of charging separately for products or services that were traditionally included as part of a plane ticket. Unbundling initiatives have typically been led by LCCs and ULCCs whose business models rely heavily on revenue from ancillary fees.
Although no longer operational, People Express introduced checked baggage fees and paid onboard meals for trans-Atlantic flights in the 1980s (Conrady, 2013). More recently, Ry-anair in Europe and Allegiant Airlines and Spirit Airlines in the United States have trans-formed into LCCs and ULCCs, with substantial increases in ancillary revenue (as shown in Figure 1.1). Ryanair began the transition to low fares and no frills in the early 1990s, and then began to grow ancillary revenues. By 1997, Ryanair obtained 5% of its revenue from inflight sales, primarily from duty-free items.8 Until the early 2000s, ancillary services (in the form of inflight sales, destination car rentals, and other non-flight ancillary services) provided about 9% of Ryanair's operating revenue.' Ancillary revenue grew through fiscal year 2016 to 24% as the airline implemented fees for checked baggage, airport check-in, flight notifications, seat assignments, and extra legroom seats.10
6
IdeaWorks. (November 9, 2015). Airline ancillary revenue projected to be $59.2 billion worldwide in 2015
[Press release]. Retrieved from http: //www.ideaworkscompany.com/wp- content/uploads/2015/11/Press-Release- 103-Global-Estimate.pdf
7IATA
Economic Performance of the Airline Industry End-Year Report (2015)
8
Ryanair Initial Public Offering Prospectus (1997)
9Ryanair Initial Public Offering Prospectus (1997); Ryanair Annual Report (1999-2001)
-4-Ryanair Allegiant Spirit 50% 45% 40% 35% 30% 25% 20% 15% 10% 5%1 0%
Figure 1.1: Portion of revenue from ancillary services for Ryanair, Allegiant, and Spirit.
Source: Ryanair Annual Report (1999-2001), Ryanair Form 20-F (2001-2016), Allegiant Airlines Initial Public Offering Prospectus (2006), Allegiant Airlines Form 10-K (2006-2016), Spirit Airlines Initial Public Offering Prospectus (2012), Spirit Airlines Form 10-K (2010-2016).
Allegiant started its transformation to a ULCC, and began a concerted effort to increase ancillary revenue, when it emerged from bankruptcy in 2002. In 2003, only 2% of total operating revenue was derived from ancillary services." In 2006, the airline implemented fees for checked baggage and for bookings made through the airline's website (as opposed to bookings made at the airport) and ancillary revenue rose to 12% of total operating revenue. The airline implemented fees for carry-on baggage in 2012; by 2016, 40% of Allegiant's revenue came from ancillary services, as shown in Table 1.2.
Spirit Airlines began its transition to a ULCC in 2006. It implemented seat selection fees in 2008, an online booking fee in 2009, and a call center booking fee in 2010. In 2010, Spirit was one of the first airlines to charge customers for carry-on baggage.12
These and other charges increased Spirit's ancillary revenue from 14% of total operating revenue in 2008 to
46% in 2016.13
"Allegiant Airlines Initial Public Offering Prospectus (2006)
1 2
Spirit Airlines Initial Public Offering Prospectus (2012) 1 3
Spirit Airlines Initial Public Offering Prospectus (2012); Spirit Airlines Form 10-K (2011-2016) 26
Table 1.2: History of ancillary revenue at Allegiant Airlines
Portion of total revenue
Year New ancillary services from ancillary services
2002 None 0%
2005 Seat assignment fees 8%
2006 Checked baggage fee, online booking fee 12%
2012 Carry-on baggage fee 30%
2016 Refinement of existing fees 40%
Source: Allegiant Airlines Initial Public Offering Prospectus (2006), Allegiant Airlines Form 10-K (2006-2016).
Legacy network carriers have also adopted the ancillary fee model. Most US network carriers implemented fees for checked bags in 2008 and 2009. By 2010, all US legacy carriers had discontinued free domestic economy meal service, in favor of onboard food sales. Lufthansa began charging for seat assignments on short-haul flights in 2013, and later expanded the fees to its long-haul network. In 2017, United Airlines and American Airlines launched basic economy tickets, which provide seating in the standard economy cabin but prohibit carry-on bags (passengers must pay to check all baggage).14 Basic economy fares have since spread to other North American and European airlines.
In addition to unbundling, airlines have been developing new services and products. Luft-hansa launched the first Wi-Fi equipped flights in 2004, and Wi-Fi is now sold on many flights worldwide. In 2010, Air New Zealand launched "SkyCouches," which are sets of three economy class seats that convert into a bed for two passengers. In 2015, American Airlines led US carriers in launching a premium economy cabin, which provides more legroom, wider seats, and improved service (non-US carriers had previously offered premium economy). Although many large airlines utilize ancillary fees, not all have completely unbundled their product offerings. Some airlines have pursued a hybrid approach to bundling: offering a mix of bundled and unbundled fares. For example, Delta Air Lines provides complimentary up-grades to "preferred" seats to the highest value economy fare classes, while selling such seats
4
Delta introduced Basic Economy tickets in 2016, but includes complimentary carry-on bags. In 2018, American Airlines dropped its basic economy carry-on prohibition.
-4-American - Delta -- United $1.6 $1.4 ' $1.2 - 10
$1.
$0.8 S$0.6 bb $0.4 $0.2 $0.0 t - 00 M~ C:) C9 M~ C l Cl l l Cl Cl Cl CD CD CD CDFigure 1.2: Baggage revenue for US network airlines
Source: US DOT Form 41, Schedule P-1.2.
to passengers in lower value fare classes. Other airlines, such as Qantas and Air Canada, offer "branded" fares or bundles whose various restrictions and ancillary fee structures are clearly marketed; the goal is to make clear to consumers the benefit of selling-up from the lowest offered fare (Vinod and Moore, 2009). For more details on the evolution of ancillary fees, see Garrow et al. (2012).
According to the US DOT definition of ancillary revenue, the impact of unbundling has been a substantial increase in ancillary revenue. As shown in Figure 1.2, baggage-related fees. for major US network carriers (including first and second checked bags, overweight bags, oversize bags, and excess bags) increased by a factor of five between 2007 and 2010 as these airlines unbundled fares. Baggage fees now account for nearly $1.5 billion per year for American Airlines, and are equal to 3%-4% of ticket revenue for major US network airlines. Ancillary revenue as a whole, as reported to the US DOT, has grown in the last decade from 2% to 8% of total revenue, or from $2.2 billion to $15.0 billion per year, as shown in Figure 1.3. As discussed above, these figures likely underestimate total ancillary revenue production.
M Baggage fees 0 Reservation canacellation fees 1 Miscellaneous operating revenue $16 $14 -$12 $10 $8 $6 $4 $0 2005 2006 2007 2008 2009 2010 2011 2012 2013 2014 2015 2016
Figure 1.3: Total ancillary revenue for US airlines, as reported to US DOT.
Source: US DOT Form 41, Schedule P-1.2.
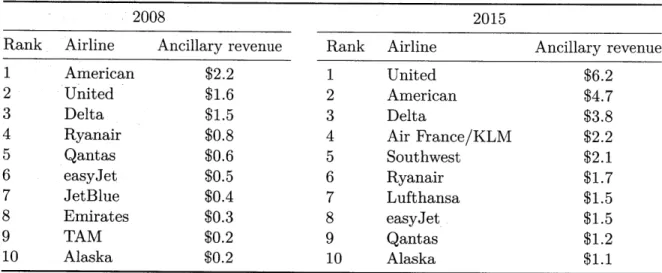
IdeaWorks ancillary revenue estimates also include the significant financial impact of loyalty programs, which are not otherwise considered in this thesis. Estimated total passenger-related ancillary revenue for United Airlines in 2015, for example, was $6.2 billion, of which $3.0 billion is attributed to the MileagePlus loyalty program (primarily through revenue from a co-branded credit card). Sales of frequent flyer miles are estimated to provide 47% of American's 2015 IdeaWorks ancillary revenue, and 64% of Delta's.1 5 IdeaWorks estimates
that ancillary revenues grew dramatically between 2008 and 2015, as shown in Table 1.3. For carriers that were in the top ten in ancillary revenue production in both 2008 and 2015, estimated ancillary revenues grew between 90% and 350%.
Although ancillary revenues have increased, empirical studies of add-on pricing suggest the increases have led to decreases to base (flight) prices. Ancarani et al. (2009) use transaction data for airlines, hotels, online retailers, and restaurants to demonstrate that increases in add-on prices typically lead to decreases in base prices. Scotti and Dresner (2015) focus on the airline industry and evaluate average fares, passenger traffic, and ancillary fees between
Table 1.3: IdeaWorks estimates of ten largest airlines by ancillary revenue (in billions).
2008 2015
Rank Airline Ancillary revenue Rank
1 American $2.2 1 2 United $1.6 2 3 Delta $1.5 3 4 Ryanair $0.8 4 5 Qantas $0.6 5 6 easyJet $0.5 6 7 JetBlue $0.4 7 1 8 Emirates $0.3 8 e 9 TAM $0.2 9 10 Alaska $0.2 10
Source: IdeaWorks Top 10 Ancillary Revenue Rankings (2015).
Airline Jnited American )elta Air France/KLM Southwest Ryanair Lufthansa asyJet.
Qantas
Alaska Ancillary revenue $6.2 $4.7 $3.8 $2.2 $2.1 $1.7 $1.5 $1.5 $1.2 $1.12007 and 2010. They find that increasing checked baggage prices results in lower average base fares and passenger counts. Brueckner et al. (2015) also show a reduction in average base fares when airlines implement baggage fees. Zou et al. (2017) find that, when a la carte airlines compete against airlines that bundle checked baggage, there is a correlation between the baggage price for the a la carte carriers and average fares for the bundled carrier. Because ancillary services were previously not offered, or were only a minor component of an airline's revenue and a passenger's cost to travel, they have not been extensively analyzed. This thesis will examine the impact of ancillary services on passengers and on airline revenue management systems.
1.1.3 Overview of the Airline Industry
Airlines offer networks of flights (which consist of one take-off and one landing) that serve a variety of origin-destination (OD) markets (pairs of cities or airports where passengers begin or end an air travel journey) and passenger types (i.e. business, leisure, etc.). Each market has its own demand characteristics, and each passenger has their own budget, schedule,
and quality preferences. Airlines leverage passenger heterogeneity to increase profits by price and product discrimination: on each flight, airlines may offer several distinct cabins of service (e.g. first class, business class, and economy class). Within each market and each cabin of service, airlines offer a variety of different fare classes, or price points with purchase and use restrictions. Typically, the most expensive fare class has no restrictions, while the least expensive fare class is highly restricted. These restrictions may include a round trip purchase requirement, a minimum and/or maximum stay requirement, a Saturday night stay requirement, or a cancellation penalty. For example, when Delta was the only non-stop carrier between Boston and Detroit, it offered the restricted fare structure shown in Table 1.4. Passengers wanting to purchase the lowest-value class V had to purchase round trip tickets three weeks in advance with a Saturday night at their destination, and pay a penalty to make changes or cancel the reservation. Airlines impose these restrictions on discount fares in an attempt segment demand: restrictions force restriction-averse (but typically high budget) business travelers to purchase more expensive, less-restricted tickets while still allowing restriction-tolerant (and typically low budget) leisure travelers to purchase less expensive discount tickets.
Not all airlines impose such extensive restrictions on their low-value fare classes, and airlines tend to offer similar fare structures as their non-stop competitors. In 2014, Delta modified its Boston-Detroit fare structure as JetBlue introduced new non-stop service. Delta eliminated the Saturday night stay requirement and dramatically lowered its lowest-value fares-to $69 in V class and $99 in X class from $205 and $215, respectively (Belobaba, 2015).
In an airline network, each physical seat on each flight is a perishable asset that can be sold to passengers flying in different markets and paying different fares. Typically, airlines establish schedules and the fares discussed above far in advance of operating a flight; see Belobaba et al. (2009) for an overview of the airline planning process. During the booking window, when travelers are shopping, the airline's revenue management (RM) system determines which fare classes to sell in each market at any given time. The optimization model inside
Table 1.4: Restricted Boston-Detroit fare structure for Delta Air Lines in September 2013.
Fare One way Advance Change Round trip Minimum
class fare purchase Refundable fee required stay
Y $936 None Yes None No None
B $794 None No $200 No None
M $603 None No $200 No None
H $501 14 days No $200 No None
K $365 None No $200 Yes Sat Night
T $249 7 days No $200 Yes Sat Night
X $215 14 days No $200 Yes Sat Night
V $205 21 days No $200 Yes Sat Night
Source: Belobaba (2015).
the RM system attempts to offer the revenue-maximizing fares, considering both the supply of seats on each flight leg and the demand within each OD market. The demand forecast is generated based on historical booking data. More details about RM and forecasting methods can be found in Chapter 4.
The booking window for a future flight departure begins up to 330 days before departure. Conceptually, consumers purchase travel via a travel retailer, which could be an airline website or call center, an online travel agent or meta-search (such as Expedia or Google Flights), or other service. Retailers provided by the airline are direct booking channels; those provided by others are indirect booking channels. A consumer provides the retailer with a booking request, which consists of an origin, destination, departure dates, and desired class of service. Direct booking channels send the booking request directly to the airline's reservations inventory system, which returns a set of available options for the passenger. As illustrated in Figure 1.4, indirect booking channels typically send the booking request to a Global Distribution System (GDS), which combines information from three sources to return a set of options for the passenger: schedules, from a third-party data source (typically OAG, or Official Airline Guide); availability, from the marketing airline for each flight; and fares, from another third-party data source (typically ATPCO, or Airline Tariff Publishing Company). The retailer presents the set of options (from either the GDS or the airline)
Availability
Fares/Ancillary Prices
--- Batch--r-ce B $136 NONREF p
M $''9 6 N0N R EF 7AP
Q $6 6 NNRE F 14AP t
ari e s e ss cheda les
to-th Batch process (via third party)
Figure 1.4: Airline distribution system schematic. a travel retailer, who then passes the request to a airline supplies schedules and fares/prices to OAG to the airline is for fare class availability.
I
Travel Retailer$96 7:15 AM - 9:57 AM
one way Delta
$103 jetBue 6:02 AM - 8:54 AM
one way JetBlue
$104 8:00 AM - 2:26 PM
one way American Republic Air..
-- Real time process
Consumers request travel options from Global Distribution System. While the and ATPCO, the only real time request
to the consumer, who then books one option, makes a new request, or leaves the system. If the consumer books, the retailer notifies the GDS or airline, which issues a ticket and a reservation.
Approximately 50% of bookings worldwide are made through a GDS, and therefore the structure of GDSs has a significant impact on how airlines sell travel (Taubmann, 2016). As GDSs were originally designed to sell tickets, they are anchored around fare classes-availability is controlled at the fare class level, fares are filed at the fare class level, and booking options are specific itinerary and fare class combinations. GDSs have limited ca-pability to offer and sell ancillary services. For example, according to IdeaWorks, American Airlines sells paid seat assignments, but not checked baggage, though Sabre GDS. Delta Air Lines sells bundled fares and paid seat assignments through Amadeus GDS, only bundled fares through Sabre GDS, and only paid seat assignments through Travelport GDS.16 1 6
The industry is in the process of replacing this workflow with New Distribution Capability (NDC), which features several important changes. When NDC is fully implemented, GDSs will no longer need to aggregate schedules, availability, and fares to assemble sets of booking options-the GDS could request offers from airline offer management systems. These offers would no longer necessarily be centered on a fare class-each offer could consist of an itinerary, a set of zero or more ancillary services, various purchase/use restrictions, and a single price.
The shift from a traditional distribution environment to NDC has significant implications for airlines. Because NDC improve travel retailers' abilities to sell ancillary services, airlines expect ancillary revenues to rise with the implementation of NDC. In addition, because NDC could move away from fare class-centered availability control, airlines will be able to develop offer management systems. NDC also allows more detailed and personalized booking requests (including information such as frequent flyer number and marital status in the initial booking request), and allows airlines to respond with individualized sets of offers. At the limit, with NDC, each offer could be dynamically and personally constructed and priced for each consumer.
1.2
Research Objectives and Contributions
This thesis address two primary research questions surrounding airline ancillary services. First, it examines how the presence and/or price of ancillary services might affect the way passengers make choices about air travel. Second, it investigates mechanisms for airlines to effectively incorporate information about ancillary revenues into their revenue management systems, to maximize the total combination of ticket and ancillary revenue.
These questions reflect two significant gaps in the literature. Knowledge about the choice process(es) airline consumers use to select an itinerary and fare class in conjunction with ancillary services is lacking. Although authors have studied passenger selection of airline,