FLIGHT TRANSPORTATION LABORATORY
REPORT R95-6
AIRLINE OVERBOOKING PERFORMANCE
MEASUREMENT
CARSTEN HOLM
AIRLINE OVERBOOKING PERFORMANCE MEASUREMENT by
CARSTEN HOLM
Submitted to the Department of Aeronautics and Astronautics on May 5, 1995 in partial fulfillment of the requirements for the Degree of
Diplom Ingenieur in Luft- und Raumfahrttechnik ABSTRACT
Since the "product" of an airline cannot be stored, the value of every seat which is left empty upon departure is lost forever or "spoiled". In order to compensate for the economic effects of passengers holding a confirmed reservation who fail to show-up, airlines overbook, i.e. accept more reservations than physical seats are available under the assumption that sufficient no-shows will occur. Even though airlines have overbooked their flights intentionally for decades, very few efforts have been made to measure the economic success of overbooking. As revenue maximization becomes more critical to the profitability of an airline, it is even more important to review the balanced tradeoff between denied boardings and spoilage.
This thesis outlines the major philosophies of the currently applied overbooking models and illustrates further the common overbooking performance measurement approaches. As all of these models demonstrate significant shortcomings, a new model, the Revenue Achievement Model, is introduced. This new approach is based on a purely economics driven philosophy. Along with the Revenue Achievement Model, the different definitions of spoilage, oversales and other key values for the overbooking performance evaluation are reviewed and defined anew in an attempt to
standardize the terminology.
It is shown that the Revenue Achievement Model is more consistent with today's overbooking models than other overbooking performance measurement models. It matches the economic objectives of the airlines and shows superior qualities in comparing flights on a single flight level as well as evaluating the aggregate performance for large samples. The proposed methodology enables also to obtain a target performance index which allows a quantification of the objectives of overbooking. Finally, the impact of system overrides by revenue management analysts is analyzed and methods are suggested to evaluate their actions.
Thesis Supervisor: Professor Peter P. Belobaba
Acknowledgments
I am very grateful for the opportunity to have studied in the Flight Transportation Laboratory at MIT. This was made possible by Professor Belobaba who consented to be my thesis advisor -giving me the invaluable opportunity to work with him. I sincerely appreciated his professional assistance, guidance and advice throughout my stay in the "Lab". I would also like to thank both Professors Simpson and Belobaba for their continuos support as well as the knowledge they imparted on me through their interesting and enjoyable lectures.
Further, I wish to express my thanks to the Technical University Berlin for the financial support during the first four months of my stay.
What I will miss most about my stay in the lab are the people I have met during the last couple of months. Apart from discussing the airline "stuff", I spent a substantial amount of time talking about life, careers, and politics. The lunch-outings and movie events were particularly enjoyable. Special thanks to Eric Achtmann, Edmond Chen, Michael Clarke, Andras Farkas, Tom Svrcek, Gary Waldman, Robert Wickham, and Gary Wong for making my stay at MIT even more fun filled.
Finally, I wish to acknowledge my parents, my girlfriend and the rest of folks on the other side of the Atlantic who supported my desire to complete my studies in the USA.
Table of Contents
A bstract ...- ...---- 1
Acknowledgm ents... 3
List of Figures...-- 7
List of Tables ...---- 9
Abbreviations and Notation... 11
Chapter 1 Introduction to Overbooking and Revenue Management ... 13
1.1 Historic Developm ent... 15
1.2 Overbooking M odels and Policies... 16
1.3 Overbooking Perform ance -W hat is it ? ... 24
Chapter 2 Overbooking Performance Measurement Literature Review ... 29
2.1 Non-M onetary Perform ance M easures... 30
2.2 M onetary Perform ance M easures ... 33
2.2.1 Relationship of Oversale to Spoilage Costs ... 34
2.2.2 Revenue Opportunity Approach (ROA) ... 39
Chapter 3 Prelim inary Considerations, Definitions and Notation ... 45
3.1 Objectives... 45
3.2 Definitions and Notation ... 46
Cabin Capacity / Seat Availability ... 46
Passengers ... 47
Spoilage (SPL)... 50
C osts and R evenues... 55
Bookings and Authorization Level ... 55
Show-Up Rate, Booking Rate and Show-Up Factor ... 56
3.3 R elevant Flights... 56
3 .4 S u m m ary ... 60
Chapter 4 Revenue Achievement Model (RAM) -Single Flight Level ... 61
4.1 Overbooking Performance Evaluation of Recommended Authorization Levels ... 61
4.2 Performance Evaluation of Revenue Management Analyst Interventions ... 71
4 .3 S u m m ary ... 7 7 Chapter 5 Model Testing and Comparison -Single Flight Level...79
5.1 Performance Comparability of Flights... 80
5.2 Impact of the Performance Measure on Authorization Level ... 86
5 .3 Su m m ary ... 9 2 Chapter 6 Revenue Achievement Model (RAM) -Aggregate Flight Level ... 93
6.1 Overbooking Performance Evaluation of Recommended Authorization Levels ... 93
6.2 Performance Evaluation of Revenue Management Analyst Interventions ... 104
6 .3 Sum m ary ... 10 6 Chapter 7 Conclusions and Recommendations ... ... 107
R eferen ces ... 1 13 B ib lio grap h y ... 1 15
List of Figures
1.1 Minimum Expected Total Costs... 17
1.2 Probability Limitation of Oversales... 18
1.3 "Perfect Hit" - Overbooking Policy...21
1.4 Marginal Expected Costs of Denied Boarding/Spoilage ... 22
2.1 Costs of Spoilage/Oversale Relation -"United Airlines Approach"... 37
2.2 Revenue Opportunity Approach ... 41
3.1 Definitions of Denied Boardings... 49
3.2 D efinitions of Spoilage... 51
3.3 Overbooking Data as Reported (Non-Corrected)... 53
3.4 Corrected Overbooking Data... 54
3.5 R elevant F lights... 58
4.1 Impact of Overbooking on Total Revenues ... 62
4.2 Revenue Achievement with and without Overbooking ... 63
4.3 Overall Revenue Achievement versus Relative Revenue Achievement ... 65
4.4 Total Revenue Opportunity and Revenue Opportunity for Overbooking ... 67
4.5 Revenue Achievement Model (RAM) ... 69
4.6 Percentage Change of Authorization Level by Revenue Management Analysts ... 72
4.7 Absolute Revenue Contribution due to Revenue Management Analyst Interventions ... 73
5.1 Comparability between Flights -RAM vs. ROA... 80
5.3 "Ideal" Authorization Level -Non-Integer ... 89
5.4 "Ideal" Authorization Level -Integer... 91
6.1 Average Expected Costs of Overbooking ... 98
List of Tables
1.1 Denied Boardings per x Passengers Ratios ... 25
2.1 Revenue Opportunity Approach -Sensitivity Example... 43
3.1 Definition of Spoilage and Denied Boarding -Example... 52
3.2 Relevant and Irrelevant Flights... 59
5.1 Comparability between Flights -RAM vs. ROA... 84
6.1 Aggregate Target Performance Index Sensitivity... 99
Abbreviations and Notation
AU Authorization Level
AUM Manual Authorization Level
AUR Recommended Authorization Level
AVL Availability
BKD Bookings
bkr Booking Rate
CAB Civil Aeronautics Board
CAP Cabin Capacity
CRS Computer Reservation Systems
DART United Airlines' Space Planning Model
DB$ Costs of Denied Boarding
DINAMO American Airlines' Revenue Management Model
DOT US Department of Transportation
ENABLS Delta Air Lines' Revenue Management Model
PAX Passenger
PAXC Confirmed Passenger
PAXs Standby Passenger
P'RAM RAM Performance Index
PIROA ROA Performance Index
RAM Revenue Achievement Model
ROA Revenue Opportunity Approach
SPL$ Costs of Spoilage
STD Standby's
SU Show-Ups
suf Show-Up Factor
sur Show-Up Rate
TDBI True Denied Boarding/ist
TDB2 True Denied Boarding/2nd
TSPi True Spoilage/lst
TSP2 True Spoilage/2nd
VDB Visible Denied Boarding
Chapter 1
Introduction to Overbooking and Revenue Management
The "product" of an airline, the transport from A to B at a specified time in the future, is a very perishable service which cannot be stored. Once the aircraft leaves the gate, the revenues which could have been generated by every empty seat are lost. The limited number of seats which are marketed by the airline represent therefore a fixed product "inventory". Since the costs to carry an additional passenger in a seat which would have otherwise been empty are relatively small (an additional meal, airport handling fees if applicable and a negligible amount of fuel), all additional revenues above these incremental costs contribute towards the total profit generated by this particular flight. It is therefore of critical importance to control the number of seats to be sold at a specific price. Revenue management systems determine, based on historic data and demand forecasts, the number of seats to be offered at a certain fare in order to maximize the generated net revenues.
However, even if a flight is sold out in the classical interpretation, i.e. the number of bookings reached the cabin capacity, it is almost certain that this flight will depart with several vacant seats. This is caused by passengers canceling their reservation at short notice prior to departure (not allowing the airline enough time to sell the seat again) or by passengers failing to show-up for the flight at all. Given that these seats could have been sold to other passengers, the spoilage of seats represents a lost opportunity for the airline to generate revenues. In order to compensate for these effects, airlines take reservations in excess of the cabin capacity, i.e. overbook the flights, the assumption being that enough no-shows will occur so that seats will be available for every passenger showing up. The corresponding problem is obvious. Due to the large variance of the number of no-shows, it can happen that more passengers show up than seats are provided, so that passengers with confirmed reservations are denied boarding. A denied boarding may be voluntary, when the passenger consents not to board for some type of compensation. Otherwise the denied boarding is involuntary, when the airline refuses to accommodate the passenger on the flight. It is
evident that sophisticated mathematical models have to be applied in order to minimize the negative effects of overbooking in general and to avoid involuntary denied boardings as much as possible. Together with other inventory control optimizations, mature overbooking approaches have become an integral part of airline revenue management. According to P. Belobaba [1], revenue management consists of two major parts -pricing and seat inventory control. The process of airline overbooking and the determination of an optimal authorization level, i.e. the optimum number of reservations to be accepted, is therefore an essential precondition for the effective control of how many seats are available at any given time and location for a certain fare.
Although deep-discounted non refundable fares were introduced over the last decades, the percentage of no-shows increased steadily [2] and passengers seemed to be even more encouraged to no-show a flight. The airline industry claims therefore that it is essential for their operations to
accept more reservations than seats are available in order to compensate for last minute cancellations and passengers who fail to show up. Without the balancing factor of overbooking, many flights would more frequently depart with empty seats for which there was a demand. American Airlines [3] claims that this would result in lower average load factors and the need to charge the public significant higher fares. They further estimate that 15% of seats on sold-out flights would be spoiled if no overbooking is applied. By using overbooking models, this has been reduced at American Airlines to 7% in 1980 and only 3% of seats were spoiled in 1990 because of the implementation of a new overbooking model [4]. American Airlines approximated that in 1990, if it was able to implement overbooking perfectly compared to no overbooking control, the additional revenues would have been $250 million. In reality, they estimated that 90% of this revenue opportunity or, $225 million has been realized due to sophisticated overbooking [4]. It is evident that this amount of additional revenue potential is a crucial factor which can help to improve the profitability of the airline industry.
Therefore, most major airlines, which have the required computer reservation system facilities, put a lot of emphasis not only on overbooking but on revenue management in general. The availability of seat inventories is carefully controlled by automated algorithms as well as by analysts. The authorized overbooking level limits the total number of acceptable bookings at any time. This authorization, which is supposed to be set so that the objectives of the airline are met, is either determined by an appropriate model (as presented later on) or set by a revenue management analyst. While the analysts decides by his personnel judgment and his experience, the overbooking model is based on mathematical models that use historical data. The fundamental input requirement for most overbooking models is a distribution which describes the show-up rate, its mean and variance.
As mentioned before, the total number of bookings is limited by the authorized overbooking level at any time. Due to the dynamic nature of the booking process, a continuous control and review of the authorization level is necessary. Compensation actions are taken to adjust for unforeseen changes of the passenger "behavior", e.g. exceptional high or low cancellation. This fine-tuning becomes even more important closer to departure. The following abstracts covers briefly the historic development of the overbooking problem and explains the progress of the overbooking models and the adopted policies by the airlines. Since the detailed modeling approaches towards overbooking are not of great importance to assess the overbooking performance, only the main strategies and policies are discussed.
1.1 Historic Development
The phenomena of no-shows and late cancellations are not new. In the 1950's the incentive to abuse the flexibility offered by the airlines was even higher when passengers who made reservations could cancel them or even no-show without economic penalties. In order to compensate for these negative effects, airlines decided to overbook their flights deliberately rather than relying on passenger wait lists. Even if the airlines did not admit to overbooking intentionally, it was common practice throughout the industry [2]. The reservation limits were determined on the basis of the recent cancellation and no-show history as well as the judgment of reservation office supervisors.
In 1961, a CAB report [5] revealed that the leading US carriers were faced with a significant no-show rate of 10% relative to the system wide number of passengers who boarded the flights. The introduction of a penalty scheme by the end of 1961 lead to a reduction of no-shows. This scheme penalized passengers who failed to show up by paying an amount of up to 50% of the ticket value but not more than $40. The penalty was collected if another reservation was made or the tickets were handed in for redemption. Along with the penalty for no-shows the airlines were required to pay exact the same amount of money to reserved passengers denied boarding in the case of oversales, i.e. if more passengers with a confirmed reservation show up than the airline is able to accommodate on the flight. Although this system was at least partially successful, the CAB permitted its expiration after 1963 mainly because the airlines were concerned about their public relations [2]. Later on, the CAB introduced the penalty scheme again with significantly higher penalties for the airlines which were increased even more by the CAB in 1978. The new scheme also required the airlines to ask for volunteers before passengers were involuntarily bumped. Furthermore, the CAB encouraged the airlines to introduce new models which help to find passengers to volunteer for denied boarding.
K. V. Nagarajan [6] proved in a survey, that a considerable number of passengers are happy to volunteer for denied boarding in exchange for a very small amount or even no compensation at all. Thus, the scheme of penalizing the airline for bumping passengers involuntarily, was slowly replaced by the procedure of asking for volunteers who are willing to wait for the next flight in exchange for a relatively small remuneration.
The basic idea of the scheme to penalize and remunerate, even if changed over the years, is still applied for certain fare types by today's airlines. Depending on the restrictions of the purchased ticket, fees have to be paid in order to change a reservation and some tickets cannot be redeemed at all if they are not used for the booked flight. Passengers denied boarding are compensated with travel vouchers, and expenses for hotels, meals etc. might be covered. But many high fare tickets (first, business and even full economy fare) allow changing of reservations on short notice, cancellation of bookings and not showing up for the flight without economic penalty. Thus, the spoilage of seats on flights which were fully booked is still a major issue in the airline industry.
1.2 Overbooking Models and Policies
Meanwhile, different approaches were taken to optimize the overbooking level depending on the objective of the airline. The earliest published optimization model was developed by M. J. Beckmann in 1958. It minimizes the loss due to denied boardings and spoilage under the assumption of a very simplified environment. A more exact formulation of the problem was suggested by L. Kosten in 1960. Applying the same policy of minimizing costs due to oversale penalty and opportunity costs for non-utilized seats, his model considers the interspersion between reservations and cancellations. Furthermore, the maximum number of reservations to be accepted depend on the time left upon departure [7].
Costs of Overbooking
Minimum Expected Total Costs of Overbooking
Expected Total Costs
Authorisation
Opt. Authorisation ,
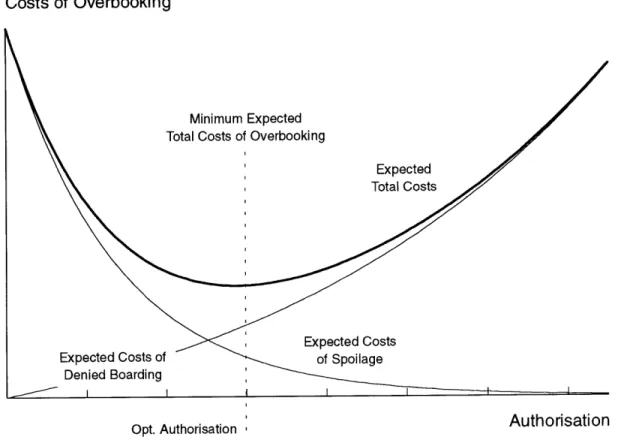
Figure 1.1 Minimum Expected Total Costs
The basic concept of the cost minimization model can be explained by Figure 1.1 which shows the considered cost curves over the cabin capacity. It is evident that every accepted booking in excess of the cabin capacity raises the probability of denied boardings. The more bookings are accepted, the higher is the number of expected denied boardings with an associated increase of the related costs. While the costs of denied boardings increase with an increasing number of bookings, the opposite is evidently true for the costs of spoilage. Thus, the total costs can be obtained by summing the expected costs of oversales and spoilage. The minimum of the summed curve determines the optimal authorization level, i.e. the optimum number of bookings to be accepted.
A different approach was proposed by H. R. Thompson in 1961. Rather than minimizing the inherent costs of overbooking, his model limits the probability of denied boardings. Thus, by ignoring all costs of oversales, a pre-set risk limit of denied boardings (probability of one or more excess passenger) constrains the upper booking limit at any time, as shown in Figure 1.2.
Aircraft Capacity "Perfect Hit"
Authorization Level
On Average Expected Cancellations and No-Shows
Risk of Denied Boarding
70%
80%
90%
100%
110%
120%
Spoilage - Denied Boardings
Figure 1.2 Probability Limitation of Oversales
Assuming that the number of show-ups follow a specified distribution, the probability of exceeding a given number of show-ups can be determined. A standard normal distribution with a mean show up rate g and a standard deviation (-, was used in Figure 1.2 to illustrate this relationship. While the white area under the curve characterizes the likelihood that the number of show-ups do not exceed the cabin capacity, the shaded sector describes the opposite case. The "probability-tail" which represents the chance of having show-ups in excess of the cabin capacity can be interpreted as the risk of denied boardings which is limited by a pre-set policy target.
The same aim of limiting the probability of denied boardings was pursued by C. J. Taylor. His model, published in 1962, is similar to the Thompson approach but treats cancellations, no-shows and passenger groups much more accurately [7]. Furthermore, he considers the proportion of denied boardings per fixed number of booked passengers as an alternative constraint to the risk limitation. A simplified version of the Taylor model was implemented with American Airlines by M. Rothstein and A. W. Stone 1967 [8]. The model suggested by M. Rothstein in his doctoral
Mean Show-Up's
thesis in 1968 [7] finally combines the two policies discussed above. Subject to the constraint of a particular ratio of denied boardings per boarded passenger, his approach maximizes the revenues
gained from the flight.
In 1972, K. Littlewood [9] presented a new model to forecast and control passenger bookings as used by BOAC. His approach to determine the overbooking level is still based on the proposal of M. Rothstein and A. W. Stone, but examines the reservation process in greater detail. Again, the maximum number of bookings to be accepted is constrained by a pre-set probability value of expected denied boardings.
Another interesting contribution towards the problem of airline overbooking policies is the research done by E. Shlifer and Y. Vardi as published in 1975 [10]. Within this report, a model is proposed which was implemented by El Al to develop an appropriate booking policy for an airline. Again the principals of the Taylor approach were used by Shlifer and Vardi to examine the implications of applying three criterion concurrently on different types of flights (single-leg flights carrying a single type of passenger, single-leg flights carrying two different types of passengers and two-leg flights). In each case the most conservative of the following criterion is applied: (1) limiting the probability of denied boardings, (2) constraining the ratio of expected oversales over the expected number of boardings and (3) maximizing the expected net revenues from the flight. Thus, not only the probability of exceeding a pre-set rejection level combined with the objective of maximizing revenues is considered but also the probability of rejection at all. If involuntary denied boardings have to be avoided, in particular the latter issue is an important measure in order to maintain a certain "perceived" service standard. For instance, the number of expected rejections could be limited by the number of expected voluntary denied boardings. Thus, no involuntary denied boardings occur and passengers do not get upset about the service.
In 1979, the model to determine the optimum overbooking level as presented by R. Gerbracht and applied by Continental Airlines [11] was again cost driven. Due to the increase of penalties for denied boardings by order of the CAB, the effect of oversales on generated revenues was becoming much more severe. While it was important to achieve even higher overbooking levels in order to compensate for the constantly increasing number of no-shows, it was "becoming very expensive to go too far in that direction". The proposal therefore only focused on costs occurring due to spoilage and denied boardings. A pre-set value not to be exceeded either for the number of expected denied boardings or the probability of a denied boardings were not considered. This can easily be justified by the enforced high penalty/fare ratio of 2/1. Thus, the statistically expected net revenues were maximized by matching the predicted marginal costs of denied boardings with the predicted
marginal costs of empty seats as function of a particular probability distribution of no-shows (dependent on the O-D market, the season, day of operations etc.). Due to the high costs of a denied boarding it is obvious that the adopted overbooking policies were less aggressive and more in favor of spoilage. In order to avoid incidents of high oversales, more spoilage was accepted.
However, not the definition of the airline objectives (revenue maximization and service level preservation) and the mathematical formulation are problematic but the practical application. Specifically, the required input data for the overbooking model are difficult to provide. In particular the probability distribution of the no-show rate is crucial to maximize the net revenues as stated by J. L. Gascd [12] in 1980. It is therefore not surprising that all of the more elaborate approaches discussed above are mainly focused on a realistic modeling of the booking and cancellation process.
The most recent publications also emphasize the same objective of maximizing the net revenues while maintaining a desired service level. An interesting exception was the model applied by United Airlines until 1986 [13]. Within their philosophy the most desirable objective was, of course, to achieve a "perfect hit" for every flight. In order to pursue the "perfect hit" policy, all methods and objectives were used to minimize the spoiled seats and denied boardings on an equal basis. The overbooking authorization was determined independent from the costs of seats light, (i.e. spoilage) or denied boardings by matching the mean of the number of show-ups with the aircraft capacity. Then, the authorization can be obtained easily by dividing the aircraft capacity by the mean R of the show-up rate (0 < mean show-up rate < 1). This very simplified approach is a special case of the models discussed before and fails to incorporate different costs or desired service standards. The model, however, evaluates denied boardings in the same way as spoiled seats, and the probability of an oversale is equal to the probability of a seat light because of the match of aircraft capacity and mean show-up rate. It represents therefore the optimal solution for the maximum revenue case if the ratio of denied boarding penalty and costs per empty seat is equal to one.
This "special" approach as adopted by United Airlines is visualized in Figure 1.3. Again, the show-up distribution is assumed to be standard normal. The mean of the distribution matches the aircraft capacity exactly by definition. The "risk" of a denied boardings equals the risk of spoilage with a probability value of 0.5. Thus, the expected ratio of spoilage and denied boardings is equal to one.
Aircraft Capacity "Perfect Hit" Mean Show-Up's Authorization Level Expected Cancellations and No-Shows
80%
90%
100%
110%
120%
Spoilage - Denied Boarding
Figure 1.3 "Perfect Hit" -Overbooking Policy
Later, United Airlines obviously realized that it is more important to maximize the expected revenues and implemented the new space planning model (DART) in 1986 [13]. Once again, the overbooking level represents an economic trade-off between the costs of empty seats and the costs of denied boardings in accordance to the service and revenue objectives of the airline. Based on this simple revenue maximization approach, more advanced booking techniques were implemented by United Airlines as presented by N. B. Ashby [14] in 1989. While the overall objective of revenue maximization still applies, the entire process from booking a seat to departure of the flight is modeled more realistically within the refined model. Main features are the uncertainty added to no-show rate, cancellations, demand and late demand as well as two types of denied boardings (voluntary and involuntary) and a multiple cabin aircraft.
The same basic principal of balancing the costs of spoilage and denied boardings appropriately in order to maximize net revenues can be found within the overbooking model of American Airlines as presented by B. N. Srikar [15]. As shown in Figure 1.4, the optimum authorization level is determined by matching the marginal expected costs of oversale with the marginal expected costs of seats light. The marginal expected costs are the probability-weighted costs of an additional incident of oversale or spoilage. It is reasonable to accept any additional booking, as long as the marginal expected costs of spoilage exceed the marginal expected costs of denied boarding. In this case, an additional booking reduces the expected marginal costs of spoilage significantly while the respective costs of denied boardings raise slightly. This is true until the equality of both expected marginal costs is reached. Then, any further booking leads to an increase of expected denied boarding-costs which cannot be compensated by the decrease of expected spoilage-costs. The additional booking does not raise the expected net revenues any more but lowers it. Once both marginal expected costs match each other, the optimum number of bookings is reached and the expected, i.e. statistically predicted, net revenues are maximized.
Expected Revenues and Costs
Expected Passenger Revenue
Cabin Capacity
Expected Net Revenue
Expected Costs of Denied Boarding Marginal Expected
Costs of Spoilage Marginal
Expected-Costs of Denied Boarding---
-100%
110%
120%
Opt. Authorisation
Authorisation
However, the costs of oversales are difficult to establish because of their tangible and intangible components. Srikar claims that both components of the oversale costs should be assumed more accurately as non-linear functions. It is evident that the compensation for involuntary denied boardings should be higher than for voluntary denied boardings. Also the intangible components in the form of goodwill costs and perceived service quality depend heavily on the number of oversales. Further, he argues that airlines might want to penalize themselves more with increasing numbers of oversales because of service policy considerations. In order to overcome these difficulties he uses a "combination of the knowledge of tangible costs with an acceptable service level constraint". The model includes therefore a non-linear estimation of tangible oversales costs, as well as the "old" idea of constraining the number of expected denied boardings. The tangible costs of oversale are still approximated by a relatively simple step function.
Within American's revenue management system DINAMO, which was implemented in 1988, another interesting aspect of revenue management was incorporated, the recapture probability [4]. This is the likelihood that a passenger who cannot get the desired reservation will book on another flight rather than switch to another airline. While the risk of oversales increases with an increasing number of bookings, the additional expected revenue decreases because of the higher expected average oversale costs. It can be therefore beneficial for the airline to reject a booking request in cases of high recapture probabilities even though an incremental net revenue gain is expected. In such a case, the expected revenue increase of an alternative flight exceeds the additional expected net revenues of the highly overbooked flight. Hence, high recapture probabilities lead to lower overbooking levels.
Even though a variety of different approaches to the overbooking problem were have been proposed, as outlined in the previous discussion, the basic concepts and policies to determine the optimum authorization have not changed over the years. Either one or a combination of the subsequent listed objectives is considered by the airlines:
" maximizing net revenues by minimizing the total costs of oversale and spoilage * balancing the number of spoiled seats and denied boardings (perfect hit) * never exceeding a pre-set maximum number of expected denied boardings * maintaining an average ratio of x denied boardings per 1000 passengers
The currently prevalent models pursue two strategies. Either the expected net revenues are optimized by matching the incremental expected gains and incremental expected costs of oversale or the revenues are maximized while a competitive service level (related to denied boardings) is maintained [16].
1.3 Overbooking Performance -What is it ?
Reviewing the different overbooking models used by the airlines, it is interesting to note that very few attempts were made (or published) to assess the overbooking performance of their daily operations. It is even more surprising given the history of the overbooking problem. Although the CAB permitted deliberate overbooking in 1967 as long as it could be "carefully controlled", the expression was never quantified by the CAB. Thus, the airlines determined themselves what they considered to be an acceptable overbooking performance.
Since then the situation has not changed very much. Although the CAB was dispensed from most of its controlling responsibilities with the Deregulation Act of 1978, nowadays airlines are still required to report their "Overbooking Performance" to the US Department of Transportation (DOT). However, the required ratio of denied boardings per 1000 boarded passengers does not mean very much, as outlined below.
Consider for instance two airlines A and B. While airline A does very poorly on some flights, experiencing an extremely high number of denied boardings, it does not have any oversales but many empty seats on other flights (due to lower demand, too large aircraft, poor scheduling etc.). Airline B in contrast reports some denied boardings on many flights but does not waste its resources to the same extent as airline A by flying around with empty seats on most of its remaining flights. Assuming further, that system-wide both airlines carry the same number of passengers and deny boarding to the same number of passengers. The result would be an identical ratio of oversale incidents per 1000 passenger. The shortcomings of such a reporting methodology are obvious. Having the same "Performance Index", airline A is doing worse than airline B as far as overbooking is concerned. But not only the economics of airline A are bad, also the perceived service standard is lower. An average of 2 oversales per relevant flight are certainly more desirable in terms of perceived service level than 7.5 denied boardings per relevant flight. Table 1.1 illustrates this problem.
Table 1.1 -Denied Boardings per x Passengers Ratios
Airline A Airline B
Number of flights which experienced 200 750
denied boardings
Average number of denied boardings 7.5 2
per flight
Total number of denied boardings 1500 1500
Total number of passenger 1,000,000 1,000,000
System wide seat capacity 1,600,000 1,300,000
Average load factor 62.5 % 76.9 %
Number of denied boardings per 1000 1.5 1.5
passengers
The main problem however are the economic implications for the airlines itself. Even though they are also interested in maintaining a certain service level, the main objective is revenue maximization. It is therefore essential for them to use all available tools to influence the net revenues gained per flight. With the use of even more refined overbooking models, it is getting more and more important to monitor the performance accurately on a quasi real-time basis in order to detect deviations from the ideal outcome as soon as possible. This could enable the airlines to counteract quickly and efficiently in order to compensate for unexpected changes in the mean show-up rate for example. Most important, however, is the evaluation of the economic achievements due to overbooking. This means that it must be possible to control the success of the trade off between spoilage and denied boardings as predicted by the overbooking model. It is further necessary to evaluate the actual overbooking performance on a single flight level as well as on an aggregate flight level. If booking analysts have overruled the automated recommendations it is of interest if these human overrides were beneficial for the airline. While the purpose of allowing analysts intervention can easily be justified by the need to incorporate common sense and human discernment in unusual situations, it is supposed to be to the advantage of the airline. Therefore, it is essential to compare the actual achieved performance with the theoretical performance which would have been achieved if the automated system's overbooking level recommendation would have been applied. It then can be decided if the system override by the analyst led to a reduction of
An aggregate evaluation of the overbooking performance on a monthly or quarterly time horizon is necessary to measure the success in trading off denied boardings and spoilage on a long term basis. This helps to detect trends in either direction and prevents the development of "hidden" negative tendencies. Furthermore, useful information can be gained which can give important feedback about the assumed inputs of the applied overbooking model. For instance, any fine-tuning concerning the assumed tangible and intangible costs can be carried out by reviewing the recent overbooking performance. The same applies for all other input parameters of the overbooking model which had an effect on the booking level authorization. The airline must be able to assess the economic impact of their modifications of the overbooking model and the required input data. As such, analytical tools should be made available to assess the impact of any modification made to the overbooking model. If, for instance, a change which was supposed to improve the overbooking situation results in four additional denied boardings for an incremental reduction of one spoiled seat, the trade-off between spoilage and oversale turns out to be worse (assuming a modest spoilage/denied boarding cost ratio less than 4/1). Any variation can only considered to be successful if the improvement of the spoilage situation was not made at the expense of an extraordinary deterioration of the number of denied boarding incidents This example underlines the importance to trace the performance and to analyze the spoilage and oversale information concurrently and not separated from each other.
Furthermore, it might not only be important to know the actual performance but also what performance could have been achieved if appropriate overbooking levels were applied. Nevertheless, the use of such an indication must be considered very carefully because of its implications for the level of expectation and the danger of getting "disappointed". Although it is very tempting to calculate a figure which suggests an obtainable perfect outcome, it becomes hazardous if the expectations are set beyond achievable goals. It must never be forgotten that the show-up rate is probabilistic and therefore uncertain. A perfect hit cannot be achieved on every flight.
Additionally the problem of accurate data provision should be mentioned briefly. Whatever tools are applied for the purpose of analyzing the overbooking performance, it is essential to obtain the required flight information in the needed accuracy. Precise evaluations can only be made if the provided data fulfill the precondition of being comprehensive and exact.
It is therefore essential to tackle the problem of overbooking performance measurement systematically in order to find an appropriate tool which helps to evaluate the operations on a daily, monthly or annual basis and report to the airline management. Not only overbooking but also the
entire revenue management system should be treated like a closed control loop. Every change of input data leads to a changed situation which has to be analyzed. The findings must be reported back to the beginning of the chain in order to provide feedback. Otherwise it is impossible to control the revenue management activities properly. Without control it is not feasible to distinguish between profitable, invaluable and even harmful actions. While every simple industrial steering system is designed as a closed control loop, there is even a greater need to apply the same "standards" for complex mechanisms such as those utilized for the purpose of revenue management and overbooking.
Chapter 2
Overbooking Performance Measurement Literature Review
Sophisticated overbooking techniques, which reflect the objectives and policies of the airlines, are an integral part of today's revenue management systems. Although all major airlines apply overbooking models in order to reduce the spoilage of capacity and to maximize their revenues, very few attempts have been made to measure the performance of their actions. Due to its severe economic implications on the net revenues gained per flight, it is essential to monitor the "rate of success" of the applied overbooking technique.
Coupled with the problem of assessing the performance are the questions: What performance can be considered as good ? - and - What could have been achieved ? Furthermore, a much more detailed definition of the objectives of the adopted overbooking policy must be offered than only a statement like "high load factors coupled with low denied boardings" [14]. Although this remark describes the economic goals of the airlines very well in general terms, it does not help at all to evaluate a certain overbooking situation. Any serious attempt to assess the overbooking performance must therefore clarify the goals by using particular key values or target ranges which have to be achieved.
Depending on the pursued overbooking policies of the airlines, different approaches are applied to measure the success of setting a certain overbooking level. These models include monetary evaluations as well as non-monetary performance measurements. A further distinction of the different approaches is the size of the sample which has to be evaluated. Either single flights are analyzed or the success of overbooking is evaluated on an aggregate flight level. In this chapter, the main attempts towards the performance measurement of overbooking levels are illustrated and discussed in greater detail.
2.1 Non-Monetary Performance Measures
A prevalent non-monetary performance measurement is the straight evaluation of the number of spoiled seats or denied boardings in relation to some passenger figure. Once, the notation of spoilage and denied boardings are clearly defined, it is relatively easy to derive the required data from the raw booking and flight data. Within this approach the number of oversales or seats light is simply related to the number of passengers or the number of affected flights by calculating the relevant ratios. Figures are produced which express either (1) the average number of oversale and spoilage incidents per 1000 boarded passengers, (2) the average number of oversale and spoilage incidents per flight or (3) the ratio of seats light per denied boarding. A proper interpretation of these ratios is difficult and only feasible in correlation to historic performance data. Due to the probabilistic nature of the show-up process, the calculated ratios depend on the considered route, the days of operations, the season etc. While a ratio of 1.5 denied boardings per 1000 passenger, for example, might be the system-wide average, it can be exceeded by far on some routes which experience a high variation of the show-up rate. Hence, the resulting ratios of routes which are well known to be less predictable must be analyzed more carefully than "normal" samples which meet the average assumptions. These measures are therefore rather useful to identify changes of the overbooking performance compared to former achievements than to determine an universal and
absolute performance index.
A critical feature is the basis of the comparison. In order to express a meaningful ratio it is necessary to relate the number of seats light or oversales only to relevant, i.e. "closed flights" flights. These are flights where the number of bookings exceeded a certain threshold at the day of departure. This threshold is usually slightly lower than the determined authorization level in order to allow for a certain buffer range. This is required to include also flights which were constrained by the authorization level sometimes during the booking process but ended up with slightly less bookings than actually authorized. Although the data are regularly reviewed by the computer reservation system or an analyst, a flight might have been closed a few days before and does not appear so during the review or at the day of departure because of recent cancellations. In addition to that, every flight that experienced denied boardings should be included even though the authorization level has not been reached at any time.
Another aspect of this comparison which has to be clarified is the relation of the spoilage and denied boarding data to the relevant flights itself. While a ratio could be established by using either the number of flights or the number of boarded passengers, the latter one is logically more correct. Due to the disregard of the aircraft size, a ratio which is based on the number flights
overemphasizes the denied boardings or seats light on large aircraft and vice-versa underestimates overbooking incidents on small aircraft. In spite of this and contrary the fact that all overbooking optimization methods maximize the generated revenues under consideration of the aircraft size, some airlines still use denied boarding and spoilage ratios related to the number of flights. A reason for this might be quality of service considerations. It could been argued that the perceived service level is more closely related to the absolute number of denied boardings rather than the percentage value. Passengers who were left at gate do not care about the size of the aircraft and percentage relations. Even though 8 denied boardings on a 80 seat aircraft are proportional to 30 denied boardings on a 300 seat aircraft, the passenger understanding for this situation is probably not proportional. Nevertheless, the economic objectives are not met. From the economic point of view there is no difference between 8 denied boardings or spoiled seats on a 80 seat aircraft compared to 30 incidents on a 300 seat aircraft respectively. The portion of lost revenues because of compensation payments (or lost opportunity in case of spoilage) is still 10% and exactly this percentage is optimized by the overbooking model.
While these ratios are ideal for comparing a pre-set service level constraint which limits the number of denied boardings, the economic objectives of the airline are assessed indirectly and only to a small extent. Due to the failure to incorporate any costs by using these ratios, it is difficult to
analyze the economic implications of overbooking shortcomings. A cost ratio of the spoilage (SPLs) and denied boarding costs (DB$) can be implemented by choosing an appropriate goal to be achieved. In order to maximize the net revenues, the cost ratio SPL$/DB$ should correspond to the performance ratio which expresses the number of denied boardings per spoiled seat DB/SPL (please note the inverse relationship of both ratios). A non-linear increase in these opportunity or oversale costs, because of involuntary denied boardings for example, cannot be considered within this simple evaluation.
Furthermore, an interpretation of these ratios is not easy. Whatever ratio is used for the analysis, it is only relevant if compared with former achievements. In particular the average number of spoiled seats or denied boardings depends strongly on the routes, day of operations, etc. Thus, extreme variations from the system-wide average can occur if only a selected part of the system is analyzed. Therefore, the application of a spoilage/denied boarding-ratio which expresses the number of spoiled seats per experienced oversale is not a very useful tool for analyzing purposes. On the other hand, an independence from the absolute variations is gained by determining a ratio which expresses the number of denied boardings per spoiled seat or vice versa. While, for instance, a sample of flights (A) experience an average of 8 seats light and 4 oversales per flight, another sample (B) could experience an average of 10 spoiled seats and 5 denied boardings per flight.
Although the latter sample appears to be worse in terms of overbooking performance, it turns out, that sample B differs only by a higher standard deviation of the show-up rate than sample A. The amount of spoilage per denied boarding is the same in both cases leading to a ratio of 2/1. The application of a spoilage per denied boarding ratio reveals that both flights were equally balanced in terms of overbooking.
Despite the shortcomings mentioned above, the use of ratios expressing spoilage and in particular oversales in relation to number of boarded passengers seems to be a fairly common tool which is applied by airlines in order to evaluate their overbooking techniques. References to these "overbooking performance ratios" can be found in American Airlines [3] and United Airlines [13] for example.
The same approach was also used by Delta Airlines [17] to analyze the oversale and spoilage performance of Y-class. The main purpose is to evaluate flights which were overbooked in accordance to the recommendations of Delta's ENABLS Revenue Management System in contrast to flights where the automated recommendations were overridden by revenue management analysts. In order to consider relevant flights in terms of overbooking, only "closed" flights are analyzed. These are flights where the final number of bookings exceeded a specific threshold which is slightly smaller than the authorized booking level. Furthermore, flights were excluded for the purpose of their analysis when the authorization level exceeded the actual cabin capacity only by a small number of extra "seats". In order to appraise the success of the system overrides of the ENABLS recommendations by revenue management analysts, the data are now split into three categories. These are (1) all flights with an applied authorization level equal to the recommended one, (2) all cases with an effective authorization level exceeding the recommended overbooking level and (3) all flights with an applied overbooking level less than recommended by ENABLS. In addition to that a further categorization of international, domestic and total flights in the system is applied to acknowledge the different characteristics of domestic and international flights.
The subsequent measurement of the overbooking performance itself is based on the denied boarding and spoilage ratios as discussed above. Thus, the average number of denied boardings and seats light per flight is calculated for each of these categories. Finally, a spoilage/denied boarding-ratio is determined which shows the number of spoiled seats per denied boarding. The comparison of the spoilage/denied boarding-ratio between the different categories allows conclusions about the benefits or costs of authorization changes by revenue management analysts.
Nevertheless, the main airline objective, revenue maximization, is only minimally reflected by this type of success measurement. Neither the costs of oversale nor the opportunity costs of having empty seats are directly considered by this model. This is a major limitation, if the overall goal of overbooking is supposed to be revenue maximization. The use of these ratios is also limited by the requirement of large sample sizes. Even though it is a usable tool to measure the success in maintaining an average service level on a system-wide basis, it cannot be applied on a single flight basis but only on an aggregate flight level which involves larger sample sizes. No meaningful ratio of spoilage per oversale can be obtained if the sample size is too small.
2.2 Monetary Performance Measures
In order to overcome the shortcoming of dismissing the impact of costs, it is essential to apply monetary performance measurement models. These approaches are by definition more capable to evaluate the economic implications of overbooking. This is achieved by using monetary values to express the negative effects of oversale and spoilage onto the generated revenues. Rather than employing the absolute number of oversold seats or the number of seats light, the respective costs of denied boardings or spoilage are used to measure the success of the revenue maximization. While the costs of spoilage are opportunity costs, i.e. expected revenues which did not materialize, the costs of oversale are more "real". These could either be expenses for overnight accommodations, meals or accommodation on another flight with a competing carrier, for example. In addition, the costs of denied boardings are characterized by an intangible component, passenger goodwill. What is the monetary value of passenger goodwill and "how much" passenger goodwill is lost if the passenger was involuntarily denied boarding ? This question becomes a major factor if costs of overbooking are involved and is difficult to estimate. Another uncertain feature are the opportunity costs. Even though the number of spoiled seats is known once the aircraft leaves the gate, the potential loss in revenue can only be estimated by making certain assumptions about the revenue generating ability of the remaining seats. This could be the average revenue per passenger (yield) for this flight or some demand based mixture of sold fare classes, for example. It is therefore another challenge to approximate the occurring costs as accurately as possible in order to evaluate the overbooking performance on a cost basis.
Once rational cost assumptions have been established (which, of course, have to be under constant review), the basis for an overbooking performance evaluation is given which corresponds to the optimization algorithm and therefore the airline objectives. It also underlines that any serious approach towards the measurement of overbooking performance should be cost oriented in some way. If the main objective of the airline is revenue maximization, the performance of achieving this
goal must be assessed and not the perceived service quality deterioration due to denied boardings for instance. It is therefore not surprising that different performance measurement approaches were developed by the airlines which incorporate the economic implications of overbooking.
The following abstract discusses the philosophy and concepts of two different approaches, a cost based ratio model as implemented by United Airlines [13] and the Revenue Opportunity Approach (ROA) which is applied by American Airlines [4], British Airways [19] and Delta Air Lines[18].
2.2.1 Relationship of Oversale to Spoilage Costs
The basic concept of this evaluation philosophy is similar to the one described above in section 2.1. Rather than using the absolute or relative number of denied boardings or spoiled seats, either the
opportunity costs due to seats light or the various cost elements of oversales, compensation payments etc., are the basis for the performance measurement. Here, the average costs of spoilage and denied boardings are determined for a selection of flights. Due to its nature that every "non-perfect hit" flight either experiences oversale or seats light (some exceptions may occur in which a flight departs with empty seats while at the same time boarding is denied to late show-ups), it is only feasible to obtain the required cost ratio for a significant sample of flights. This means that the sample must be large enough and that the flights must be comparable. This sample could be, for instance, the same flight number over a weekly or monthly period or any other justifiable sample (justifiable in the sense that only comparable flights, i.e. flights with the same properties are compared). This comparability requirement is extremely important if small samples are analyzed. On the other hand it is self-explanatory that this comparability requirement cannot be enforced on a system wide evaluation. Once the average costs of oversale and spoilage are established, the data can be analyzed. The evaluation itself is identical to the one described before. The experienced trade off between costs of spoilage and costs of oversale can be measured by the ratio which indicates the amount of money spent due to oversale for every Dollar which was "lost" because of spoilage. The objective of balancing the costs of overbooking is achieved if the ratio of spoilage to denied boarding costs is close to one. Any excessive deviation from this balanced ratio illustrates that either the costs of spoilage or oversale are too high, i.e. the overbooking performance is not optimal.
Again, the problem of aircraft size arises if the costs of overbooking are considered on a flight basis as opposed to a relation of the overbooking costs to the total "revenue potential" or total "revenue opportunity". This revenue opportunity value ,which will become even more important within the application of the Revenue Opportunity Approach, accounts for the total amount of
revenues which could have been generated. The resulting problem is related to the determination of the costs of spoilage. While the total revenue potential in terms of seats is well defined by the availability, the equivalent monetary "number", expressing the overall revenue opportunity, cannot been derived as easily. The determination of this value is even difficult with perfect hindsight after departure. The revenues which could have been generated by every empty seat can only be estimated by the application of assumptions as outlined before. A more detailed discussion of this problem can be also found in section 2.2.2 covering the characteristics of the Revenue Opportunity Approach.
However, the comparison of average oversale and spoilage costs matches indirectly the controlling needs of the main algorithm of most overbooking models. Remembering that the net revenues are maximized when the average expected costs of oversale are equal to the average expected costs of seats light, it is obvious that a practical match of these costs can be applied to measure a good or bad performance. Although it must be stressed again that the described way of performance measurement is only as good as the estimated spoilage and oversale cost, it is a powerful tool which emphasizes the overall airline objective of revenue maximization.
An enhanced version of the above approach was developed by United Airlines [13] and focuses mainly on the subsequent analysis and presentation of the results. While prior to 1986, United Airline's objective was to minimize the number of spoiled seats and denied boardings, they evidently realized that it was more important to concentrate on the economic aspects of overbooking. Therefore, United's new space planning model DART was implemented, replacing the old approach in which all measures were taken to achieve a "perfect hit" on every flight (see also section 1.2). Thus, the policy of minimizing the number of spoiled seats and denied boardings changed towards the objective of maximizing the expected net revenues. This is achieved by balancing the trade off between the costs of spoiled seats and denied boardings.
United Airlines also recognized that any evaluation approach has to be compatible with the policies and methods used to set overbooking levels. It is therefore obvious that, concurrently with the implementation of the new overbooking model DART, economic aspects of space planning were included into the overbooking performance evaluation model as presented by W. Mainzer [13]. Besides the compatibility requirement, he also concludes that the measurement should be "normalized appropriate to the risks and benefits of space planning" and underlines the need to generate a monetary figure to understand the impact of overbooking on the airline's revenue. The necessity of a normalized measurement addresses the problem that only relevant flights should be considered. Therefore, only "space planned" flights are included into the performance analysis.