HAL Id: inserm-00153871
https://www.hal.inserm.fr/inserm-00153871
Submitted on 13 Jun 2007HAL is a multi-disciplinary open access archive for the deposit and dissemination of sci-entific research documents, whether they are pub-lished or not. The documents may come from teaching and research institutions in France or abroad, or from public or private research centers.
L’archive ouverte pluridisciplinaire HAL, est destinée au dépôt et à la diffusion de documents scientifiques de niveau recherche, publiés ou non, émanant des établissements d’enseignement et de recherche français ou étrangers, des laboratoires publics ou privés.
Angioplasty simulation using ChainMail method
Tanguy Le Fol, Oscar Acosta-Tamayo, Antoine Lucas, Pascal Haigron
To cite this version:
Tanguy Le Fol, Oscar Acosta-Tamayo, Antoine Lucas, Pascal Haigron. Angioplasty simulation us-ing ChainMail method. Medical Imagus-ing 2007, Jun 2007, San Diego, California, United States. pp.65092X-1 -65092X-8, �10.1117/12.709582�. �inserm-00153871�
Angioplasty simulation using ChainMail method
Tanguy Le Fol
*1, Oscar Acosta-Tamayo
2, Antoine Lucas
1and Pascal Haigron
11
INSERM, U642, Laboratoire Traitement du Signal et de l'Image, Rennes, France, and Université
de Rennes1, LTSI, Campus de Beaulieu, 35042 Rennes Cedex, France.
2
BioMedIA Lab - Autonomous Systems Laboratory CSIRO ICT Centre, Level 20, 300 Adelaide
Street, Brisbane, QLD 4000 Australia.
ABSTRACT
Tackling transluminal angioplasty planning, the aim of our work is to bring, in a patient specific way, solutions to clinical problems. This work focuses on realization of simple simulation scenarios taking into account macroscopic behaviors of stenosis. It means simulating geometrical and physical data from the inflation of a balloon while integrating data from tissues analysis and parameters from virtual tool-tissues interactions.
In this context, three main behaviors has been identified: soft tissues crush completely under the effect of the balloon, calcified plaques, do not admit any deformation but could move in deformable structures, the blood vessel wall undergoes consequences from compression phenomenon and tries to find its original form.
We investigated the use of Chain-Mail which is based on elements linked with the others thanks to geometric constraints. Compared with time consuming methods or low realism ones, Chain-Mail methods provide a good compromise between physical and geometrical approaches. In this study, constraints are defined from pixel density from angio-CT images.
The 2D method, proposed in this paper, first initializes the balloon in the blood vessel lumen. Then the balloon inflates and the moving propagation, gives an approximate reaction of tissues. Finally, a minimal energy level is calculated to locally adjust element positions, throughout elastic relaxation stage.
Preliminary experimental results obtained on 2D computed tomography (CT) images (100x100 pixels) show that the method is fast enough to handle a great number of linked-element. The simulation is able to verify real-time and realistic interactions, particularly for hard and soft plaques.
KEYWORDS: Modeling, Surgical Simulation, ChainMail, Visualization. 1. INTRODUCTION
Cardiovascular diseases are among the most common causes of death among industrialized countries. Stenosis is one of those diseases. To diminish the severity of this problem, practitioners use, as a common practice, a minimally invasive procedure called percutaneous transluminal angioplasty (PTA). It consists in introducing a catheter into the lesion area and inflating a balloon to expand the blood vessel lumen. However, during the intervention, hard plaques, from the stenosis, could break due to the balloon pressure and generate complications. Moreover, for certain number of patients, a restenosis can be observed. The efficiency and the precision of the procedure could be improved by implementing simulator that could predict several scenarios for each patient during the planning.
Modeling approaches could be classified by their geometrical or physical formalism. Non-physically (or geometrically) based methods are used as a simplified physical principle to achieve a reality-looking effect. They allow a user to deform the space containing the objects or to manipulate operators like bend and twist onto primitives or sampling data1. This type of method is very fast but do not use physical properties. Those methods are not realistic enough, that is why applications such as Tseng & al2 and Sela & al3 combine them with other methods or Lenoir & al4 and France &
al5 use them for specific topologies (1D linear curves). For applications which demand realistic simulation of
deformable physical bodies, physical modeling fit best. This invariably means numerically solving the partial differential equations that govern the evolving shape of the deformable objects and their motion through space. Finite element method (FEM), firstly developed in 1950 by M. Turner, is the most realistic method. It is used to find an
*
[email protected]; phone (33) 2 23 23 52 70 ; fax (33) 2 23 23 69 17
HAL author manuscript inserm-00153871, version 1
HAL author manuscript
SPIE Medical Imaging 2007: Visualization and Image-Guided Procedures. (01/06/2007) 65092X-1 -65092X-8
This paper was published in Proceedings of SPIE -- Volume 6509 and is made available as an electronic reprint with permission of SPIE. One print or electronic copy may be made for personal use only.
Systematic or multiple reproduction, distribution to multiple locations via electronic or other means, duplication of any material in this paper for a fee or for commercial purposes, or modification of the content of the paper are prohibited.
approximation for a continuous function that satisfies some equilibrium expression. In FEM, the object is divided into elements joined at discrete node points. A function that solves the equilibrium equation must then be found for each element. Nevertheless, their computational costs make them hard to be use in real-time application with patient data. Holzapfel & al6 and Di Puccio & al7 applied FEM optimized for angioplasty in real-time, but only for few millimeters around blood vessel’s lumen, preventing to take into account the constraint imposed by external tissues. Among discrete physical models, Mass-Spring formalism is one of the most used methods. It defines an object as a set of mass points connected by dampened springs. However, mass-spring approach requires computation time similar to the FEM
optimized model, while giving worse results8. Differing from these axes Chain-Mail method, recently proposed by
Gibson9 combines mechanical behaviors and geometric laws. Its performances make a good compromise between
computation time and realism.
In this context, the overall objective of this first work is to develop a fast, realistic and patient specific simulation usable by practitioners before and during the operation based on Chain-mail approach. This paper is organized as follows: Section 2 introduces ChainMail principle and presents the proposed method for angioplasty simulation. Section 3 illustrates experimental results for 2D CT images. Finally, in Section 4, conclusion of the presented work and the direction of our future research are described.
2. METHOD 2.1 Chain-Mail Principle
The main idea of ChainMail approach9 can be summarized as follows. When an element of the data structure changes
position, it transmits to its neighbors the information concerning its new state to actualize their positions and to upgrade the whole structure. This approach requires two initial processes, the creation of the data structure and the definition of the geometric constraints.
Data structure consists of elements, called “linked-element”, which represent the volume data. An element holds information about the deformation, elasticity parameters and its number of neighbors (4 or 8 in 2D and 6 or 24 in 3D). Geometric constraints are used to model different behaviors between elements such as tension (parameter Max), compression (parameter Min), and shearing (parameter MaxShear) (Figure 1).
Figure 1: Valid region for an element defined by their neighbors9.
In order to take into account inhomogeneous nature of tissues, Schill & al10 proposed an “Enhanced Chain-Mail”
method which combines parameters of each linked-element with parameters of its neighbors (Figure 2).
(a) (b) (c)
Figure 2: a) Two elements using “Enhanced Chain-Mail” at wait state, b) maximal compression, c) maximal tension10.
X X = Xmin = Xmin1+Xmin2 X = Xmax = Xmax1+Xmax2 MaxShearX MaxShearY MaxY MinY MinX MaxX Right neighbor Bottom neighbor
Then, during the simulation phase, propagation and Elastic-Relaxation processes are both considered.
Propagation process uses geometric constraints to verify that each element stay between the Min and Max position, compared with its neighbors. A perturbation is produced when an element is moved and violates constraints. Rules are established to manage the perturbation propagation through the whole system thanks to links and geometric constraints. The concerned elements have to move so as to find a new configuration which satisfies new constraints. However, this action does not guaranty a global minimal energy configuration, notably for elastic tissues which try to recover the initial structures.
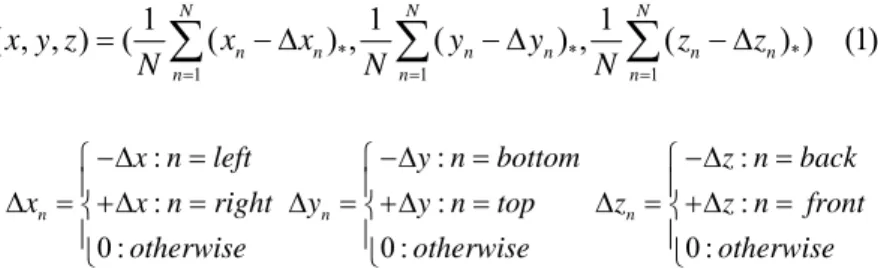
Elastic-Relaxation permits such a minimal energy configuration. There are different algorithms, for instance Gibson11,
used a function based on distances between elements. For example, in 6 neighbors linked simulation, the optimal position can be defined to be the point midway between existing neighbors:
* * * 1 1 1 1 1 1 ( , , ) ( N ( n n) , N ( n n) , N ( n n) ) (1) n n n x y z x x y y z z N = N = N = =
∑
− Δ∑
− Δ∑
− Δ : : : : : : 0 : 0 : 0 : n n nx n left y n bottom z n back
x x n right y y n top z z n front
otherwise otherwise otherwise
−Δ = −Δ = −Δ = ⎧ ⎧ ⎧ ⎪ ⎪ ⎪ Δ = +Δ⎨ = Δ = +Δ⎨ = Δ = +Δ⎨ = ⎪ ⎪ ⎪ ⎩ ⎩ ⎩
Where N is the number of existing neighbors for the element. ( )* indicates if the neighbors exits and Δx, Δy and Δz are optimal link lengths for left/right, top/bottom and back/front neighbor pairs.
2.2 Modeling
2.2.1 Context and hypothesis
A stenosis is an abnormal narrowing in a blood vessel (generally in coronaries, iliac arteries and carotid), generated by a series of complex phenomena. Such a region can be composed by soft lipidic material, elastic wall and calcification plaques (Figure 3). Thus, during this dilatation, tissues are compressed or stretched, sometimes torn into the vessel wall and the vessel is widened up to an acceptable diameter for normal blood flow recovering. At a macroscopic level, we assume that vessel wall has elastic or pseudo-elastic behavior, calcification does not admit any deformation and is moved as a whole, and soft plaque crushes against constraint.
Figure 3: Stenosis with several tissue classes according totheir density level (from angio-CT).
In order to create such tool-tissues interaction in a patient specific simulation, three main problems have to be considered.
-Organization of the patient data. Definition of the grid and update functions associated (including interpolation, multiple contacts).
-Definition of the balloon. Initialization of parameters (center, radius, compliance) and geometric definition of balloon when it inflates.
-Tissues definition. Linkage of real parameters with simulation tissues to reproduce the breaking of plaques12, the elasticity of the wall13…
2.2.2 Model construction
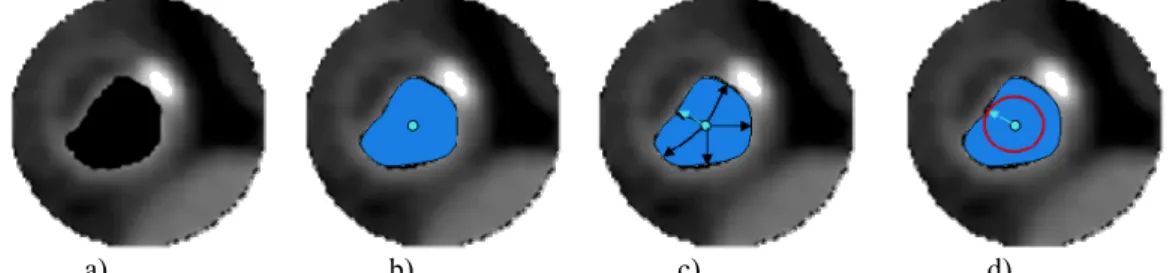
We consider, in this first work, 2D images from angio-scanner where the tool-tissues interactions zone is defined by the vessel lumen (pre-segmented by a simple region-growing process). It determines the region where the balloon, considered as non-compliant one, is placed and inflated. This balloon is described as a disc whose radius is fixed by a ray casting process (keeping the smallest one) and located at the mass-center of the vessel lumen (Figure 4).
a) b) c) d)
Figure 4: Initialization of the balloon. Lumen segmentation (a), mass-center calculation (b), minimal radius detection (c), initial balloon (d).
Chain-Mail method requires the construction of a grid where each node corresponds to a linked-element. A boundary mesh leads to a small number of elements, decreasing the computational time, but also to a loss of realism. A polar grid makes difficult to calculate the new centre of the balloon, unless to transform, for each step, the grid in Cartesian coordinate system. However these grid modifications deteriorate the image. A regular Cartesian grid has been chosen for the simulation because it takes advantage of the high resolution data produced by CT-scanners and provides a direct access to the data.
Elements density in the Cartesian grid is taken as parameter to define geometric constraints (MinY, MaxY,
MaxShearX…) according to the curves on Figure 5. On these curves, three main classes are considered (to make a
compromise between computation time and realism) but more could be differentiated. On the one hand, Elements density higher than the rigidity threshold, empirically fixed, belong to stiff region (Min = Max, tissues like calcification) and do not admit any deformation but could move in deformable structures. On the other hand, for low density (such as lipidic material, blood), deformation are authorized between 10% (maximum compression) to 90%
(maximum tension) from its initial distance.Between those two classes, tissues are assumed to present elastic behavior.
Figure 5: geometric constraints definition curves according to density (where Hounsfield values are translated into grey
level scale: 0 to 255). Figure 6: inflation simulation diagram.
Max Min 255 0 Distance
Rigid threshold Grey Level 90%
50%
10%
Soft Elastic Stiff
2.2.3 Simulation
Figure 6 outlines the main steps for the simulation of angioplasty. More precisely, the balloon is positioned in the lumen, already segmented. This balloon inflates by successive iterations, pushing at first blood then the vessel structure. Initialization process defines simulation parameters and builds structure: initial position and radius of the balloon, 2D grid, numbers of neighbors (here, 4 or 8-connectivity) and geometric constraints. Each pixel corresponds to a nod of the grid (Figure 7).
Figure 7: Initial balloon and grid using ChainMail formalism.
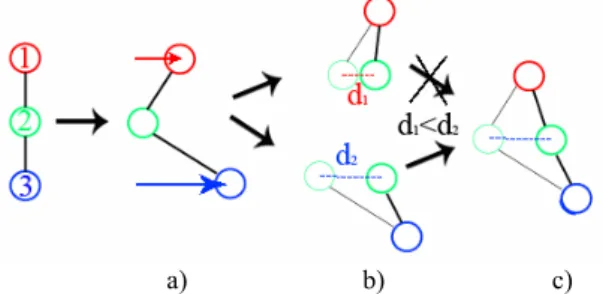
Perturbation propagation is made by ChainMail algorithm and gives a deformation approximation. More precisely, Enhanced ChainMail is used here to deal with inhomogeneous materials but also with multiple initial elements moved (pixels defining the balloon) (Figure 8). Indeed, this method allows to move an element, only one time, whatever is the number of initial elements moved.
Figure 8: a) The deformation is initiated by moving element 1 and 3. b) Next step, constraint violations between elements 1/2 and 2/3 is calculated independently. C) Element 2 is moved by the neighbours that create the largest constraint violations, here element 3. The elastic relaxation finds the minimal energy configuration where the vessel wall tries to find its original form. This algorithm is based on the Gibson11 method (equation (1)).
Once the minimal energy configuration is calculated, the image is updated by a simple interpolation to position pixels in a new Cartesian grid.
The method is repeated with the new image.
3. RESULTS
To illustrate results of this method, we used two different examples. The first case is about soft plaques and calcification. The second one is about calcified plaques next to semi-rigid tissue. Both are pictures of 100×100 pixels from CT scanner. This system was implemented in C++ and uses FLTK-VTK libraries, the examples and results reported here were obtained with a 3.20 GHz CPU with 2Go RAM.
The experiments consist in evaluating step influence and the impact of number of connections with neighbors in terms of number of elements moved, computation time and graphical results.
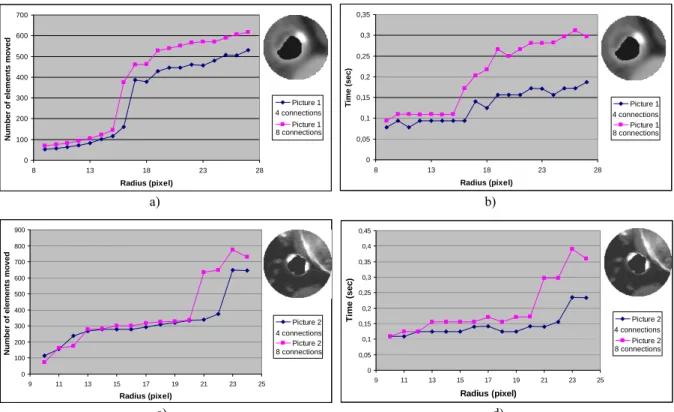
Figure 9 represents the number of elements moved and computation time during the inflation for four and height connected neighbors (with a step of one pixel). First, it can be seen that the number of elements moved follows the computation time, no matter the number of connected neighbors is. Great gaps are due to the balloon that reach and then move a rigid plaque. However, 4 connected neighbors simulation involves less variation of time than 8. Indeed, in Enhanced ChainMail, the movement is determined by comparing the constraint violations of every neighboring elements, 4 or 8 explaining the difference of time, and processing elements with the largest constraint violations first (Figure 8).
a) b) c)
Figure 9: Number of elements moved (first column a) & c)) and time consuming during balloon inflation (second column b) & d)) for soft plaques and calcification (first raw a) & b)) or calcified plaques next to semi-rigid tissue (second column c) & d)). Figure 10 and Table 1 evaluate the influence of step in terms of number of elements moved, computation time during dilation and visual results at the end of inflation (for a 4 connected neighbors). As a matter of time and number of elements moved the dilation step follows linear performance (Figure 10). By mean, the more step is high, the more number of elements moved and time consuming is high (Table 1). However, Table 1 graphical results show interesting behaviors. For high step of dilation, tissues tear, exceeding the maximum gap allowed by parameters, while for small step, interpolation reinitializes parameters at each step, allowing great dilation without tearing. To diminish tears, tension parameter from geometric constraints could be enlarged to allow more gaps between neighbors. To the opposite, to tolerate rips with small steps, interpolation could be eliminated or not used at each iteration.
Figure 10: Number of elements moved (a) and time consuming (b) during balloon inflation for several steps of dilation.
0 0,1 0,2 0,3 0,4 0,5 0,6 0,7 0,8 0,9 1 8 13 18 23 28 Radius (pixel) T im e ( s ec) Step = 1 Step = 2 Step = 3 Step = 5 0 200 400 600 800 1000 1200 1400 1600 1800 8 13 18 23 28 Radius (pixel) Numb er o f e le m en ts mo ve d Step = 1 Step = 2 Step = 3 Step = 5
a) b) 0 100 200 300 400 500 600 700 8 13 18 23 28 Radius (pixel) N u m b er of elem en ts m o ved Picture 1 4 connex Picture 1 8 connex 0 0,05 0,1 0,15 0,2 0,25 0,3 0,35 8 13 18 23 28 Radius (pixel) T ime (sec ) Picture 1 4 connex Picture 1 8 connex 0 100 200 300 400 500 600 700 800 900 9 11 13 15 17 19 21 23 25 Radius (pixel) Nu mber of elemen ts mo ved Picture 2 4 connex Picture 2 8 connex 0 0,05 0,1 0,15 0,2 0,25 0,3 0,35 0,4 0,45 9 11 13 15 17 19 21 23 25 Radius (pixel) Ti me ( sec ) Picture 2 4 connex Picture 2 8 connex
a) b) 4 connections 8 connections 4 connections 8 connections
c) d) 8 connections 4 connections 8 connections 4 connections
Step (in pixel) 1 2 3 5 Number of elements moved (average) 314 489 788 1228 Computation time in second (average) 0.134 0.171 0.290 0.551 Graphical result
Table 1: Average performance of simulation, with respect to the dilation step.
Figure 11 shows results from dilatation for two examples, for four and height connected neighbors (with a step of one
pixel). Visually, we can see that the physical behavior for hard plaques (rigidity) and for soft plaques (compression)
moves apart from classical elastic laws, and is essentially well reproduced in the Chain-Mail approach, considering geometric constraints. Nevertheless, elastic behaviors of healthy tissues such as vessel wall are not well represented because the results do not show any resistance of those tissues against the balloon. Indeed, resistance of the vessel wall is not visible, but it could be explained by the relative basic elastic relaxation that does not take into account elastic laws or by the interpolation at the end of the treatment deteriorating the image.
Figure 11: Results from dilatation with soft plaques and calcification (a & c) or calcified plaques next to semi-rigid tissue (b & d).
(a) (b) (c) (d) Radius Rinit 4 C O N N E C T I O N S 8 C O N N E C T I O N S
4. CONCLUSION AND FUTURE WORK
The objective of this work was to develop a patient specific simulation method. The proposed simulation methodology, implemented in 2D, permits to analyze the potential of an approach that combines geometrical and physical consideration to model angioplasty interactions. The data structure initialized as a Cartesian grid allows to access
patient data easily without degrading it. ChainMail method, by its low time consuming and its modularity, permits to
develop a fast simulation (in average, 400 elements in 0.2 seconds) which could manage interactions between the balloon and a large surrounding of the vessel wall. The definition of geometric constraints is well suited for hard and soft plaques. The proposed formalism brings up to new perspectives for a patient specific 3D simulation for
endovascular intervention. Further works will concern improvement of the interpolation step, a more realistic elastic
relaxation in order to readjust elements position from vessel wall as well as an evaluation of reflected forces14 from
tissues to find the new position of the balloon. Finally, comparing real post-inflation data with simulated ones for several numbers of cases is a possible way to validate our results.
5. ACKNOWLEDGMENTS
The project was supported by regional council of Brittany and INSERM (Institut national de la santé et de la recherche médicale).
6. REFERENCES
1. Barr A.: “Global and local deformations of solid primitives” in Computer Graphics 18(3):21-29,1984.
2. Tseng D.C., Lin J.Y., Lee C.H.: “A Hybrid Physical Deformation Modeling for Laparoscopic Surgery Simulation.” in Proc. World Congress on Medical Physics and Biomedical Engineering, Chicago, July 23-28, 2000.
3. Sela G., Schein S., Elber G. : “Real-Time Incision Simulation Using Discontinuous Free Form Deformation.” in
ISMS: 114-123, 2004.
4. Lenoir J., Meseure P and Chaillou C.: “ Surgical Thread Simulation” in Conference for Computer-aided Medecine
and Surgery (MS4CMS), 2002.
5. France L., Lenoir J., Angelidis A., Meseure P., Cani M., Faure F., Chaillou C.: “A Layered Model of a Virtual Human Intestine for Surgery Simulation” in Medical Images Analysis, Elsevier Sciences, 2004.
6. Holzapfel G. A., Schulze-Bauer C. A. J. and Stadler M., “Mechanics of angioplasty: Wall, balloon and stent.” appeared as Proceedings in Mechanics in Biology, J. Casey and G. Bao, eds, AMD-Vol. 242, BED-Vol. 46, New York, 141-156, 2000.
7. Di Puccio F., Forte P., Guarneri G.: “Finite element modelling of balloon angioplasty.” in IASTED International
Conference BIOMECHANICS,97-102, 2003.
8. Harders M., Hutter R., Rutz A., Niederer P., Székely G., “Comparing a simplified FEM approach with the mass-spring model for surgery simulation.” In Stud Health Technol Inform, 2003.
9. Frisken Gibson S. F.: 3D ChainMail: “A Fast Algorithm for Deforming Volumetric Objects.” in SI3D: 149-154, 1997.
10. Schill M. A., Frisken Gibson S. F., Bender H. J., Männer R.: “Biomechanical Simulation of the Vitreous Humor in the Eye Using and Enhanced ChainMail Algorithm.” in MICCAI : 679-687, 1998.
11. Frisken Gibson S. F. : “Using Linked Volumes to Model Object Collisions, Deformation, Cutting, Carving, and Joining.” in IEEE Trans. Vis. Comput. Graph. 5(4): 333-348, 1999.
12. Hayashi K., Imai Y. : “Tensile property of atheromatous plaque and an analysis of stress in atherosclerotic wall” in
Journ. Biomechanics, 6, 573-579, 1997.
13. Fung Y. C., Liu S. Q. : “Determination of the mechanical properties of the different layers of blood vessels in vivo.” in Proceeding of the National Academy of Sciences USA, Vol 92, 2169-2173, 1995.
14. Park J., Kim S.Y., Son S.W., Kwon D.S.: “Shape retaining chain linked model for real-time volume haptic rendering.” in VolVis : 65-72, 2002.