HAL Id: hal-03017843
https://hal.archives-ouvertes.fr/hal-03017843
Submitted on 23 Nov 2020
HAL is a multi-disciplinary open access
archive for the deposit and dissemination of
sci-entific research documents, whether they are
pub-lished or not. The documents may come from
teaching and research institutions in France or
abroad, or from public or private research centers.
L’archive ouverte pluridisciplinaire HAL, est
destinée au dépôt et à la diffusion de documents
scientifiques de niveau recherche, publiés ou non,
émanant des établissements d’enseignement et de
recherche français ou étrangers, des laboratoires
publics ou privés.
Probing the dynamic properties of two sites
simultaneously in a protein–protein interaction process:
a SDSL-EPR study
N. Le Breton, S. Longhi, A. Rockenbauer, B. Guigliarelli, S. Marque, V. Belle,
M. Martinho
To cite this version:
N. Le Breton, S. Longhi, A. Rockenbauer, B. Guigliarelli, S. Marque, et al.. Probing the dynamic
properties of two sites simultaneously in a protein–protein interaction process: a SDSL-EPR study.
Physical Chemistry Chemical Physics, Royal Society of Chemistry, 2019, 21 (40), pp.22584-22588.
�10.1039/c9cp04660g�. �hal-03017843�
PCCP
ARTICLE
a.Aix Marseille Univ, CNRS, BIP, Marseille, France. [email protected] and
[email protected]; Fax: +33-4-9116-4097; Tel: +33-4-9116-4414
b.Université de Strasbourg, CNRS, POMAM, Strasbourg, France (present address) c. Aix Marseille Univ, CNRS, AFMB, Marseille, France.
d.Research Center of Natural Sciences, Budapest University of Technology and
Economics, Budapest, Hungary
e. Aix Marseille Univ, CNRS, ICR, Marseille, France.
Electronic Supplementary Information (ESI) available: [EPR spectral shape simulations]. See DOI: 10.1039/c9cp04660g
Received 22nd August 2019, Accepted 26th September 2019
DOI: 10.1039/c9cp04660g
www.rsc.org/
Probing the dynamic properties of two sites simultaneously in a
protein-protein interaction process: a SDSL-EPR study
N. Le Breton,a,b S. Longhi,c A. Rockenbauer,d B. Guigliarelli,a S. R. A. Marque,e V. Belle*a and M.
Martinho*a
During molecular processes, protein flexibility is a fundamental property allowing protein-protein interaction. Following structural changes during these interactions is then of crucial interest. Site-Directed Spin Labeling (SDSL) combined to EPR spectroscopy is a powerful technique to follow structural modifications within proteins and during protein-protein interactions. Usual nitroxide labels target cysteine residues and affords a 3-line spectrum, whose shape is informative of the structural environment of the label. However, it is not possible to probe two regions of a protein or two partner proteins at the same time because of overlapping of EPR signatures. Previously, we reported the design and the characterization of a spin label based on a -phosphorylated (PP) nitroxide yielding a 6-line spectrum. Here, we report the use of two labels with different EPR signatures, namely maleimido-proxyl (P) and PP, to follow structural changes during a protein-protein interaction process in one single experiment. As a model system, we chose a disordered protein that undergoes an induced α-helical folding upon binding to its partner. We show that the EPR spectrum of a mixture of labeled interacting proteins can be analyzed in terms of structural changes during the interaction. This study represents an important step forward in the extension of the panoply of SDSL-EPR approaches.
Introduction
Describing molecular recognition and interaction between proteins is central to understand molecular processes governing life. The current view of these processes is that individual proteins, instead of adopting a single rigid structure, are dynamic entities in constant motion, experiencing
structural modifications and having conformational
heterogeneity.1 This fundamental property allows them to
function through molecular interactions with other molecules (either substrates, cofactors or proteins) in a wide range of biological processes, such as enzymatic activity regulation,
signaling mechanisms, and molecular assembly.2
Protein-protein interactions are events that often requires structural flexibility in each partner to enable the association. Allostery is for instance a regulation process that involves protein flexibility in which ligand binding at one site influences binding at another site through a propagated structural change within
the protein.3-4 An extreme example of flexibility is provided by
Intrinsically Disordered Proteins (IDPs), i.e. functional proteins
devoid of a stable structure under physiological conditions of pH and salinity and in the absence of a partner or ligand.5-8
Two mechanisms have been proposed to explain the folding coupled to binding of Intrinsically disordered proteins (IDPs),
i.e. conformational selection and induced-fit mechanisms.9-10
Site-Directed Spin Labeling (SDSL) combined with Electron Paramagnetic Resonance (EPR) spectroscopy is one of the most powerful techniques to obtain information on protein dynamics.11-14 It is widely used to study structural changes
within proteins or reveal interacting regions in protein-protein
interactions.15-16 In particular, SDSL-EPR has been shown to be
sensitive enough to enable mapping induced folding events
within IDPs.17-21 The technique is based on the specific
introduction of a paramagnetic label, usually a nitroxide radical, at a chosen cysteine residue (usually introduced by mutagenesis) and its spectral analysis by EPR. Variations of the EPR spectral shapes reflect changes in the dynamics of the spin label environment revealing structural modifications within the protein. Available commercial nitroxide labels, such as 1-oxyl-2,2,5,5-tetramethyl-pyrroline-methyl (MTSL) or 3-maleimido-2,2,5,5-tetramethyl-1-pyrrolidinyloxy (referred to as P, scheme 1), exhibit typical 3-line spectra, resulting from the hyperfine interaction between the electron spin and the
nuclear spin of the 14N atom (scheme 1). The poor diversity of
these EPR signatures precludes simultaneous study of a protein and its partner during interaction or of two different regions of a same protein. To overcome this limitation, we recently proposed a newly synthesized -phosphorylated nitroxide (referred to as PP, scheme 1) having a phosphorus
ARTICLE PCCP
Please do not adjust margins
atom in the vicinity of the NO group.22 The resulting EPR
spectrum is a 6-line spectrum (doublet of triplet) arising from a supplementary strong hyperfine coupling between the electron spin and the nuclear spin of the 31P atom (I = ½)
(typical averaged values are ĀP = 5.0 mT and ĀN = 1.4 mT). In
that previous study, we demonstrated that PP is as efficient as P in probing different structural environments and in revealing
folding events induced by protein–protein interactions.22
Scheme 1 Chemical structures of nitroxide radicals:
3-maleimido-2,2,5,5-tetramethyl-1-pyrrolidinyloxy (P) and {2-(diethoxyphosphoryl)-5-[(2,5-dioxo-2,5-dihydro-1H-pyrrol-1-yl)methyl]-2,5-dimethylpyrrolidin-1-yl} oxidanyl (PP) and their link to cysteine residues with an illustration of the typical 3- or 6-line EPR signatures.
To go further, the present paper aims at demonstrating that the two P and PP labels can be used together to reveal the structural properties and potential structural modifications of two sites in a single experiment during a protein-protein interaction event. As a model of protein-protein interaction, we used the well-described association of the intrinsically
disordered Cterm region of the Measles virus (MeV)
nucleoprotein (NTAIL, aa 401-525), and the X domain of the viral
phosphoprotein (PXD, aa 459-507).23-25 This biological system
has been extensively studied using many different
approaches,26-30 including SDSL-EPR. The latter, allowed
mapping the -helical induced folding of NTAIL upon interaction
with PXD to residues 488-502, while the other regions of NTAIL
remain highly disordered.17, 31
Fig. 1. Crystal structure of the MeV chimera between PXD (residues 459-507) and the
NTAIL region encompassing residues 486–504 (pdb code 1T6032). Lysine 496 of PXD is
highlighted in red. (a) lateral view and (b) bottom view.
Here, one position on each partner has been chosen for
grafting the paramagnetic label. Within NTAIL, position 407 has
been selected as it is known not to be involved in the interaction with PXD.17 Within PXD, position 496 has been
chosen on the basis of the structure of a chimeric construct
between PXD and the NTAIL region encompassing residues 486–
504 (pdb code 1T60) (Fig. 1).32 In this structure, residue K496 is
pointing toward the -helical NTAIL segment and the label at
this position (after Lys to Cys mutation) is expected to be sensitive to the association of the two partners. The objective of this study is to label each partner alternatively with P and PP spin labels and to determine whether structural information can be deduced from the simulation of the complex spectrum resulting from the mixture of the two labeled interacting proteins.
Results and discussion
EPR spectra analyses of the individual labeled proteins
The NTAIL S407C and PXD K496C variants have been constructed,
expressed and purified to homogeneity. Each variant has been subsequently labeled with either the P or the PP label. The
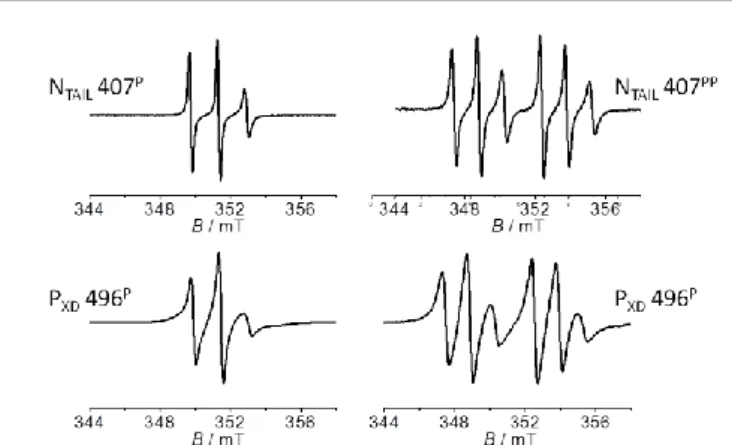
room temperature (RT) EPR spectra of NTAIL S407CP/PP and PXD
K496CP/PP are shown in Figure 2. EPR spectra of NTAIL S407CP/PP
are indicative of a high radical mobility (narrow lines)
consistent with the disordered character of the protein.17 EPR
spectra of PXD K496CP/PP are still in the rapid regime of mobility
of the spin label but show broader lines, in agreement with a label grafted on a structured region and being
solvent-exposed.33 It has to be noted that these EPR spectra reflect the
global mobility of the spin label that contains also a contribution coming from the rotational movement of the protein itself, with this being especially the case for PXD that is
a small protein (~6 kDa).
Fig. 2. Amplitude normalized RT EPR spectra of NTAIL S407CP/PP (upper line) and PXD
K496CP/PP (lower line). Main recording parameters: microwave power 10mW, magnetic
field modulation amplitude 0.1mT.
To go further in the analysis, the EPR spectra were simulated using an extended version of the ROKI software (see experimental section).34 The EPR spectra of NTAIL S407CP/PP can
be simulated by one component with a rotational correlation time C of 0.8 (1) ns and 1.3 (2) ns for NTAIL S407CP and S407CPP
respectively (See Table 1). Details concerning the simulations
referred to as the component 1 (C = 2.6 (4) ns and 2.8 (4) ns
for K496CP and K496CPP respectively) and a broad one (C = 27
(6) ns for K496CP and C = 30 (6) for K496CPP) referred to as the
component 2 (Table 1). The simulated spectra with the decomposition of the two components are given in SI in Fig. S3. The existence of two components can be attributed to two rotameric states of the spin label, each experiencing a unique
environment as already reported in the literature.35-36
Table 1. Rotational correlation time C extracted from the simulation of the RT EPR
spectra of NTAIL S407CP/PP or PXD K496CP/PP using the ROKI software.34 The relative
proportions of each spectral component are given (%).
NTAIL S407CP NTAIL S407CPP PXD K496CP PXD K496CPP c (ns) 0.8(1) 1.3(2) 2.6(4) 27(6) 2.8(4) 30(6) % 100 100 45(5) 55(5) 45(5) 55(5)
EPR spectra analysis of mixtures of the labeled proteins
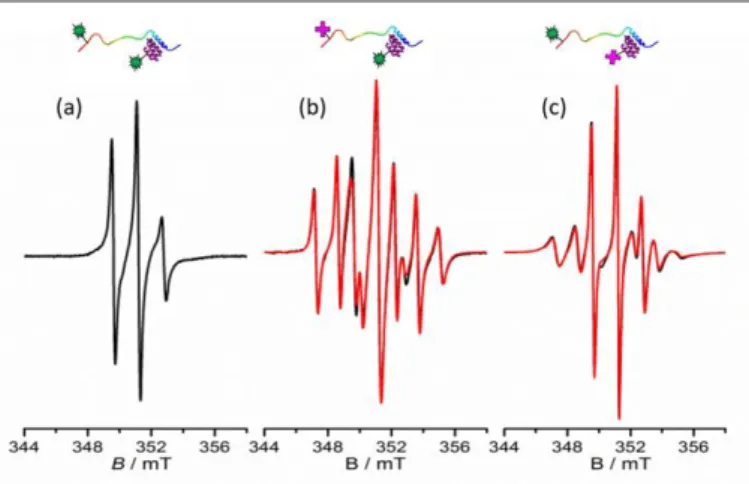
The labeled species were mixed in a 1:1 ratio to ensure that none of the EPR signal dominates the other. Fig. 3 shows the EPR spectra resulting from the mixture of the different possible combinations. Mixing NTAILP with PXDP led to a 3-line
spectrum (mixture 1, Fig. 3a) in which it is impossible to distinguish the individual signature of each labeled protein. Even if the simulation can be obtained, it is not possible to attribute without ambiguity one component to one site, especially if there are spectral shape modifications resulting from the interacting proteins. This resulting spectrum shows the limitation of the use of classical spin labels for probing two sites simultaneously. In this case, no information can be derived from the mixture of these two labeled species. On the contrary, interaction between NTAILPP and PXDP (mixture 2, Fig.
3b) or NTAILP and PXDPP (mixture 3, Fig. 3c) gives rise to a
complex EPR spectrum in which the two EPR signatures arising from P and PP are partially overlapping but still distinguishable (Fig. S4). The fact that the individual signatures can be distinguished enables the simulation of the whole spectrum.
Fig 3. RT EPR spectra of equimolar mixtures of (a) mixture 1: NTAIL S407CP and PXD
K496CP, (b) mixture 2: N
TAIL S407CPP and PXD K496CP, (c) mixture 3: NTAIL S407CP and PXD
K496CPP. The spectra shown in panels (b) and (c) have been simulated using the ROKI
Table 2 summarizes the results of the simulation of each composite spectrum. The decomposition of each simulated spectra are given in SI in Fig. S5. For the position 407 of NTAIL (P
and PP) the same parameters as those determined in the
absence of PXD were found (Table 1). This result confirms that
this NTAIL region is unaffected by NTAIL:PXD complex formation
and that it fully retains its disordered character. On the contrary, concerning PXD, the values of c are different from
the ones found with PXD alone. The two components attributed
to different rotameric states of the labels are still present but the values of c increase (from 2.6-2.8 to 5.1-5.2 ns for
component 1 and from 27-30 to 50 ns for component 2). Note that the proportion of component 1 with respect to
component 2 is significantly different in the case of PXD
K496CPP bound to NTAIL (25%/75%) compared to PXD K496CPP
alone (Table 1) or to PXD K496CP in complex (Table 2). This
difference is probably due to the reorientation of the PP label in the complex. For both composite spectra, the increased values of c for the labels at position 496 of PXD reveal that this
site is part of the interaction site between NTAIL and PXD as
expected from the structure of the chimera construct (Fig. 1).32
Note that the reliability of this structural model, obtained using an artificial chimeric construct, has already been
validated by our previous SDSL-EPR results.17
Table 2. Rotational correlation time C extracted from the simulation of the RT EPR
spectra of NTAIL S407CP/PP in the presence of PXD K496CP/PP, using the ROKI software.34
The relative proportions of each spectral component are given (%).
Mixture 2 Mixture 3
NTAIL S407CPP PXD K496CP NTAIL S407CP PXD K496CPP
c (ns) 0.8(1) 5.1(4) 50(8) 1.3(2) 5.2(4) 50(8)
% 100 60(5) 40(5) 100 75(5) 25(5)
Simulation of EPR spectra of the mixture of NTAIL S407CP/PP and
PXD K496CP/PP can then be achieved, giving simultaneous
structural information during protein-protein interaction. Thus, the combined use of these two different nitroxide labels with different EPR signatures gives the opportunity to follow structural changes on two proteins at the same time. It should be mentioned that, as PP has a broader spectral width compared to P, the detection of PP grafted to a protein requires higher protein concentrations. Another limitation can arise from the high complexity of the resulting spectrum (6+3 lines) that may, in some cases, be too difficult to simulate if the 3-lines overlap too much the 6-lines.
Experimental
ChemicalsUnless otherwise noted, all chemicals and solvents were of analytical grade and used without further purification.
ARTICLE PCCP
Please do not adjust margins
The synthesis and full characterization of PP has been already described.22
Protein expression and purification
The cysteine-substituted NTAIL variant was prepared as
previously described.17, 31 Expression and purification of the
cystein-substituted PXD variant was prepared as already
described,26 except that a washing step with 2 M NaCl was
added prior to elution from the immobilized metal affinity chromatography (IMAC) column and that a nickel resin was used instead of cobalt resin.30 Protein concentrations were
calculated using OD280 measurements and the theoretical
absorption coefficients ε (mg/mL.cm) at 280 nm, as obtained using the program ProtParam from the ExPASy server.
Labeling procedures
Before spin labeling, dithiothreitol (DTT) was added to the
purified variant (NTAIL S407C and PXD K496C) (approximately 1.5
mg) in a molar excess of 100. The mixture was incubated for 30 min in an ice bath to reduce the unique free cysteine residue. DTT was removed by a PD10 desalting column (GE Healthcare) using 10 mM MES, 150 mM NaCl pH 6.5 as elution buffer. The fractions containing the protein were pooled. Spin labels were immediately added to the sample at a molar excess of 10 using a spin label (P or PP) stock solution at 40 mM in acetonitrile. The reaction was carried out for 1 h in the dark in an ice bath, under gentle stirring and a continuous flow of argon to avoid oxidation. The excess of unbound spin label was removed by gel filtration as described above, except that 10 mM sodium phosphate pH 7.0 was used as elution buffer. The fractions giving an EPR signal, reflecting effective protein labeling, were pooled and concentrated by ultrafiltration using a 5 kDa cutoff polyethersulfone membrane (Vivaspin, Sartorius) in the case of the NTAIL variant, and a 3kDa cutoff Millipore Ultracell
low-binding regenerated cellulose membrane (Amicon, Millipore) for the PXD variant. In the case of the PXD K496C variant, the
best yield (for both P and PP) was obtained when labeling was conducted in a glove box. Labeling yields were calculated by dividing the spin concentration over the protein concentration. Labeling yields obtained for NTAIL S407CP was around 100%
whereas for NTAIL S407CPP only 50% was achieved. For PXD
K496CP/PP labeling yields ranged from 90 to 100 %.
EPR spectroscopy
EPR spectra were recorded at room temperature on an ELEXSYS E500II Bruker spectrometer equipped with an ELEXSYS Super High Q sensitivity resonator operating at 9.9 GHz. The microwave power was 10 mW, the magnetic field modulation frequency and amplitude were 100 kHz and 0.1 mT, respectively. The concentration of labeled proteins was evaluated by double integration of the EPR signal recorded under non-saturating conditions and comparison with that given by a MTSL standard sample. Protein concentrations were
either calculated using OD280 measurements and the
theoretical absorption coefficients ε (mg/mL.cm) at 280 nm, as obtained using the program ProtParam at the ExPASy server,
or measured using the Biorad protein assay (Bio-Rad Laboratories, Hercules, CA). The labeling yields were estimated by calculating the ratio between the concentration of labeled proteins and the total protein concentration. Labeling yields ranged from 50 to 100 %. Protein concentrations of 50 μM were used to record individual EPR spectra. All spectra were recorded at RT, from protein samples in 10 mM sodium phosphate at pH 7.0.
EPR spectral shape simulations
EPR spectra of individual variants labeled with PP or P were
simulated using an extended version of the ROKI software.34
For the simulation of the spectra of mixtures of NTAIL S407C
and PXD K496C labeled with P or PP, 3 components (one
narrow for NTAIL S407CP/PP and one broad and one narrow for
PXD K496CP/PP) were added so as to obtain the best fit to
experimental data.
Conclusions
The aim of this study is to simultaneously (i.e. in one single experiment) follow and analyze structural changes within two
proteins involved in a protein-protein interaction.
Conventional SDSL-EPR approaches are limited due to the poor diversity of the EPR signatures of nitroxide radicals (3-line spectra). To overcome this limitation, we proposed to combine the use of two different spin labels having two distinct EPR signatures: a conventional nitroxide (maleimido proxyl P) and a phosphorylated one (PP). By choosing a well-described of protein-protein interaction model system, we show that the composite spectrum resulting from the mixture of the two labeled interacting partners can be analyzed only if P is grafted on one site and PP on the other. On the contrary, if P is the label for the two sites, the mixture leads to a spectrum that cannot be analysed due to a too important overlap of the two signals. P and PP are both nitroxide spin labels designed to target cysteine residues, which precludes their combined use to explore two sites of a same protein simultaneously. Our recent development of nitroxide targeting tyrosine residues
opens the perspective to overcome this limitation.37-39 The
combination of these approaches (targeting different residues,
i.e. cysteine and tyrosine, and using two different nitroxide
labels to target these residues) opens up new perspectives to follow structural changes within proteins. Additionally, the method can be extended to the study of other types of interactions between biomolecules such as protein-RNA or RNA-RNA interactions, with the latter case though requiring the synthesis of appropriate phosphorytated nitroxides. To conclude, this study constitutes a new step in the enlargement of the panoply of SDSL-EPR approaches.
Acknowledgements
This work was supported by the Agence Nationale de la Recherche ANR SPINFOLD n° 09-BLAN-0100, the Centre National de la Recherche Scientifique (CNRS) and Aix-Marseille
Aix-Marseille Université EPR center. The authors also wish to acknowledge David Blocquel (AFMB lab) for technical help during the purification of the NTAIL S407C and PXD K496C
variants. NLB is grateful to Aix Marseille Université and PACA region for her PhD fellowship. We acknowledge the support of the Hungarian National Research, Development and Innovation Office (NKFTH) Grant (K119442).
Conflicts of interest
There are no conflicts to declare.
References
1. K. Henzler-Wildman; D. Kern, Nature, 2007, 450 (7172), 964-972.
2. K. Teilum; J. G. Olsen; B. B. Kragelund, Cell. Mol. Life Sci., 2009,
66 (14), 2231-2247.
3. K. Gunasekaran; B. Y. Ma; R. Nussinov, Proteins: Struct. Funct.
Bioinf., 2004, 57 (3), 433-443.
4. N. M. Goodey; S. J. Benkovic, Nature Chemical Biology, 2008, 4 ( 8), 474-482.
5. T. Chouard, Nature, 2011, 471 (7337), 151-153.
6. M. M. Babu; R. van der Lee; N. S. de Groot; J. Gsponer, Curr.
Opin. Struct. Biol., 2011, 21 (3), 432-440.
7. V. N. Uversky; A. K. Dunker, BBA-Proteins Proteom., 2010, 1804
( 6), 1231-1264.
8. P. Tompa, Trends Biochem. Sci., 2002, 27 (10), 527-33.
9. J. Habchi; P. Tompa; S. Longhi; V. N. Uversky, Chem. Rev., 2014,
114 (13), 6561-6588.
10. P. Csermely; R. Palotai; R. Nussinov, Trends in Biochemical
Sciences, 2010, 35 (10), 539-546.
11. E. Bordignon; S. Bleicken, BBA-rev Biomembranes, 2018, 1860 (4), 841-853.
12. W. L. Hubbell; C. J. Lopez; C. Altenbach; Z. Y. Yang, Curr. Opin.
Struct. Biol., 2013, 23 (5), 725-733.
13. J. P. Klare; H. J. Steinhoff, In Structural Information from
Spin-Labels and Intrinsic Paramagnetic Centres in the Biosciences,
Timmel, C. R.; Harmer, J. R., Eds. 2014; Vol. 152, pp 205-248. 14. M. Martinho, Fournier, E., Le Breton, N., Mileo, E. and Belle V.,
In Electron Paramagnetic Resonance, Chechik, V., Murphy, D., Ed. Royal Society of Chemistry: 2019; Vol. 26, pp 66-88. 15. M. Lorenzi; L. Sylvi; G. Gerbaud; E. Mileo; F. Halgand; A.
Walburger; H. Vezin; V. Belle; B. Guigliarelli; A. Magalon, PloS
one, 2012, 7 (11), 10.1371/journal.pone.0049523.
16. V. Belle; A. Fournel; M. Woudstra; S. Ranaldi; F. Prieri; V. Thomé; J. Currault; R. Verger; B. Guigliarelli; F. Carrière,
Biochemistry, 2007, 46 (8), 2205-2214.
17. V. Belle; S. Rouger; S. Costanzo; E. Liquière; J. Strancar; B. Guigliarelli; A. Fournel; S. Longhi, Proteins: Struct. Funct. Bioinf., 2008, 73 (4), 973-988.
18. N. L. Pirman; E. Milshteyn; L. Galiano; J. C. Hewlett; G. E. Fanucci, Protein Sci., 2011, 20 (1), 150-159.
19. M. Martinho; J. Habchi; Z. El Habre; L. Nesme; B. Guigliarelli; V. Belle; S. Longhi, J. Biomol. Struct. Dyn., 2013, 31 (5), 453-471.
21. M. Palombo; A. Bonucci; E. Etienne; S. Ciurli; V. N. Uversky; B. Guigliarelli; V. Belle; E. Mileo; B. Zambelli, Sci. Rep., 2017, 7 (1), 5977.
22. N. Le Breton; M. Martinho; K. Kabytaev; J. Topin; E. Mileo; D. Blocquel; J. Habchi; S. Longhi; A. Rockenbauer; J. Golebiowski; B. Guigliarelli; S. R. A. Marque; V. Belle, Phys. Chem. Chem.
Phys., 2014, 16 (9), 4202-4209.
23. J. M. Bourhis; V. Receveur-Bréchot; M. Oglesbee; X. Zhang; M. Buccellato; H. Darbon; B. Canard; S. Finet; S. Longhi, Protein Sci., 2005, 14, 1975-1992.
24. D. Karlin; S. Longhi; B. Canard, Virology, 2002, 302 (2), 420-32. 25. S. Longhi; V. Receveur-Brechot; D. Karlin; K. Johansson; H.
Darbon; D. Bhella; R. Yeo; S. Finet; B. Canard, J. Biol. Chem., 2003, 278 (20), 18638-48.
26. J. Bourhis; K. Johansson; V. Receveur-Bréchot; C. J. Oldfield; A. K. Dunker; B. Canard; S. Longhi, Virus Research, 2004, 99, 157-67.
27. J. Habchi; S. Blangy; L. Mamelli; M. R. Jensen; M. Blackledge; H. Darbon; M. Oglesbee; Y. L. Shu; S. Longhi, J. Biol. Chem., 2011,
286 (15), 13583-13602.
28. J. Habchi; S. Longhi, Mol. Biosys., 2012, 8 (1), 69-81.
29. C. G. Bischak; S. Longhi; D. M. Snead; S. Costanzo; E. Terrer; C. H. Londergan, Biophysical Journal, 2010, 99 (5), 1676-1683. 30. D. Blocquel; J. Habchi; S. Costanzo; A. Doizy; M. Oglesbee; S.
Longhi, Protein Science, 2012, 21 (10), 1577-1585.
31. B. Morin; J. M. Bourhis; V. Belle; M. Woudstra; F. Carrière; B. Guigliarelli; A. Fournel; S. Longhi, J. Phys. Chem. B, 2006, 110 (41), 20596-20608.
32. R. L. Kingston; D. J. Hamel; L. S. Gay; F. W. Dahlquist; B. W. Matthews, Proc. Natl. Acad. Sci. USA, 2004, 101 (22), 8301-6. 33. H. S. Mchaourab; M. A. Lietzow; K. Hideg; W. L. Hubbell,
Biochemistry, 1996, 35 (24), 7692-704.
34. A. Rockenbauer; L. Korecz, Appl. Magn. Reson., 1996, 10 (1-3), 29-43.
35. Z. F. Guo; D. Cascio; K. Hideg; W. L. Hubbell, Protein Sci., 2008,
17 (2), 228-239.
36. Z. F. Guo; D. Cascio; K. Hideg; T. Kalai; W. L. Hubbell, Protein Sci., 2007, 16 (6), 1069-1086.
37. M. Lorenzi; C. Puppo; R. Lebrun; S. Lignon; V. Roubaud; M. Martinho; E. Mileo; P. Tordo; S. R. A. Marque; B. Gontero; B. Guigliarelli; V. Belle, Angew. Chem. Int. Edit., 2011, 50 (39), 9108-9111.
38. E. Mileo; E. Etienne; M. Martinho; R. Lebrun; V. Roubaud; P. Tordo; B. Gontero; B. Guigliarelli; S. R. A. Marque; V. Belle,
Bioconj. Chem., 2013, 24 (6), 1110-1117.
39. C. Gmeiner; D. Klose; E. Mileo; V. Belle; S. R. A. Marque; G. Dorn; F. H. T. Allain; B. Guigliarelli; G. Jeschke; M. Yulikov, J.