of
Picea abies
1
Stefan Mayr*, Herve´ Cochard, Thierry Ame´glio, and Silvia B. Kikuta
Institut fu¨r Botanik, Universita¨t Innsbruck, A–6020 Innsbruck, Austria (S.M.); University of
Natural Resources and Applied Life Sciences, Department of Integrative Biology, Institute of Botany, A–1180 Vienna, Austria (S.B.K.); and Unite´ Mixte de Recherche Physiologie Inte´gre´e de l’Arbre Fruitier et Forestier, Institut National de la Recherche Agronomique/Universite´ Blaise Pascal, Site de Crouelle, 63039 Clermont-Ferrand, France (H.C., T.A.)
Freeze-thaw events can cause embolism in plant xylem. According to classical theory, gas bubbles are formed during freezing and expand during thawing. Conifers have proved to be very resistant to freeze-thaw induced embolism, because bubbles in tracheids are small and redissolve during thawing. In contrast, increasing embolism rates upon consecutive freeze-thaw events were observed that cannot be explained by the classical mechanism. In this study, embolism formation during freeze-thaw events was analyzed via ultrasonic and Cryo-scanning electron microscope techniques. Twigs of Picea abies L. Karst. were subjected to up to 120 freeze-thaw cycles during which ultrasonic acoustic emissions, xylem temperature, and diameter varia-tions were registered. In addition, the extent and cross-sectional pattern of embolism were analyzed with staining experiments and Cryo-scanning electron microscope observations. Embolism increased with the number of freeze-thaw events in twigs previously dehydrated to a water potential of 22.8 MPa. In these twigs, acoustic emissions were registered, while saturated twigs showed low, and totally dehydrated twigs showed no, acoustic activity. Acoustic emissions were detected only during the freezing process. This means that embolism was formed during freezing, which is in contradiction to the classical theory of freeze-thaw induced embolism. The clustered pattern of embolized tracheids in cross sections indicates that air spread from a dysfunctional tracheid to adjacent functional ones. We hypothesize that the low water potential of the growing ice front led to a decrease of the potential in nearby tracheids. This may result in freezing-induced air seeding.
Freeze-thaw events are one of two major factors that can induce embolism in plant xylem. According to a frequently published theory, embolism formation oc-curs during thawing when bubbles enclosed in the conduits expand. These bubbles are formed during freezing when air, which is hardly soluble in ice, is forced from the xylem sap. Whether a bubble expands during thawing depends on sap surface tension, sap water potential (c), and bubble size (Sucoff, 1969; Ewers, 1985; Lo Gullo and Salleo, 1993; Davis et al., 1999; Lemoine et al., 1999; Hacke and Sperry, 2001; Sperry and Robson, 2001; Pittermann and Sperry, 2003). Therefore, the risk of embolism increases with the conduit diameter, because wide elements contain large amounts of dissolved gas that forms big bubbles within the ice (Davis et al., 1999; Sperry and Robson, 2001; Pittermann and Sperry, 2003, 2006).
Drought stress is the second important mechanism inducing embolism (Sperry and Tyree, 1990; Tyree et al., 1994; Hacke and Sperry, 2001). When c in conduits falls below xylem-specific thresholds, air can enter from adjacent, already air-filled spaces (air seed-ing; Tyree and Zimmermann, 2002). This usually occurs at the pits that determine the vulnerability threshold of the xylem (Tyree et al., 1994; Hacke and Sperry, 2001; Hacke et al., 2004; Sperry and Hacke, 2004; Pittermann et al., 2005). At c less negative than the air-seeding threshold, the surface tension of water stabilizes air-water interfaces in the pores of pit membranes in an-giosperms. In conifers, a special pit anatomy with a central thickening, the torus, functions as a valve-like mechanism sealing the pit at critical c gradients.
Drought stress has been shown to cause embolism in many angiosperm and conifer species. In contrast, conifers were reported to be very resistant to freeze-thaw induced embolism due to the narrow tracheids found in most species. No embolism upon freezing and thawing was found in experiments with Thuja occidentalis, Picea glauca, and Pinus sylvestris (Sucoff, 1969), Tsuga canadiensis (Hammel 1967), P. glauca, Larix laricina, and Abies lasiocarpa (Sperry et al., 1994; Davis et al., 1999), Diselma archeri, Podocarpus lawrencei, and Phyllocladus aspleniifolius (Feild and Brodribb, 2001), and only low embolism rates in Juniperus scopulorum (Sperry and Sullivan, 1992). All these studies were based on single freeze-thaw events, and samples were 1This work was supported by the Fonds zur Fo¨rderung der
Wissenschaftlichen Forschung (project P15923–B03), by the Austrian Program for Advanced Research and Technology, and by Amade´e 2004–2005 (Scientific-Technical Cooperation France-Austria).
* Corresponding author; e-mail [email protected]; fax 0043– 512–507–2715.
The author responsible for distribution of materials integral to the findings presented in this article in accordance with the policy described in the Instructions for Authors (www.plantphysiol.org) is: Stefan Mayr ([email protected]).
www.plantphysiol.org/cgi/doi/10.1104/pp.106.085704
dehydrated to moderate c. In a recently published study, Pittermann and Sperry (2006) showed that coni-fers were vulnerable to freeze-thaw induced embolism when c in the xylem sap was low and that vulnera-bility thresholds corresponded to tracheid diameter.
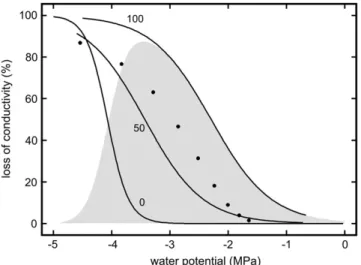
There are several field studies reporting freeze-thaw induced embolism in conifers such as P. glauca, L. laricina, and A. lasiocarpa (Sperry and Sullivan, 1992; Sperry et al., 1994), Pinus contorta (Sparks et al., 2001), and Picea abies (Mayr et al., 2002, 2003b). The latter study was carried out at the alpine timberline where up to 130 freeze-thaw events per winter (Groß et al., 1991; Mayr et al., 2003a, 2003b, 2006) and frost drought (Michaelis, 1934; Pisek and Larcher, 1954; Larcher, 1972; Tranquillini, 1976, 1980) with extremely low c (Mayr et al., 2003a, 2003b) occur. The conditions at the alpine timberline led to conductivity losses of up to 100%, while in the studies of Sperry et al. (1994) as well as Sparks et al. (2001), relatively low embolism rates were observed. In these studies, C reached moderately negative values during winter that hardly exceeded summer values. Thus, it was assumed that the combi-nation of low c and repeated freeze-thaw cycles causes high embolism rates in conifers growing at harsh hab-itats. This assumption was verified in an experiment with young Norway spruce trees, which were dehy-drated to various c and then exposed to 50 and 100 freeze-thaw cycles in a climate chamber (Mayr et al., 2003a). As shown in Figure 1, freeze-thaw events scarcely caused embolism at moderate c but caused high conductivity losses near the upper drought-induced vulnerability threshold. At lower c, the xylem was already impaired by drought-induced embolism, and
freeze-thaw events contributed only a little to the overall conductivity losses. Embolism rates reached after 100 temperature cycles were higher than after 50 cycles.
One aspect of this experiment cannot be explained by the classical theory of freeze-thaw induced embo-lism; the risk of embolism induction in the wood did not increase during the experiment, as neither tracheid diameter nor sap surface tension varied (c even be-came slightly less negative; Mayr et al., 2003a). Despite these constant conditions, bubbles dissolved in most tracheids during the first thawing event but did not do so during one of the consecutive freeze-thaw cycles. One explanation may be that the whole process was to some extent a statistical one and that the cumulative probability for embolism in a conduit increased with each temperature cycle. However, it seems unlikely that the probability for all tracheids is similar so that 100% loss of conductivity can be reached. It is also interesting that the data of Mayr et al. (2003a) do not fit to the model described in Pittermann and Sperry (2006). Calculating the vulnerability thresholds based on the tracheid diameter distribution given in Mayr et al. (2003a), embolism rates are higher than the mea-sured conductivity losses after 50 freeze-thaw cycles but lower than after 100 cycles (Fig. 1). It also has to be noticed that high embolism rates at the timberline were only registered after numerous freeze-thaw events even when c was already very low during the first frost events (Mayr et al., 2003b).
The aim of this study was to gain more insight into the process of embolism formation during freeze-thaw events in conifer wood. We compared twigs of P. abies dehydrated to c near the upper vulnerability thresh-old with twigs totally dehydrated or fully saturated. As shown in Figure 1, we expected pronounced effects in the former but no effects in the latter samples (con-trols) upon freeze-thaw cycles. The twigs were exposed to consecutive freeze-thaw cycles, and cavitation events were registered with the ultrasonic technique. Embolism patterns in xylem cross sections were ana-lyzed with a scanning electron microscope (Cryo-SEM). According to the classical theory of freeze-thaw in-duced embolism, acoustic emissions should occur dur-ing thawdur-ing and the widest tracheids should cavitate first.
RESULTS Dye Experiments
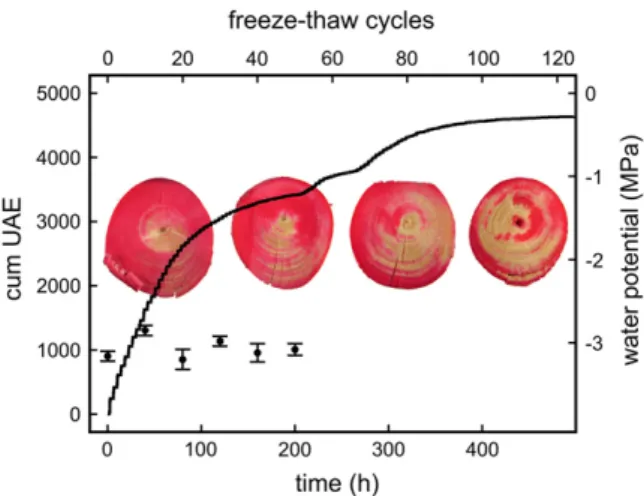
Phloxine B staining of samples dehydrated to a c of 22.8 MPa showed embolism rates to increase with increasing numbers of freeze-thaw cycles (Fig. 2). Within the cross sections, compression wood regions tended to reach higher embolism rates.
c
c measured after 10, 20, 30, and 50 temperature cycles did not differ significantly (Fig. 2).
Figure 1. Loss of conductivity in twigs of P. abies dehydrated to various cand exposed to 0, 50, and 100 freeze-thaw cycles (modified after Mayr et al., 2003a). The gray area gives the difference between the treatment with 100 and 0 freeze-thaw cycles, thus showing the effect of the freeze-thaw processes. Black circles indicate the vulnerability to freeze-thaw cycles according to the model of Pittermann and Sperry (2006). Model calculations were based on the tracheid cross-sectional area distribution given in Mayr et al. (2003a).
Ultrasonic Acoustic Emissions
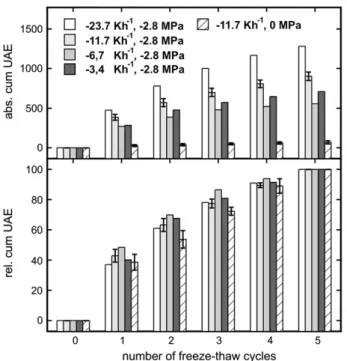
Freeze-thaw treatment of samples with a c of 22.8 MPa caused frequent ultrasonic acoustic emissions (UAE) even after more than 100 temperature cycles, the number of signals detected per cycle decreasing slowly (Fig. 2). Based on a parabolic function, a sig-nificant correlation between the number of tempera-ture cycles and the cumulative number of UAE was observed. Within a temperature cycle, UAE were reg-istered only during the freezing process, leading to a stepwise increase of the cumulative signal number during consecutive freeze-thaw cycles (Fig. 3). Mea-surements of the xylem temperature showed that the onset of acoustic emissions corresponded exactly to the start of the freezing process as indicated by the freezing exotherms. In contrast to samples at a c of 22.8 MPa, completely dehydrated samples emitted no, and saturated samples only few, acoustic signals (Fig. 3). However, even these few emissions occurred stepwise. No significant correlation between absolute number of UAE and cooling rates ranging from 23.7 to 3.4 Kh21 was found (Fig. 4), although acoustic activity was highest at 23.7 Kh21. The relative number of cumulative acoustic emissions (related to the number of signals after five temperature cycles that was set as 100%) was similar regardless of the rate of temperature changes (Fig. 4). Even the few signals emitted from saturated samples followed this course. The parabolic correlation of the number of temperature cycles and the relative number of UAE was statistically significant.
Diameter Variations
Diameter changes in samples with a c of 22.8 MPa were about 40 mm/temperature cycle (Fig. 5). Diam-eter decreased during each freezing process and
increased during the consecutive thawing. Mean di-ameter decreased for about 35 mm during the course of 10 temperature cycles.
Cryo-SEM Analysis
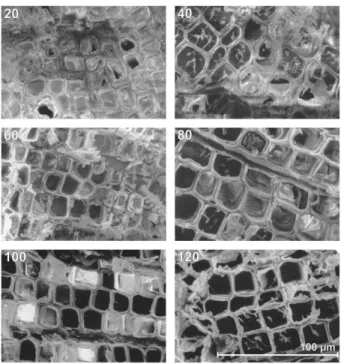
The number of embolized tracheids increased with the number of freeze-thaw cycles (Fig. 6; significant correlation). While after 20 cycles only a few empty tracheids were found, most tracheids were embolized after 120 cycles. Within the cross sections, these embolized tracheids were not distributed randomly but grouped in clusters. Cluster size tended to increase with the number of freeze-thaw cycles (no significant correlation). In some samples, we observed a clear tangential orientation of the clusters (Fig. 7).
DISCUSSION
‘‘The failure of freezing to produce blockage is among the few remaining questions about water trans-port not satisfactorily explained by the theory’’ (stated by Sucoff [1969]; p. 424). Meanwhile, many studies were performed dealing with the mechanism of freeze-thaw induced embolism and the remarkable resistance of many conifers. The ultrasonic and Cryo-SEM anal-yses of this study demonstrate that there are probably many aspects still poorly understood and many un-solved questions remaining.
Are ultrasonic signals emitted during freeze-thaw cycles related to embolism formation? This is the first and basic question one might ask considering the large number of emissions observed in samples with a c of 22.8 MPa during repeated freeze-thaw cycles (Fig. 2). We think that in fact UAE were related to embo-lism formation for the following reasons: repeated
Figure 2. Cumulative UAE of a P. abies twig dehydrated to a c of 22.8 MPa and exposed to 120 freeze-thaw cycles. Photos in the background show Phloxine B staining experiments. The conducting areas within the cross sections of twigs subjected to 0, 40, 80, and 120 freeze-thaw cycles appear in red. In addition, the course of c in twigs at about 23.2 MPa during 50 freeze-thaw cycles is given (black circles; mean 6SE).
Figure 3. Cumulative UAE of P. abies twigs exposed to five freeze-thaw cycles. Prior to temperature treatment, twigs were either dehydrated to a c of 22.8 MPa, saturated (sat.), or dehydrated (dry). The dashed line indicates xylem temperature during freeze-thaw cycles, the vertical line demonstrates that UAE started exactly when the freezing exotherm was registered.
freeze-thaw cycles led to increasing conductivity losses, as shown by Mayr et al. (2003a) and the dye experi-ments (Fig. 2) as well as Cryo-SEM analysis (Fig. 6) of this study. The increase of the cumulative number of UAE (Fig. 2) clearly corresponded to these increas-ing embolism rates. Furthermore, saturated samples emitted only few, and totally dehydrated samples no,
ultrasonic signals at all during freeze-thaw treatment, which is consistent with our findings presented in Mayr et al. (2003a). Figure 1 shows that in samples at moderate c, embolism upon freeze-thaw events is formed only on a small scale. At very low c, the xylem is already completely embolized by air seeding pro-cesses so that no additional embolism can occur. In contrast, large effects have to be expected near the upper drought-induced vulnerability threshold as at 22.8 MPa in the analyzed samples. Unfortunately, conductivity measurements in conifers are difficult (low specific conductivity and troublesome sample preparation due to resin) and therefore too imprecise to find a relation between ultrasonic activity and conductivity loss after only one freeze-thaw cycle.
The conclusion that acoustic emissions during freeze-thaw events were based on embolism formation is of special interest when the time course of the ultrasonic events is analyzed. As shown in Figure 3, signals were registered only during freezing but not during thawing. Weiser and Wallner (1988) also observed ultrasonic emissions during the freezing process in Fraxinus americana, Malus 3 Doigo, Pyrus communis, Fraxinus pennsylvanica, Pinus edulis, Pinus ponderosa, and Cornus sericea. The authors reported that fully dehydrated samples did not produce acoustic emissions. Kikuta and Richter (2003) detected acoustic emissions during freezing in Juglans regia and Evony-mus latifolia, whereby saturated samples produced fewer signals than samples at field c. In Eucalyptus cinerea seedlings, signals were emitted only after freez-ing but not durfreez-ing thawfreez-ing (Raschi et al., 1989). The maximum number of events was recorded at the mini-mum temperature of 28°C. The authors concluded that the increase in ultrasonic signals was related to dehydration caused by formation of extracellular ice. The study of Raschi et al. (1989) indicated ultrasonic activity to start with the occurrence of the freezing exotherm. Weiser and Wallner (1988) demonstrated an
Figure 4. Absolute UAE and relative number of cumulative UAE in P. abies twigs fully saturated or dehydrated to a c of 22.8 MPa and subjected to five freeze-thaw cycles. Twigs at 22.8 MPa were exposed to cooling rates of 23.7, 11.7, 6.7, and 3.4 Kh21. For the calculation of
relative cumulative UAE, the number of absolute cumulative UAE after five temperature cycles was set as 100%. For the standard experiment (11.7 Kh21cooling rate; n 5 4) and for saturated twigs (n 5 3), mean 6 SEare given.
Figure 5. Cumulative UAE of a P. abies twig dehy-drated to a c of 22.8 MPa and exposed to 10 freeze-thaw cycles (solid line). Variations in twig diameter (dashed line) were registered with LVDT sensors.
increase in acoustic activity during the whole freezing period so that the scaling of their graphs does not allow an exact determination of the onset of acoustic events. Kikuta and Richter (2003) reported increasing acoustic activity with temperature continuously de-creasing to 225°C. Signal production in nonsaturated rachides of walnut (J. regia) started with the freezing exotherm (S.B. Kikuta, personal communication).
In the experiments presented, the number of acous-tic emissions per freezing event decreased (Figs. 2, 3, and 5). This pattern was independent of the cooling rate (velocity of temperature change) as demonstrated in Figure 4. Highest absolute numbers of UAE were observed at a cooling rate of 223.7 Kh21; at lower rates, no significant trend was found (Fig. 4). The interpretation of absolute numbers of acoustic emis-sions is still a problematic aspect of the ultrasonic technique. Some factors like the acoustic coupling (e.g. clamping force and contact area of the sensor) or temperature-dependent changes in signal attenuation could not be controlled in our experiments.
Several aspects of this study are in clear contradic-tion to the classical theory of freeze-thaw induced embolism. First, the ultrasonic, dye, and Cryo-SEM analyses (Figs. 2 and 6) demonstrated an increase in embolism rates during repeated freeze-thaw events. As mentioned in the introduction, there is no reason why a tracheid should be resistant to freeze-thaw induced embolism during the first, but not during one of the consecutive, temperature cycles (see Mayr et al., 2003a). It is important to notice that the increase in cumulative acoustic emissions was not caused by an
increase in c, because no significant change in c was measured during 50 freeze-thaw cycles (Fig. 2). Fur-thermore, decreasing acoustic activities (Fig. 4) do not indicate an increase in stress intensities. Mayr et al. (2003a) reported that c even slightly increased during consecutive freeze-thaw cycles, while embolism for-mation still went on.
Second, ultrasonic signals clearly indicate that em-bolism formation occurs during freezing and not dur-ing thawdur-ing (see above). Many authors assumed the thaw process to be the critical one (Sucoff, 1969; Davis et al., 1999; Hacke and Sperry, 2001; Pittermann and Sperry, 2003, 2006). On the other hand, the lack of embolism formation during thawing may be interpre-ted as an aspect consistent with the classical theory. Because of the small tracheid diameter, one cannot expect embolism formation by bubble expansion dur-ing thawdur-ing.
Third, the Cryo-SEM analysis (Fig. 6) revealed clus-tered areas of embolized tracheids, whereby not only the largest conduits appeared to be air filled. Accord-ing to the classical theory, the widest tracheids are considered to be most vulnerable and therefore em-bolize first. In contrast, small air-filled tracheids were found adjacent to bigger, still functional tracheids (Fig. 2). Furthermore, the number of tracheids within em-bolized clusters tended to increase with increasing numbers of freeze-thaw cycles. This indicates that air spread from one tracheid to neighboring conduits and tracheids did not embolize independently from each other. This is also supported by the finding of large, tangential-oriented clusters in some of the cross sec-tions (Fig. 7). This pattern could be related to the distribution of the pits that are situated mainly in the radial cell walls.
These findings lead to what is probably the most interesting question: which mechanism may be the basis for the observed processes? Kikuta and Richter (2003) proposed that cavitation events (the first ex-pansion of bubbles causing ultrasonic emissions)
Figure 6. Cryo-SEM analysis of P. abies twigs dehydrated to a c of 22.8 MPa and exposed to consecutive freeze-thaw cycles. The number of freeze-thaw cycles is indicated at the top of each photo. In cross sec-tions, empty tracheids appear black, while intact tracheids are ice filled.
Figure 7. Cross section of P. abies twigs dehydrated to a c of 22.8 MPa and exposed to 60 freeze-thaw cycles. Embolized tracheids are marked by white crosses.
might occur during freezing while embolism (the complete filling of tracheids with air) is formed during thawing. Results of this study neither support nor contradict this hypothesis. We think that another com-ponent should be considered: the c of ice. Ame´glio et al. (2001) demonstrated water movement within stems or twigs driven by the extremely low c of ice. During freezing, water is shifted to extracellular spaces of bark and wood, leading to shrinkage of the axes. During thawing, water moves back to tracheids and living cells. In samples of our study, a small decrease in mean diameter during consecutive freeze-thaw cycles was found (Fig. 5). This indicates that some water was irreversibly trapped in extracellular spaces during freezing.
Shrinkage upon freezing was already suggested by Hoffmann (1857) and Sachs (1860). In J. regia, about 15% of the shrinkage occurred in the wood, while bark thickness caused 85% of the changes in intact stems (Ame´glio et al., 2001). Also, Zweifel and Ha¨sler (2000) found the bark to be responsible for most of the shrink-age in subalpine P. abies stems and reported a massive shift of water from bark to wood, which freezes first.
Based on their field study using time domain reflec-tometry, Sparks et al. (2001) suggested that the low c of ice may play an essential role for embolism induction in P. contorta. The occurrence of low c is contrary to findings of Robson and Petty (1987), who measured positive pressure during freezing of Pseudotsuga menziesii. This was explained by the 9% volume in-crease during ice crystal formation. However, the authors used excised wood samples that may behave differently from samples with an intact wood-bark system. Hammel (1967) suggested that pits may be aspirated and isolate tracheids from each other. In contrast, Robson et al. (1988) observed aspirated as well as open pits in frozen conifer wood so that c gradients and water shifts between tracheids are pos-sible. Therefore, we hypothesize that c gradients due to the appearing ice front can cause air seeding.
This freeze-thaw induced air seeding may be rele-vant when the tracheids are already at a critical c near their drought-induced vulnerability threshold. When water is removed from these tracheids because of a nearby ice front with low c, air may enter from ad-jacent air-filled tracheids. The proposed mechanism would explain why samples at moderate c were hardly vulnerable to freeze-thaw induced embolism and why we observed clustered areas of dysfunctional tracheids. It may also explain why only a few tracheids embolized during each freeze-thaw cycle. The ice front itself, which has just induced embolism in the tra-cheids, stops the process when the affected xylem area freezes. Robson and Petty (1987) reported a growth velocity of ice between 1.75 and 2.3 mm s21 in P. menziesii. Under the assumption that growth veloc-ity is constant, bigger tracheids would be in contact with the ice front and its low c for a longer time than smaller conduits before they are completely filled with ice. This would correspond to correlations between
tracheid size and freeze-thaw induced embolism ob-served in several studies (Davis et al., 1999; Sperry and Robson, 2001; Pittermann and Sperry, 2003, 2006).
It remains unclear how the presented data and the hypothesized mechanism could be linked to the clas-sical theory of freeze-thaw induced embolism. Because many previous studies revealed clear evidence for this theory on the one hand and this study indicates embo-lism formation during freezing on the other, it seems likely that different processes contribute to embolism formation during freeze-thaw events.
MATERIALS AND METHODS
Twigs of Picea abies L. Karst., about 1.5 m long, were harvested at Praxmar, Austria (11°06#E, 47°09#N, 1,700 m) in autumn, 2004 (September to Decem-ber), wrapped in plastic bags, and transported to the laboratory of the Institute of Botany in Innsbruck. Twigs were recut under water and saturated for at least 12 h before they were dehydrated on the bench until c was between 22.97 and 22.70 MPa (mean 5 22.81 MPa). This is still above the upper drought-induced vulnerability of P. abies (about 23 MPa; Mayr et al., 2002), where highest effects upon freeze-thaw events were expected (Fig. 1). In intervals, c measurements were done on end twigs. When the appropriate c was reached, at least three measurements were taken to calculate the mean c of the twig. For freeze-thaw experiments, samples about 20 cm long and up to 1 cm in diameter were cut from the twigs. After removal of the side twigs, the main axes were tightly wrapped in plastic bags to avoid water loss and used for freeze-thaw experiments. No ice formation was observed at the sample surface, even after up to 120 freeze-thaw cycles.
In addition, samples were prepared from fully saturated twigs as well as from twig axes completely dehydrated in an oven (80°C for 24 h).
Temperature Treatment
Samples were exposed to freeze-thaw cycles in a cold-heat test chamber (MK53, Binder) or in isolated chambers, temperature controlled by a circulator bath (Ministat, Huber). Experiments with five, 10, or up to 120 temperature cycles were done. During the standard protocol, chamber temperature de-creased from 6°C to 28°C in 1 h, was kept at 28°C for 1 h, inde-creased to 6°C in 1 h, and was kept at 6°C for 1 h. Then the next 4-h lasting cycle started. Xylem temperature was measured in 1- or 5-min intervals with a thermocouple inserted into at least two samples and stored by a data logger (CR10X, Campbell Scientific or DL2e, Delta T Devices). In the standard experiment, the cooling rate of the xylem was 11.7 Kh21. In addition, experiments with cooling
rates of 23.7, 6.7, and 3.4 Kh21were done. Analysis of sample diameter
changes was done during 10 temperature cycles between 5°C and 210°C at 6.8 Kh21cooling rate of the xylem. The standard cooling rate was higher than
naturally occurring rates of up to 5.4 Kh21observed at the alpine timberline
(Mayr et al., 2006). Based on the cooling rate chosen, it was possible to do experiments with up to 120 temperature cycles within about 4 weeks. Experi-ments with lower cooling rates resulted in effects similar to those caused by cooling rates under natural conditions.
c
c of end segments (up to 5 cm long) of twigs were measured with a pressure chamber (model 1000 Pressure Chamber, PMS Instrument Com-pany). Measured values were assumed to be very similar to c in the xylem of the main axes, because transpiration was extremely low. In all experiments, c was determined before samples were prepared for temperature treatment.
To control the constancy of c during experiments, branches with several side twigs were exposed to 50 temperature cycles following the standard experimental protocol. Every 10 cycles, end segments of these twigs were used for c determination. As branches were wrapped in plastic bags to avoid transpirational water losses, this experiment had to be stopped at 50 temper-ature cycles. After about 10 d, needles showed yellowing, and a sudden increase in c was observed. This was probably caused by the insufficient oxygen concentration within the bags leading to needle damage.
Ultrasonic Measurements
Ultrasonic measurements were done with I15I integral preamp sensors (d 5 18 mm) connected to 4615 Drought Stress monitors (both by Physical Acoustics Corporation). Total gain of the instruments was 72 dB with the monitor amplifier set to 52 dB and the head-stage amplifier fixed at 20 dB. Time courses of acoustic emissions were registered with a notebook. Sensors were attached with clamps to the upper side (opposite wood) of the samples. At these positions, about 4 cm2of the bark were removed, and the xylem was covered
with silicone grease to improve the acoustic coupling and prevent transpiration.
Sample Diameter Measurements
Samples, about 5 cm in length and 1 cm in diameter, were mounted in a holder with linear variable differential transformers (linear variable displace-ment transducer [LVDT] sensors, DF 2.5 and DF 5, Solartron Metrology; see Ame´glio et al., 2001). Sensor outputs were recorded with a data logger (DL2e, Delta T Devices) every 5 min.
Cryo-SEM Analysis
During the 120 freeze-thaw cycle experiment, samples were removed from the temperature chamber after every 20th freezing process and stored in a freezer at 220°C. Samples were thawed and transported to the laboratory in Clermont-Ferrand, tightly wrapped in plastic bags. Samples, 2 cm in length and less than 2 mm in diameter, were prepared from opposite wood while immersed in distilled water. Samples were frozen and stored in liquid nitro-gen until use for the Cryo-SEM analysis. Thus, preparation caused one addi-tional, uncontrolled freeze-thaw cycle.
Samples (still immersed in liquid nitrogen) were fixed in about 3-mm deep holes made in an aluminum bar screwed on the specimen holder. Then, samples were fractured with pliers and rapidly transferred to the cry-prep-aration chamber of the microscope (model CT 1000) held at 2150°C. After vacuum was reached in the chamber, samples were moved to the sample stage (2150°C) in the SEM column (model SEM 505, Philips). Samples were ob-served uncoated at 5.2 kV. Surface etching was achieved by setting the stage temperature to 280°C for several minutes.
Dye Experiments
During the 120 freeze-thaw cycle experiment, samples were removed from the temperature chamber after every 20th cycle. After removal of the bark and recutting under water, samples (up to 5 cm long, up to 1 cm in diameter) were sealed in silicone tubes connected to a reservoir filled with dye solution (Phloxine B, Sigma Chemical; 2% [w/v]). After staining (4 kPa; 5–10 min), sample cross sections were prepared.
Number of Samples and Statistics
The experiments with five or 10 temperature cycles following standard conditions were done with seven twigs dehydrated to 22.8 MPa, five satu-rated, and three totally dehydrated twigs. In four of these experiments, we measured simultaneously diameter changes via LVDT sensors in samples at 22.8 MPa and saturated samples. Two experiments with consecutive 120 temperature cycles following standard conditions were done, and one exper-iment for each cooling rate, respectively. c (measurements of at least six end twigs every 10 cycles) were determined from three twigs exposed to 50 tem-perature cycles in a standard experiment. For Cryo-SEM analysis, samples were prepared after 0, 20, 40, 60, 80, 100, and 120 temperature cycles. At least two representative photos of all samples were taken. In addition, for each sample the number of tracheids in 10 to 20 randomly chosen clusters was counted.
Values of experiments following standard conditions are given as mean 6
SE. Differences were tested at 5% probability level with Student’s t test after checking for normal distribution and variance of the data. Correlation analyses were carried out via Pearson’s linear correlation coefficient r at 5% probability level. For the analysis of the relative number of acoustic emissions (Fig. 4), a parabolic regression was used.
ACKNOWLEDGMENTS
We thank Birgit Da¨mon, University of Innsbruck, for excellent assistance during measurements.
Received June 23, 2006; accepted October 9, 2006; published October 13, 2006.
LITERATURE CITED
Ame´glio T, Cochard H, Ewers FW(2001) Stem diameter variations and cold hardiness in walnut trees. J Exp Bot 52: 2135–2142
Davis SD, Sperry JS, Hacke UG(1999) The relationship between xylem con-duit diameter and cavitation caused by freezing. Am J Bot 86: 1367–1372 Ewers FW(1985) Xylem structure and water conduction in conifer trees,
dicot trees and lianas. Int Assoc Wood Anat Bull 6: 309–317
Feild TS, Brodribb T(2001) Stem water transport and freeze-thaw xylem embolism in conifers and angiosperms in a Tasmanian treeline heath. Oecologia 127: 314–320
Groß M, Rainer I, Tranquillini W(1991) U¨ ber die frostresistenz der fichte mit besonderer beru¨cksichtigung der zahl der gefrierzyklen und der geschwindigkeit der temperatura¨nderung beim frieren und auftauen. Forstwiss Centralbl 110: 207–217
Hacke UG, Sperry JS(2001) Functional and ecological xylem anatomy. Perspect Plant Ecol Evol Syst 4: 97–115
Hacke UG, Sperry JS, Pittermann J(2004) Analysis of circular bordered pit function. II. Gymnosperm tracheids with torus-margo pit membranes. Am J Bot 91: 386–400
Hammel HT(1967) Freezing of xylem sap without cavitation. Plant Physiol 42:55–66
Hoffmann H (1857) Witterung und Wachstum, oder Grundzu¨ge der Pflanzenklimatologie. A. Forstner, Leipzig, Germany, pp 312–334 Kikuta SB, Richter H(2003) Ultrasound acoustic emissions from freezing
xylem. Plant Cell Environ 26: 383–388
Larcher W(1972) Der wasserhaushalt immergru¨ner pflanzen im winter. Ber Dt Bot Ges 85: 315–327
Lemoine D, Granier A, Cochard H(1999) Mechanism of freeze-induced embolism in Fagus sylvatica L. Trees (Berl) 13: 206–210
Lo Gullo MA, Salleo S(1993) Different vulnerabilities of Quercus ilex L. to freeze- and summer drought-induced xylem embolism: an ecological interpretation. Plant Cell Environ 16: 511–519
Mayr S, Gruber A, Bauer H(2003a) Repeated freeze-thaw cycles induce embolism in drought stressed conifers (Norway spruce, stone pine). Planta 217: 436–441
Mayr S, Schwienbacher F, Bauer H(2003b) Winter at the Alpine timber-line: Why does embolism occur in Norway spruce but not in stone pine? Plant Physiol 131: 780–792
Mayr S, Wieser G, Bauer H(2006) Xylem temperatures during winter in conifers at the alpine timberline. Agric For Meteorol 137: 81–88 Mayr S, Wolfschwenger M, Bauer H(2002) Winter-drought induced
em-bolism in Norway spruce (Picea abies) at the Alpine timberline. Physiol Plant 115: 74–80
Michaelis P (1934) O¨ kologische studien an der alpinen baumgrenze. V. Osmotischer wert und wassergehalt wa¨hrend des winters in verschiedenen ho¨henlagen. Jahrb Wiss Bot 80: 337–362
Pisek A, Larcher W(1954) Zusammenhang zwischen austrocknungsresis-tenz und frostha¨rte bei immergru¨nen. Protoplasma 44: 30–46 Pittermann J, Sperry JS(2003) Tracheid diameter is the key trait determining
the extent of freezing-induced embolism in conifers. Tree Physiol 23: 907–914 Pittermann J, Sperry JS(2006) Analysis of freeze-thaw embolism in coni-fers: the interaction between cavitation pressure and tracheid size. Plant Physiol 140: 374–382
Pittermann J, Sperry JS, Hacke UG, Wheeler JK, Sikkema EH (2005) Torus-Margo pits help conifers compete with angiosperms. Science 310: 1924 Raschi A, Scarascia Mugnozza G, Surace R, Valentini R, Vazzana C(1989) The use of ultrasound technique to monitor freezing and thawing of water in plants. Agric Ecosyst Environ 27: 411–418
Robson DJ, McHardy WJ, Petty JA(1988) Freezing in conifer xylem. II. Pit aspiration and bubble formation. J Exp Bot 39: 1617–1621
Robson DJ, Petty JA(1987) Freezing in conifer xylem I: pressure changes and growth velocity of ice. J Exp Bot 38: 1901–1908
Sachs J (1860) Kristallbildung beim gefrieren und auftauen saftiger pflanzenteile, mitgeteilt von W. Hofmeister. Ber Verh Sa¨chs Akad Wiss 12:1–50
Sparks JP, Campbell GS, Black RA(2001) Water content, hydraulic con-ductivity, and ice formation in winter stems of Pinus contorta: a TDR case study. Oecologia 127: 468–475
Sperry JS, Hacke UG(2004) Analysis of circular bordered pit function.
I. angiosperm vessels with homogenous pit membranes. Am J Bot 91: 369–385
Sperry JS, Nichols KL, Sullivan JEM, Eastlack SE(1994) Xylem embolism in ring-porous, diffuse-porous, and coniferous trees of northern Utah and interior Alaska. Ecology 75: 1736–1752
Sperry JS, Robson DJ(2001) Xylem cavitation and freezing in conifers. In FJ Bigras, SJ Colombo, eds, Conifer Cold Hardiness. Kluwer Academic Publishers, Dordrecht, The Netherlands, pp 121–136
Sperry JS, Sullivan JEM(1992) Xylem embolism in response to freeze-thaw cycles and water stress in ring-porous, diffuse-porous and conifer spe-cies. Plant Physiol 100: 605–613
Sperry JS, Tyree MT(1990) Water-stress-induced xylem embolism in three species of conifers. Plant Cell Environ 13: 427–436
Sucoff E(1969) Freezing of conifer xylem and the cohesion-tension theory. Physiol Plant 22: 424–431
Tranquillini W(1976) Water relations and alpine timberline. In OL Lange, L Kappen, ED Schulze, eds, Ecological Studies. Analysis and Synthesis, Vol 19. Springer Verlag, Berlin, pp 473–491
Tranquillini W(1980) Winter desiccation as the cause for alpine timberline. NZFS FRI Technical Paper 70: 263–267
Tyree MT, Davis SD, Cochard H(1994) Biophysical perspectives of xylem evolution: Is there a tradeoff of hydraulic efficiency for vulnerability to dysfunction? IAWA J 15: 335–360
Tyree MT, Zimmermann MH(2002) Xylem Structure and the Ascent of Sap. Springer Verlag, Berlin
Weiser RL, Wallner SJ (1988) Freezing woody plant stems produces acoustic emissions. J Amer Soc Hort Sci 113: 636–639
Zweifel R, Ha¨sler R (2000) Frost-induced reversible shrinkage of bark of mature subalpine conifers. Agric For Meteorol 102: 213–222