functionalized with bio-inspired Pd catalysts and
their superior hydrogen sensing performance
The MIT Faculty has made this article openly available.
Please share
how this access benefits you. Your story matters.
Citation
Choi, Seon-Jin, Chattopadhyay, Saptarshi, Kim, Jae Jin, Kim,
Sang-Joon, Tuller, Harry L., Rutledge, Gregory C., and Kim, Il-Doo.
“Coaxial Electrospinning of WO3nanotubes Functionalized with
Bio-Inspired Pd Catalysts and Their Superior Hydrogen Sensing
Performance.” Nanoscale 8, no. 17 (2016): 9159–9166. © 2015 Royal
Society of Chemistry
As Published
http://dx.doi.org/10.1039/c5nr06611e
Publisher
Royal Society of Chemistry
Version
Author's final manuscript
Citable link
http://hdl.handle.net/1721.1/108045
Terms of Use
Creative Commons Attribution-Noncommercial-Share Alike
Nanoscale
ARTICLE
a.Department of Material Science and Engineering, Korea Advanced Institute of Science and Technology (KAIST), Daejeon 305–701, Republic of Korea. E-‐mail: idkim@kaist.ac.kr; Fax: +82-‐42-‐350-‐5329; Tel: +82-‐42-‐350-‐3329
b.Department of Chemical Engineering, Massachusetts Institute of Technology, 77 Massachusetts Avenue, Cambridge, MA 02139, USA. E-‐mail: rutledge@mit.edu; Fax: +1-‐617-‐324-‐3127; Tel: +1-‐617-‐253-‐0171
c. Department of Materials Science and Engineering, Massachusetts Institute of Technology, 77 Massachusetts Avenue, Cambridge, MA 02139, USA.
Electronic Supplementary Information (ESI) available: Coaxial electrospinning with different feeding rates, additional TEM analysis for pore size analysis, TEM and EDS analysis of Rh-‐loaded macroporous WO3 NTs, and dynamic response transition poperties of sensors. See DOI: 10.1039/x0xx00000x
Received 00th January 20xx, Accepted 00th January 20xx DOI: 10.1039/x0xx00000x www.rsc.org/
Coaxial electrospinning of WO
3nanotubes functionalized with
bio-‐inspired Pd catalyst and their superior hydrogen sensing
performance
Seon-‐Jin Choi,a Saptarshi Chattopadhyay,b Jae Jin Kim,c Sang-‐Joon Kim,a Harry L. Tuller,c Gregory C. Rutledge,b,* and Il-‐Doo Kima,*
Macroporous WO3 nanotubes (NTs) functionalized with nanoscale catalysts were fabricated using coaxial electrospinning
combined with sacrificial templating and protein-encapsulated catalyst. The macroporous thin-walled nanotubular structures were obtained by introducing colloidal polystyrene (PS) particles to a shell solution of W precursor and poly(vinylpyrrolidone). After coaxial electrospinning with a core liquid of mineral oil and subsequent calcination, open pores with an average diameter of 173 nm were formed on the surface of WO3 NTs due to decomposition of the PS colloids.
In addition, catalytic Pd nanoparticles (NPs) were synthesized using bio-inspired protein cages, i.e., apoferritin, and uniformly dispersed within the shell solution and subsequently on the WO3 NTs. The resulting Pd-functionalized
macroporous WO3 NTs were demonstrated to be high performance hydrogen (H2) sensors. In particular, Pd-funtionalized
macroporous WO3 NTs exhibited a very high H2 response (Rair/Rgas) of 17.6 at 500 ppm with short response time.
Furthermore, the NTs were shown to be highly selective for H2 compared to other gases such as carbon monoxide (CO),
ammonia (NH3), and methane (CH4). The results demonstrate a new synthetic method to prepare highly porous nanotubular
structure with well-dispersed nanoscale catalysts, which can provide improved microstructures for chemical sensing.
Introduction
1
Hydrogen (H2) has been regarded as a next generation fuel
2
energy considering its abundance and high heat of combustion
3
(142 kJ/g).1, 2 In addition, burning of hydrogen produces only
4
water, without harmful by-products, enabling environmentally
5
friendly energy generation.3, 4 However, there are several
6
potential risks to be addressed prior to commercial use, such as
7
the wide range of flammable concentration (4–75%), low
8
ignition energy (0.02 mJ), high diffusion coefficient (0.61
9
cm2/s), and large flame propagation velocity.5-7 Moreover,
10
hydrogen gas is colourless, odourless, and tasteless, which
11
leads to difficulty in detection.8 For these reasons, a highly
12
sensitive hydrogen detector is required for safe storage and
13
monitoring of hydrogen leakage.
14
Semiconductor metal oxides (SMOs) have been studied as
15
promising gas sensors, considering their low cost, fast response,
16
stability, and high reactivity toward analyte gases.9 Recently,
17
advances in nanostructure synthetic methods have promoted the
18
development of highly sensitive and selective gas sensors
19
having large surface area and porosity.10, 11 Among the various
20
approaches, electrospinning is a facile and versatile method to
21
obtain one-dimensional (1D) SMO nanostructures with large
22
surface-to-volume ratio and high porosity, adequate for high
23
performance hydrogen sensors.12, 13 A templating route
24
combined with electrospinning has been suggested as a
25
powerful strategy to obtain porous nanostructures.14 For
26
example, hollow nanotubular structures were demonstrated
27
using electrospun polymeric composite nanofibers (NFs) by
28
coating a thin inorganic layer, such as Al2O3,15 NiO,16 WO3,17, 18
29
and ZnO,19 and subsequent high-temperature calcination to
30
decompose the inner polymeric component and crystallize the
31
outer inorganic layer. In addition, polymeric colloids were
32
introduced into the electrospinning solution to form pores on
33
SMO NFs.20-22 It was shown that pore diameter and distribution
34
on the SMO surface can be controlled by introducing different
35
sizes of the colloid templates.
36
Coaxial (or two-fluid) electrospinning has been proposed as
37
an effective method to fabricate hollow nanotubular structure
38
that eliminates the additional synthesis processes such as
39
coating of inorganic layer on the sacrificial templates.13, 23-26 A
40
variety of inorganic nanotubes (NTs) were obtained using
41
coaxial electrospinning, including TiO2,27, 28 α-Fe2O3,29 and
42
SnO230 for specific applications. However, to the best of our
43
knowledge, coaxial electrospinning combined with sacrificial
44
templating to synthesize macroporous SMO NTs has not yet
45
been demonstrated. The macroporous SMO NTs are
46
advantageous, considering that gas molecules can more
ARTICLE Journal Name (b ) 1 0 n m 2 n m Pd (111)=2.26 Å (a ) Metal ions (Pd2+, Rh3+) Protein shell Core cage (c )
1
Fig. 1 (a) Schematic illustration of apoferritin protein cage for nanocatalyst synthesis.
2
TEM image of (b) apoferritin-‐encapsulated Pd nanoparticles (AF-‐Pd NPs), and (c) high-‐
3
resolution TEM (HR-‐TEM) image AF-‐Pd NPs.
4
5
effectively diffuse into the core of the SMO NTs, thereby
6
promoting gas reactions on the inner surface.
7
Catalytic functionalization of SMO-based materials enhances
8
sensitivity and selectivity of gas sensors. Noble metallic
9
nanoparticles (NPs) such as Pt,31 Pd,32 and Rh33, 34 are known to
10
be the most effective catalysts for high performance gas sensors.
11
To have maximum catalytic effect, the diameters of the
12
catalytic NPs should be on the order of a few nanometers.35
13
Moreover, uniform dispersion of the NPs is desirable;
14
otherwise, the sensing performance degrades rapidly due to the
15
agglomeration of catalytic NPs.36, 37
16
In this work, we propose a method to fabricate
nanocatalyst-17
loaded macroporous WO3 NTs using coaxial electrospinning
18
combined with sacrificial templating and bio-inspired catalyst
19
functionalization. Multiple pores were formed on the
thin-20
walled WO3 NTs after subsequent calcination at high
21
temperature. In addition, well-dispersed catalyst
22
functionalization was achieved by introducing
protein-23
encapsulated metallic NPs to the shell solution during coaxial
24
electrospinning. The main focus of this research was to
25
examine a new synthetic method to obtain macroporous
26
nanotubular SMO structures with functionalization by
well-27
distributed nanocatalysts, and to demonstrate the remarkably
28
improved hydrogen sensing performances resulting therefrom.
29
Experimental section
30
Materials
31
Ammonium metatungstate hydrate [(NH4)6H2W12O40·xH2O],
32
polyvinylpyrrolidone (PVP, Mw=1,300,000 g/mol), potassium
33
tetrachloropalladate(II) (K2PdCl4), sodium borohydride
34
(NaBH4), heavy mineral oil, and 0.2 µm filtered apoferritin
35
from equine spleen were purchased from Sigma-Aldrich (St.
36
Louis, USA). Polystyrene (PS) latex microspheres with the
37
average diameter of 200 nm dispersed at 2.5 wt% in water were
38
purchased from Alfa Aesar (Ward Hill, USA). All chemicals
39
were used without further purification.
40
Synthesis of nanocatalyst particles encapsulated by protein
41
cages
42
To synthesize well-dispersed and nanoscale catalyst particles,
43
we employed bio-inspired protein cages, i.e., apoferritin, that
44
consisted of a 24-subunit protein complex that exhibits a
45
hollow spherical structure (Fig. 1a). These protein cages can
46
encapsulate metal ions, and the subsequent reduction process
47
can produce protein-encapsulated metallic NPs.38 Firstly, 1 g of
48
apoferritin solution was mixed with 0.1 M NaOH solution to
49
control pH of the solution around 8.6. Then, 1.8 wt % of Pd
50
precursor (K2PdCl4) aqueous solution was added to the
51
apoferritin solution and gently stirred at 100 rpm using a
52
magnetic bar to penetrate Pd2+ ions into the inner cavity of
53
apoferritin. After stirring for 1 h, a reducing agent of NaBH4 (1
54
M) was rapidly injected into the solution to form metallic Pd
55
NPs encapsulated by apoferritin (hereafter,
apoferritin-56
encapsulated Pd NPs are referred as AF-Pd NPs). Finally, the
57
prepared AF-Pd NPs were centrifuged at 12,000 rpm for 10 min
58
to remove the remaining Pd2+, and subsequently re-dispersed in
59
DI water.
60
Synthesis of Pd-loaded macroporous WO3 NTs
61
Hollow WO3 nanotubular structure was synthesized by the
62
coaxial electrospinning approach as illustrated in Fig. 2a.
63
Different electrospinning solutions were emitted through the
64
coaxial nozzle (SKU BCN-0802, InovensoTM) having different
65
diameters, i.e., core diameter of 0.8 mm and shell diameter of
66
1.6 mm, with concentric configuration. Mineral oil was utilized
67
as a core electrospinning solution due to its easy vaporization at
68
high-temperature. For the shell solution, 0.2 g of ammonium
69
metatungstate hydrate and 0.25 g of PVP were dissolved in 1.5
70
g of DI water containing 2.5 wt% PS colloids and continuously
71
stirred at room temperature for 3 h. For catalyst
72
functionalization, the prepared AF-Pd NPs were separately
73
introduced in the shell electrospinning solution with the
74
concentrations of 0.1 wt%.
75
The resulting solutions were electrospun at feeding rates of
76
10 µL/min of mineral oil for the core and 30–100 µL/min of
77
composite solution for the shell, using syringe pumps. A
78
constant DC voltage of 30 kV was applied between the coaxial
79
nozzle and aluminum foil, employed as collector. The distance
80
between the nozzle and the collector was 15 cm. The as-spun
81
core/shell composite NFs were obtained after coaxial
82
electrospinning (Fig. 2b). The shell layer comprised
apoferritin-83
encapsulated catalytic NPs and W precursor/PVP composite
84
decorated with PS colloids. For the core fluid, mineral oil was
85
used. The as-spun core/shell composite NFs were calcined at
86
600 ˚C for 1 h in ambient air to obtain catalyst-loaded
87
macroporous WO3 NTs having multiple, approximately circular
88
pores on the thin wall of NTs (Fig. 2c). Dense WO3 NTs
89
without PS colloid templates and pristine macroporous WO3
90
NTs without catalyst functionalization were synthesized as well,
91
for comparison.
92
Characterization of H2 sensing performances
93
All of the sensors were stabilized in air for 24 h as baseline
94
before the measurement. The sensors were exposed to different
95
analytes (hydrogen, carbon monoxide, ammonia, and methane)
96
with concentrations ranging from 10 ppm to 500 ppm. Each
97
analyte was exposed for 10 min, followed by 10 min of
98
exposure to air to recover the initial baseline values. The
99
resistance changes were measured using a data acquisition
100
system (34970A, Hewlett-Packard), and the sensors were
101
characterized by their relative response (Rair/Rgas), where Rair is
102
the baseline resistance of the sensor upon exposure to air and
103
Rgas is the resistance measured upon exposure to a particular
104
Journal Name ARTICLE
analyte. The operating temperatures of the sensors were
1
controlled to be 450 ˚C in a furnace tube.
2
Results and discussion
3
Morphological and structural evaluation
4
The microstructures of the protein-encapsulated catalytic Pd
5
NPs were examined using TEM (Fig. 1b and c). It was clearly
6
observed that well-dispersed NPs were synthesized within the
7
protein cages. The good dispersion can be explained by
8
electrostatic repulsion between the protein templates due to
9
surface charge, which prevented agglomeration between the
10
NPs. In addition, the overall size of the protein cage was 12–13
11
nm, whereas the inner cavity size was 7–8 nm.39 The inner
12
cavity size limited the size of the nanoscale particles to
13
diameters less than 8 nm. As confirmed by TEM analysis, the
14
synthesized AF-Pd NPs showed average diameters of 2 nm (Fig.
15
1b). Moreover, the Pd NPs were observed to be crystalline,
16
with the crystal planes of Pd (111), corresponding to the
17
interplanar distances of 2.26, in evidence (Fig. 1c).
18
The AF-Pd NPs were dispersed in the shell electrospinning
19
solutions for the catalytic functionalization. Core/shell
20
composite NFs decorated with PS colloid templates and
21
apoferritin-encapsulated catalytic NPs were achieved after
22
electrospinning (Fig. 2b). Polymeric components, mineral oil,
23
and protein cages were decomposed during subsequent
24
calcination of the as-spun core/shell composite NFs, while
25
forming WO3 NTs by oxidation of the W precursor (Fig. 2c).
26
SEM observation revealed the rugged surface morphology of
27
the as-spun core/shell composite NFs due to the decoration of
28
PS colloids on the surface (Fig. 2d). Different microstructures
29
were obtained after calcination at 600 ˚C, depending on the
30
feeding rate of shell solution (fs) with the fixed core solution
31
feeding rate (fc=10 µL/min) (Supporting Information, Fig. S1).
32
When the shell feeding rate was slow, i.e., fs=30 µL/min, an
33
open tubular structure was formed due to the limited coating of
34
shell composite solution on mineral oil. On the other hand,
35
perfect tubular structures were achieved when fs was 80 µL/min
36
or 100 µL/min. Fig. 2e shows the macroporous WO3 NTs with
37
multiple pores on the surface when fs and fc were 100 µL/min
38
and 10 µL/min, respectively. The pore sizes were evaluated by
39
TEM, and the average diameter was 173 nm (Supporting
40
Information, Fig. S2). The decreased average pore diameter as
41
comparing with the original diameter (i.e., 200 nm) of the PS
42
colloid was mainly attributed to the shrinkage of the spherical
43
PS colloids during the thermal decomposition and the migration
44
of W precursor in the early stage of heat treatment.20
45
The microstructures of the catalytic Pd-loaded macroporous
46
WO3 NTs were investigated (Fig. 2f). The surface
47
morphologies of the Pd-loaded macroporous WO3 NTs were
48
maintained, with only minor differences when compared to the
49
pristine macroporous WO3 NTs. In addition, close observation
50
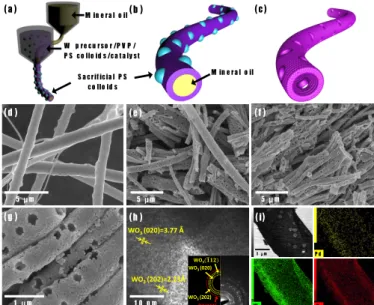
1 μ m W O P d WO3 (020)=3.77 Å WO3 (202)=2.23Å WO3(𝟏#𝟏𝟐) WO3 (020) WO3 (202) Pd (111) (d ) (e ) (f ) (g ) (h ) (i) 5 μ m 5 μ m 5 μ m 1 μ m 1 0 n m (a ) (b ) (c ) M in e r a l o il W p re c u r so r /P V P / P S c o llo id s/c a t a ly st S a c r if ic ia l P S c o llo id s M in e r a l o il51
Fig. 2 Schematic illustrations of (a) coaxial electrospinning using mineral oil in the
52
core and composite solution in the shell, (b) as-‐spun W precursor/PVP composite
53
nanotubes (NTs) decorated with PS colloid templates and apoferritin-‐encapsulated
54
nanocatalysts, and (c) catalyst-‐loaded macroporous WO3 NTs with multiple pores
55
after calcination at 600 °C for 1 h. SEM images of (d) as-‐spun W precursor/PVP
56
composite NTs decorated with PS colloid templates, (e) macroporous WO3 NTs, (f) Pd-‐
57
loaded macroporous WO3 NTs, and (g) magnified SEM image of (f) after calcination.
58
(h) HR-‐TEM image with selected area electron diffraction (SAED) pattern in the inset
59
and (i) scanning TEM image with energy dispersive X-‐ray spectroscopy (EDS) mapping
60
images of Pd-‐loaded macroporous WO3 NTs.
61
62
of Pd-loaded macroporous WO3 NTs exhibited approximately
63
circular pores on the surface (Fig. 2g). High-resolution TEM
64
(HR-TEM) observation of Pd-loaded macroporous WO3 NTs
65
revealed the polycrystalline WO3 structures with crystal planes
66
of (020) and (202), which corresponds to inter-planar distances
67
of 3.77 Å and 2.23 Å (Fig. 2h). Selected area electron
68
diffraction (SAED) patterns of Pd-loaded macroporous WO3
69
NTs presented WO3(020), WO3(112), and WO3(202) crystal
70
planes, with inter-planar distances of 3.77 Å, 3.12 Å, and 2.62
71
Å, respectively, which are partially investigated in HR-TEM
72
analysis (in the inset of Fig. 2h). However, crystal planes and
73
SAED pattern of Pd NPs were not clearly observed due to the
74
low content of Pd in WO3 NTs. To confirm the Pd component
75
and the distribution, energy dispersive X-ray spectroscopy
76
(EDS) analysis was carried out. The result clearly revealed
77
uniform distribution of Pd over the WO3 NTs (Fig. 2i). In
78
addition, a scanning TEM image also showed the hollow
79
structure of Pd-loaded macroporous WO3 NTs (Fig. 2i). To
80
further confirm the chemical state of Pd, X-ray photoelectron
81
spectroscopy (XPS) analysis was performed (Fig. S3). Even
82
though the intensities of Pd peaks were very weak due to the
83
low concentration of Pd in the WO3 NTs, high-resolution XPS
84
peaks at the vicinity of Pd 3d are mainly originated by the
85
oxidized state of Pd, i.e., Pd2+(PdO) with binding energies of
86
336.9 eV and 342.2 eV for 3d5/2 and 3d3/2, respectively.40
87
ARTICLE Journal Name
1
2
Fig. 3 (a) Dynamic response transition and (b) response time property of dense WO3 NTs, porous WO3 NTs, and Pd-‐Porous WO3 NTs in the gas concentration range of 10–500 ppm at 450 °C. (c) Selective H2 sensing property of Pd-‐Porous WO3 NTs against other analytes with the gas concentration of 500 ppm at 450 °C. (d) Cyclic resistance transition of Pd-‐Porous WO3 NTs toward H2 with the gas concentration of 500 ppm at 450 °C. (e) Dynamic response transition of porous WO3 NTs and Pd-‐Porous WO3 NTs in the gas concentration range of 5–20 ppm in air at high relative humidity (90% RH) at 450 °C. (f) Dynamic response and resistance transition properties of Pd-‐Porous WO3 NTs to 10 ppm of H2 in dry and humid air at 450 °C.Hydrogen molecule sensing characterization
1
To demonstrate the superior H2 sensing performance of the
Pd-2
loaded macroporous WO3 NTs, gas sensing characteristics were
3
evaluated using dense WO3 NTs, macroporous WO3 NTs
4
(Porous WO3 NTs), and Pd-loaded macroporous WO3 NTs
(Pd-5
Porous WO3 NTs) in the gas concentration range of 10–500
6
ppm at 450 ˚C (Fig. 3). Dynamic response measurements
7
showed that an approximately 1.6-fold improvement in H2
8
response was observed with the porous WO3 NTs
9
(Rair/Rgas=4.9) compared to the response of dense WO3 NTs
10
(Rair/Rgas=3). In addition, a dramatically improved H2 response
11
of 17.6 was obtained with Pd-Porous WO3 NTs at 500 ppm,
12
which was 5.9- and 3.6-fold better than that observed with
13
dense WO3 NTs and porous WO3 NTs, respectively.
14
Furthermore, Pd-Porous WO3 NTs exhibited outstanding
15
response (Rair/Rgas=2.6) at a very low concentration of 10 ppm
16
(Supporting Information, Fig. S4).
17
Response time characteristic of the sensors were investigated
18
at different concentrations (Fig. 3b). The response time is
19
defined as the elapsed time to reach 90% saturation in
20
maximum response. The Pd-loaded macroporous WO3 NTs
21
showed fast response due to the catalytic effect inducing active
22
surface reactions. Very fast response within 25 sec was
23
achieved with Pd-Porous WO3 NTs at 500 ppm of H2. However,
24
relatively slow response times with dense WO3 NTs (35 sec)
25
and porous WO3 NTs (50 sec) were observed at the same
26
concentration. Particularly, the porous WO3 NTs showed much
27
longer response times than the dense WO3 NTs. This can be
28
attributed to the fact that the porous WO3 NTs had more
29
available surface reaction sites as a result of the formation of
30
open pores, which accounted for the longer response time as
31
well as the slightly improved response compared to the dense
32
WO3 NTs. In addition, it should be noted that all the sensors
33
showed longer response times at low H2 concentration. The
34
observation of longer response times with decreasing gas
35
concentrations has been reported previously.41-43 The reaction is
36
basically diffusion-limited at low H2 concentration. Based on
37
the theoretical study, the response time transition can be
38
explained by a non-linear diffusion reaction model.44 In that
39
study, the diffusion time (τ) was defined by
40
τ=k·x02·C0r–1/D (1)
41
where, k, x0, C0, and D are the reaction rate constant, film
42
thickness, gas concentration, and diffusion coefficient,
43
respectively. The constant r was found to be in the range of
44
0.3–1. In the present study, our sensor exhibited the constant r
45
in the range of 0.7–0.8 as indicated by fitting of eqn (1) to the
46
data in Fig. 3b. The model is based on the dependence of
47
response time on gas concentration. Specifically, the response
48
time is determined by a non-linear adsorption isotherm, which
49
leads to a concentration-dependent response time.
50
Selectivity of H2 detection with respect to other, potentially
51
interfering gases such as carbon monoxide (CO), ammonia
52
(NH3), and methane (CH4) at 500 ppm was investigated using
53
Pd-Porous WO3 NTs (Fig. 3c). The results revealed that
Pd-54
Porous WO3 NTs showed remarkably high H2 response
55
(Rair/Rgas=16.3±1.1) with minor responses (Rair/Rgas<1.6)
56
200 400 600 800 1000 1200 1400 1600 1 10 100 Resistance ( M Ω ) Time (min) Pd-Porous WO3 NTs 0 20 40 60 80 100 120 0 2 4 6 8 10 12 14 16 18 20 Response (Rair /Rgas ) Time (min) Dense WO3 NTs Porous WO3 NTs Pd-Porous WO3 NTs 5 0 0 p p m 2 5 0 p p m 1 0 0 p p m 5 0 p p m 2 5 p p m 1 0 p p m (c) (b) (a) (d) 0 2 4 6 8 10 12 14 16 18 20 CH4 CO H2Response (Rair/Rgas)
NH3 0 50 100 150 200 250 300 350 400 450 500 550 20 30 40 50 60 70 80 90 100 110 Dense WO3 NTs Porous WO3 NTs Pd-Porous WO3 NTs R es po nse tim e (s ec ) H2 concentration (ppm) 2 0 p p m 2 0 p p m 1 0 p p m 5 p p m 1 0 p p m 1 0 p p m 5 10 15 20 25 0 1 2 3 4 5 5 10 15 20 25 0 1 2 3 4 5 Time (min) Humid:90% RH Res pon se (Rair /Rgas ) Dry (f) (e) 1 0 p p m 1 0 p p m 0 20 40 60 80 100 120 0.8 1.0 1.2 1.4 1.6 1.8 2.0 Response (R air /Rgas ) Time (min) Porous WO3 NTs Pd-Porous WO3 NTs H2 air H2 air 5 10 15 20 25 10 100 1000 Humid:90% RH Resi stanc e (M Ω ) Time (min) Dry
Journal Name ARTICLE H2 P d O /P d O2– e– e– H2O O2 Ⅰ) S p ill-o v e r e f f e ct Ⅱ) HxW O3 f o rm a tio n 0 10 20 30 40 50 60 70 80 90 100 110 120 130 10 100 1000
Resistance
(
M
Ω
)
Time (min)
Dense WO3 NTs Porous WO3 NTs Pd-Porous WO3 NTs 2 5 0 p p m 1 0 0 p p m 5 0 p p m 2 5 p p m 1 0 p p m 5 0 0 p p m(a)
(b)
Pd WO 3 W O3 ф Pd = 5 e V ф WO 3= 4. 56 e V E va c1
Fig. 4 (a) Dynamic resistance changes of dense WO3 NTs, porous WO3 NTs, and
2
Pd-‐Porous WO3 NTs toward H2 within the concentration range of 10–500 ppm
3
at 450 °C. (b) Schematic illustration of H2 sensing mechanism of Pd-‐Porous WO3
4
NTs.
5
6
toward the other gases, which confirms the high H2 selectivity
7
of these materials. Stable H2 sensing property of Pd-Porous
8
WO3 NTs was evaluated as well by cyclic exposure of H2 (Fig.
9
3d). The sensor showed stable resistance changes over 25
10
cycles toward 500 ppm of H2.
11
12
The effect of moisture on the H2 sensing property was
13
investigated using the porous WO3 NTs and Pd-Porous WO3
14
NTs in the concentration range of 5–20 ppm in air with high
15
relative humidity (90% RH) at 450 °C (Fig. 3e). Under these
16
conditions, the Pd-Porous WO3 NTs exhibited a response of
17
1.26 at 20 ppm, which is a 20% improvement in response
18
compared to that of pristine porous WO3 NTs. However,
19
dramatically decreased response characteristics were observed
20
in both Pd-Porous WO3 NTs and pristine porous WO3 NTs
21
under the high humidity conditions. A reduction in response of
22
approximately 90% was observed for Pd-Porous WO3 NTs at
23
10 ppm of H2 in humid air (Fig. 3f). The relatively insensitive
24
H2 response of Pd-Porous WO3 NTs in humid air is mainly
25
attributed to the formation of hydroxyl groups (–OH) on the
26
surface of WO3 NTs.55 As a result, decreased baseline
27
resistance was also observed with Pd-Porous WO3 NTs in
28
humid air (Fig. 3f).
29
30
Hydrogen sensing mechanism
31
The mechanism responsible for the improved H2 sensing
32
performance of the Pd-Porous WO3 NTs was investigated (Fig.
33
4). Changes in the dynamic resistance of the sensors with
34
respect to changes in H2 concentrations were evaluated by
35
comparing the baseline resistances and resistance changes (Fig.
36
4a). All the sensors exhibited decreasing resistance when the
37
sensors were exposed to H2 gas. A well-known explanation for
38
the decreasing resistance attributes the decrease to the
39
elimination of chemisorbed oxygen species, i.e., O–, O2–, and
40
O2–, by the reaction with H2 on the surface of WO3. When
n-41
type WO3 is stabilized in ambient air, oxygen species are
42
chemisorbed on the surface of WO3, withdrawing electrons
43
from the conduction band to provide the baseline resistance.
44
Then, upon exposure to H2 gas, the resistance decreases as H2
45
reacts with the chemisorbed oxygen species, thereby donating
46
Composites Sensing type definition Response (Response) Sensitivity Detection limit Selectivity
Response / recovery time Operating Temp. Ref. Pd-WO 3
nanotubes Resistivity Rair/Rgas
17.6 @ 500 ppm 10 ppm CH4, CO, NH3 25 sec/- 450 ˚C This work Pd-WO 3
nanoplates Resistivity Rair/Rgas
843 @ 0.3 vol% 0.1 vol% CH 4, C3H6O, C 2H6, C3H8O, NH 3 ~50 sec/ ~25 sec 80 ˚C 45 Pd-WO 3
nanoplates Conductivity Rair/Rgas
34
@ 0.1 vol% 0.05 % - 24 sec/-
Room Temp. 46 Pd-WO3
nanolamellae Resistivity Rair/Rgas ~6 × 10 3 @ 400 ppm 200 ppm - -/- 250 ˚C 47 Pd/WO 3 film Resistivity (R0 – RH2) /RH2 4.77 × 10 4 @ 2% 500 ppm - -/ 47 sec 80 ˚C 48 Pd-WO 3
thick film Resistivity (Rair – Rgas)/Rgas
69
@ 200 ppm 50 ppm - <5 min/- 180 ˚C 49 Pd-WO
3
nanowire Resistivity Rair/Rgas
3.1 @ 1000 ppm 1000 ppm C3H6O, CH4O, C3H8O 76 sec/ 2491 sec 300 ˚C 50 Pd-WO 3 film (Pd/W=10%) Voltage
change (Vgas– Vair)/Vair 2.5 × 10 4
@ 1300 ppm 1300 ppm -
~100 sec/
~4000 sec Temp. Room 51 Pd-WO
3 film Conductivity (Igas/Iair) –1
400
@ 2300 ppm 2300 ppm CH4
102 sec/
7 sec 350 ˚C 52
Pd-WO3 film Resistivity (R0 – RH2) /RH2
1200
@ 3000 ppm 4 ppm
CH4O, C2H6O,
C3H6O, C3H8O,
CH2O
1400 sec/- Temp. Room 53
Pd-WO3 nanowire Conductivity (G − G0)/(G0·c) × 100% ~1000 @ 1000 ppm 10 ppm NO, H2S, CO -/ <900 sec 130 ˚C 54
ARTICLE Journal Name
electrons back to the conduction band.
1
Comparing the baseline resistances, pristine porous WO3 NTs
2
exhibited slightly higher resistance (31.5 MΩ) than that of
3
dense WO3 NTs (16.7 MΩ), which was mainly attributed to the
4
macroporous structure of the former. In the case of Pd-Porous
5
WO3 NTs, there was huge increase in baseline resistance (119.9
6
MΩ) compared to the other sensors. The increased baseline
7
resistance can be explained by the formation of a Schottkey
8
barrier between Pd and WO3 (Fig. 4b). The different work
9
functions of Pd (ф=5 eV)56 and WO3 (ф=4.56 eV)20 can form
10
an electron depletion layer at the interface, which results in the
11
increase in baseline resistance. In addition, formation of a p-n
12
junction can increase the baseline resistance. In other words, Pd
13
can be slightly oxidized to form p-type PdO on the surface of
14
Pd due to the high-temperature calcination in ambient air.32 The
15
formation of a p-n junction can also expand the electron
16
depletion layer at the interface, thereby increasing baseline
17
resistance.
18
The reaction mechanisms responsible for the large resistance
19
changes of Pd-Porous WO3 NTs toward H2 are discussed next.
20
As shown in the schematic illustration in Fig. 4b, two reactions
21
are mainly affected by the catalytic Pd. Generally, Pd can
22
dissociate H2 molecules into H atoms (Hads) on the surface of
23
Pd NP. These H atoms are distributed onto the WO3 surface,
24
which is known as the ‘spill-over effect’, to react with
25
chemisorbed oxygen species (i.e., O2– and O–), resulting in the
26
production of H2O molecules as expressed in the following
27
reactions.57, 5828
2Hads + O2– à H2O + 2e– (2)29
2Hads + O– à H2O + e– (3)30
The other reaction path is the formation of hydrogen tungsten
31
bronzes (HxWO3) on the surface of WO3 NTs by the partial
32
reduction of WO3, as described below.45
33
xHads + WO3 à HxWO3 (4)
34
The hydrogen atoms serve as electron donors, thereby
35
increasing the free carriers in WO3 and decreasing the overall
36
resistance of Pd-Porous WO3 NTs.46 Therefore, these two
37
reaction paths are believed to be responsible for the large
38
decrease in resistance from the baseline, and for the strong
39
response of Pd-Porous WO3 NTs toward H2.
40
It has been demonstrated that Pd-WO3 composites are
41
outstanding sensing materials for H2 detection. Table 1
42
summarizes recent publications on Pd-WO3 composite sensing
43
layers for H2 detection. A majority of the previous studies were
44
performed in the form of a thin film structure, whereas a few
45
works demonstrate the superior H2 sensing properties using
46
nanostructures. Regardless, the present work shows a relatively
47
strong response (Rair/Rgas=17.6) at a relatively low H2
48
concentrations, compared to the previous studies. In addition,
49
we demonstrated the lowest limit of detection (10 ppm) with
50
very fast responding speed (25 sec).
51
Conclusions
52
In this work, we have demonstrated the use of coaxial
53
electrospinning combined with sacrificial templating to produce
54
macroporous semiconductor metal oxide (SMO) nanostructures.
55
During the coaxial electrospinning, PS colloids were introduced
56
to the electrospinning solution to serve as templates for
57
macropores on the surface of the WO3 NTs. Circular-shaped
58
pores with an average diameter of 173 nm were achieved on the
59
WO3 NTs after subsequent calcination. The apoferrtin protein
60
cage is shown to be a powerful agent for distributing
61
nanocatalyst uniformly on SMO sensing layers. The noble
62
metallic Pd NPs were synthesized using apoferritin protein
63
cages and thus distributed on the macroporous WO3 NTs during
64
coaxial electrospinning. The Pd-loaded macroporous WO3 NTs
65
exhibited very fast response times, which is mainly attributed to
66
the catalytic effect of Pd. Particularly, Pd-loaded macroporous
67
WO3 NTs showed high sensitivity and selectivity toward H2.
68
Very high response (Rair/Rgas) of 17.6 was achieved at 500 ppm
69
of H2. In addition, Pd-loaded macroporous WO3 NTs revealed
70
high H2 selectivity with minor responses toward potential
71
interfering gases such as CO, NH3, and CH4. This work
72
provides a novel synthetic method using two-fluid
73
electrospinning for macroporous WO3 NTs with bio-inspired
74
nanocatalyst for high performance chemical sensors.
75
Acknowledgements
76
This work was supported by the Center for Integrated Smart
77
Sensors funded by the Ministry of Science, ICT & Future
78
Planning as Global Frontier Project (CISS-2011-0031870) and
79
partially funded by Intel’s University Research Office (URO).
80
We also would like to acknowledge the Institute for Soldier
81
Nanotechnology at MIT for use of facilities
82
83
Notes and references
84
1. P. A. Russo, N. Donato, S. G. Leonardi, S. Baek, D. E. Conte, G. Neri
85
and N. Pinna, Angew. Chem. Int. Edit., 2012, 51, 11053-11057.
86
2. T. Hubert, L. Boon-Brett, G. Black and U. Banach, Sens. Actuators B,
87
2011, 157, 329-352.
88
3. M. Z. Ahmad, V. B. Golovko, R. H. Adnan, F. Abu Bakar, J. Y.
89
Ruzicka, D. P. Anderson, G. G. Andersson and W. Wlodarski, Int. J.
90
Hydrogen Energ., 2013, 38, 12865-12877.
91
4. S. K. Arya, S. Krishnan, H. Silva, S. Jean and S. Bhansali, Analyst,
92
2012, 137, 2743-2756.
93
5. N. H. Al-Hardan, M. J. Abdullah and A. A. Aziz, Int. J. Hydrogen
94
Energ., 2010, 35, 4428-4434.
95
6. E. Sennik, Z. Colak, N. Kilinc and Z. Z. Ozturk, Int. J. Hydrogen
96
Energ., 2010, 35, 4420-4427.
97
7. S. Sumida, S. Okazaki, S. Asakura, H. Nakagawa, H. Murayama and T.
98
Hasegawa, Sens. Actuators B, 2005, 108, 508-514.
99
8. T. Samerjai, N. Tamaekong, C. Liewhiran, A. Wisitsoraat, A.
100
Tuantranont and S. Phanichphant, Sens. Actuators B, 2011, 157,
290-101
297.
102
9. I. D. Kim, A. Rothschild and H. L. Tuller, Acta Mater., 2013, 61,
974-103
1000.
104
10. T. Wagner, S. Haffer, C. Weinberger, D. Klaus and M. Tiemann, Chem.
105
Soc. Rev., 2013, 42, 4036-4053.
106
11. D. J. Wales, J. Grand, V. P. Ting, R. D. Burke, K. J. Edler, C. R.
107
Bowen, S. Mintova and A. D. Burrows, Chem. Soc. Rev., 2015, 44,
108
4290-4321.
109
12. B. Ding, M. R. Wang, X. F. Wang, J. Y. Yu and G. Sun, Mater. Today,
110
2010, 13, 16-27.
111
13. A. Greiner and J. H. Wendorff, Angew. Chem. Int. Edit., 2007, 46,
5670-112
5703.
113
14. H. Y. Chen, J. C. Di, N. Wang, H. Dong, J. Wu, Y. Zhao, J. H. Yu and
114
L. Jiang, Small, 2011, 7, 1779-1783.
115
Journal Name ARTICLE
15. Q. Peng, X. Y. Sun, J. C. Spagnola, G. K. Hyde, R. J. Spontak and G. N.
1
Parsons, Nano Lett., 2007, 7, 719-722.
2
16. N. G. Cho, H. S. Woo, J. H. Lee and I. D. Kim, Chem. Commun., 2011,
3
47, 11300-11302.
4
17. S. J. Choi, F. Fuchs, R. Demadrille, B. Grevin, B. H. Jang, S. J. Lee, J.
5
H. Lee, H. L. Tuller and I. D. Kim, ACS Appl. Mater. & Interfaces,
6
2014, 6, 9061-9070.
7
18. S. J. Choi, I. Lee, B. H. Jang, D. Y. Youn, W. H. Ryu, C. O. Park and I.
8
D. Kim, Anal. Chem., 2013, 85, 1792-1796.
9
19. S. H. Choi, G. Ankonina, D. Y. Youn, S. G. Oh, J. M. Hong, A.
10
Rothschild and I. D. Kim, ACS Nano, 2009, 3, 2623-2631.
11
20. S. J. Choi, C. Choi, S. J. Kim, H. J. Cho, M. Hakim, S. Jeon and I. D.
12
Kim, Sci. Rep., 2015, 5, 8067.
13
21. S. J. Choi, S. J. Kim, W. T. Koo, H. J. Cho and I. D. Kim, Chem.
14
Commun., 2015, 51, 2609-2612.
15
22. S. J. Choi, C. Choi, S. J. Kim, H. J. Cho, S. Jeon and I. D. Kim, RSC
16
Adv., 2015, 5, 7584-7588.
17
23. H. L. Qu, S. Y. Wei and Z. H. Guo, J. Mater. Chem. A, 2013, 1,
11513-18
11528.
19
24. D. Li and Y. N. Xia, Nano Lett., 2004, 4, 933-938.
20
25. J. H. Yu, S. V. Fridrikh and G. C. Rutledge, Adv. Mater., 2004, 16,
21
1562-1566.
22
26. Z. C. Sun, E. Zussman, A. L. Yarin, J. H. Wendorff and A. Greiner, Adv.
23
Mater., 2003, 15, 1929-1932.
24
27. X. Zhang, V. Aravindan, P. S. Kumar, H. Liu, J. Sundaramurthy, S.
25
Ramakrishna and S. Madhavi, Nanoscale, 2013, 5, 5973-5980.
26
28. X. Zhang, V. Thavasi, S. G. Mhaisalkar and S. Ramakrishna,
27
Nanoscale, 2012, 4, 1707-1716.
28
29. S. Chaudhari and M. Srinivasan, J Mater Chem, 2012, 22, 23049-23056.
29
30. J. Cao, T. Zhang, F. Li, H. Yang and S. Liu, New. J. Chem., 2013, 37,
30
2031-2036.
31
31. J. Shin, S. J. Choi, I. Lee, D. Y. Youn, C. O. Park, J. H. Lee, H. L.
32
Tuller and I. D. Kim, Adv. Funct. Mater., 2013, 23, 2357-2367.
33
32. D. J. Yang, I. Kamienchick, D. Y. Youn, A. Rothschild and I. D. Kim,
34
Adv. Funct. Mater., 2010, 20, 4258-4264.
35
33. K. I. Choi, S. J. Hwang, Z. F. Dai, Y. C. Kang and J. H. Lee, RSC Adv.,
36
2014, 4, 53130-53136.
37
34. S. J. Kim, I. S. Hwang, C. W. Na, I. D. Kim, Y. C. Kang and J. H. Lee, J.
38
Mater. Chem., 2011, 21, 18560-18567.
39
35. N. Ma, K. Suematsu, M. Yuasa and K. Shimanoe, ACS Appl. Mater. &
40
Interfaces, 2015, 7, 15618-15625.
41
36. S. Vallejos, T. Stoycheva, P. Umek, C. Navio, R. Snyders, C.
42
Bittencourt, E. Llobet, C. Blackman, S. Moniz and X. Correig, Chem.
43
Commun., 2011, 47, 565-567.
44
37. I. S. Hwang, J. K. Choi, H. S. Woo, S. J. Kim, S. Y. Jung, T. Y. Seong,
45
I. D. Kim and J. H. Lee, ACS Appl. Mater. & Interfaces, 2011, 3,
3140-46
3145.
47
38. J. Jang, S. Kim, S.-J. Choi, N.-H. Kim, H. Meggie, A. Rothschild and
I.-48
D. Kim, Nanoscale, 2015, 7, 16417.
49
39. Z. Heger, S. Skalickova, O. Zitka, V. Adam and R. Kizek,
50
Nanomedicine, 2014, 9, 2233-2245.
51
40. N. H. Kim, S. J. Choi, D. J. Yang, J. Bae, J. Park and I. D. Kim, Sens.
52
Actuators B, 2014, 193, 574-581.
53
41. V. N. Mishra and R. P. Agarwal, Microelectr. J., 1998, 29, 861-874.
54
42. H. R. Kim, K. I. Choi, J. H. Lee and S. A. Akbar, Sens. Actuators B,
55
2009, 136, 138-143.
56
43. E. Rossinyol, A. Prim, E. Pellicer, J. Arbiol, F. Hernandez -Ramirez, F.
57
Peiro, A. Cornet, J. R. Morante, L. A. Solovyov, B. Z. Tian, T. Bo and
58
D. Y. Zhao, Adv. Funct. Mater., 2007, 17, 1801-1806.
59
44. J. W. Gardner, Sens. Actuators B, 1990, 1, 166-170.
60
45. Y. R. Wang, B. Liu, S. H. Xiao, H. Li, L. L. Wang, D. P. Cai, D. D.
61
Wang, Y. Liu, Q. H. Li and T. H. Wang, J. Mater. Chem. A, 2015, 3,
62
1317-1324.
63
46. B. Liu, D. P. Cai, Y. Liu, D. D. Wang, L. L. Wang, Y. R. Wang, H. Li,
64
Q. H. Li and T. H. Wang, Sens. Actuators B, 2014, 193, 28-34.
65
47. Z. Q. Hua, M. Yuasa, T. Kida, N. Yamazoe and K. Shimanoe, Thin
66
Solid Films, 2013, 548, 677-682.
67
48. M. Zhao, J. Huang and C.-W. Ong, Int. J. Hydrogen. Energ., 2013, 38,
68
15559-15566.
69
49. A. Boudiba, C. Zhang, P. Umek, C. Bittencourt, R. Snyders, M. G.
70
Olivier and M. Debliquy, Int. J. Hydrogen. Energ., 2013, 38,
2565-71
2577.
72
50. F. Chavez, G. F. Perez-Sanchez, O. Goiz, P. Zaca-Moran, R.
Pena-73
Sierra, A. Morales-Acevedo, C. Felipe and M. Soledad-Priego, Appl.
74
Surf. Sci., 2013, 275, 28-35.
75
51. S. Fardindoost, A. I. Zad, F. Rahimi and R. Ghasempour, Int. J.
76
Hydrogen Energ., 2010, 35, 854-860.
77
52. E. Ghadiri, A. Iraji zad and F. Razi, Synth. React. Inorg. M, 2007, 37,
78
453-456.
79
53. M. Zhao, J. X. Huang and C. W. Ong, Nanotechnology, 2012, 23,
80
315503.
81
54. J. Kukkola, M. Mohl, A. R. Leino, J. Maklin, N. Halonen, A.
82
Shchukarev, Z. Konya, H. Jantunen and K. Kordas, Sens. Actuators B,
83
2013, 186, 90-95.
84
55. H. Li, B. Liu, D. P. Cai, Y. R. Wang, Y. Liu, L. Mei, L. L. Wang, D. D.
85
Wang, Q. H. Li and T. H. Wang, J. Mater. Chem. A, 2014, 2,
6854-86
6862.
87
56. J. H. Ahn, J. Yun, Y. K. Choi and I. Park, Appl. Phys. Lett., 2014, 104,
88
013508.
89
57. Z. Y. Zhang, X. M. Zou, L. Xu, L. Liao, W. Liu, J. Ho, X. H. Xiao, C.
90
Z. Jiang and J. C. Li, Nanoscale, 2015, 7, 10078-10084.
91
58. X. W. Li, Y. Liu, J. C. Hemminger and R. M. Penner, ACS Nano, 2015,