HAL Id: hal-02353313
https://hal.archives-ouvertes.fr/hal-02353313
Submitted on 6 May 2020
HAL is a multi-disciplinary open access
archive for the deposit and dissemination of
sci-entific research documents, whether they are
pub-lished or not. The documents may come from
teaching and research institutions in France or
abroad, or from public or private research centers.
L’archive ouverte pluridisciplinaire HAL, est
destinée au dépôt et à la diffusion de documents
scientifiques de niveau recherche, publiés ou non,
émanant des établissements d’enseignement et de
recherche français ou étrangers, des laboratoires
publics ou privés.
High-throughput screening in niche-based assay
identifies compounds to target preleukemic stem cells
Bastien Gerby, Diogo F.T. Veiga, Jana Krosl, Sami Nourreddine, Julianne
Ouellette, André Haman, Geneviève Lavoie, Iman Fares, Mathieu Tremblay,
Véronique Litalien, et al.
To cite this version:
Bastien Gerby, Diogo F.T. Veiga, Jana Krosl, Sami Nourreddine, Julianne Ouellette, et al..
High-throughput screening in niche-based assay identifies compounds to target preleukemic stem cells.
Journal of Clinical Investigation, American Society for Clinical Investigation, 2016, 126 (12),
pp.4569-4584. �10.1172/JCI86489�. �hal-02353313�
High-throughput screening in niche-based
assay identifies compounds to target
preleukemic stem cells
Bastien Gerby, … , Philippe P. Roux, Trang Hoang
J Clin Invest. 2016;
126(12)
:4569-4584.
https://doi.org/10.1172/JCI86489
.
Current chemotherapies for T cell acute lymphoblastic leukemia (T-ALL) efficiently reduce
tumor mass. Nonetheless, disease relapse attributed to survival of preleukemic stem cells
(LSCs) is associated with poor prognosis. Herein, we provide direct evidence that
pre-LSCs are much less chemosensitive to existing chemotherapy drugs than leukemic blasts
because of a distinctive lower proliferative state. Improving therapies for T-ALL requires the
development of strategies to target pre-LSCs that are absolutely dependent on their
microenvironment. Therefore, we designed a robust protocol for high-throughput screening
of compounds that target primary pre-LSCs maintained in a niche-like environment, on
stromal cells that were engineered for optimal NOTCH1 activation. The multiparametric
readout takes into account the intrinsic complexity of primary cells in order to specifically
monitor pre-LSCs, which were induced here by the SCL/TAL1 and LMO1 oncogenes. We
screened a targeted library of compounds and determined that the estrogen derivative
2-methoxyestradiol (2-ME2) disrupted both cell-autonomous and non–cell-autonomous
pathways. Specifically, 2-ME2 abrogated pre-LSC viability and self-renewal activity in vivo
by inhibiting translation of MYC, a downstream effector of NOTCH1, and preventing
SCL/TAL1 activity. In contrast, normal hematopoietic stem/progenitor cells remained
functional. These results illustrate how recapitulating tissue-like properties of primary cells
in high-throughput screening is a promising avenue for innovation in cancer chemotherapy.
Research Article
Hematology
Stem cells
Find the latest version:
http://jci.me/86489/pdf
The Journal of Clinical Investigation
R E S E A R C H A R T I C L EIntroduction
Current cancer chemotherapy targets proliferating and metaboli-cally active cancer cells and efficiently reduces the tumor load. However, frequent relapses suggest the persistence of residual cancer stem cells that escaped treatment possibly due to a protec-tive microenvironment that blunts their chemosensitivities (1–3). The reliance of cancer stem cells on their microenvironments and on non–cell-autonomous pathways (3) together with the failure of mainstream chemotherapy in a significant proportion of patients points to an urgent need for novel drug screening strategies designed to target cancer stem cells in their niche.
Recent evidence based on ultradeep sequencing of targeted genomic regions in acute leukemias revealed the existence of long-lasting preleukemic hematopoietic stem cells within the bulk of leukemic cells that serve as a reservoir for disease progression (4, 5). While these cells are believed to resist therapy, direct evidence
for their distinctive chemosensitivities compared with leukemic blasts remains to be documented. In addition, treatment is limited by indiscriminate toxicity toward normal hematopoietic stem cells (HSCs). Therefore, the current challenge is to specifically target these preleukemic stem cells (pre-LSCs) that represent an extreme-ly rare subpopulation in patients (4–7) and are not easiextreme-ly amenable to high-throughput screening (HTS) for novel drug discovery.
Acute lymphoblastic leukemia (ALL) is the most frequent pediatric cancer. T cell ALL (T-ALL), representing 15%–20% of ALL, can be classified into major molecular subgroups charac-terized by overexpression of oncogenic transcription factors (8, 9) that include SCL/TAL1, a member of the basic helix-loop-helix (bHLH) family, and LMO1 and LMO2, two LIM-only pro-teins (10). We and others have previously shown that oncogenic transcription factors in acute leukemia reprogram non–stem cell populations into aberrantly self-renewing pre-LSCs (7, 11–14). Using transgenic mouse models expressing the human SCL and LMO1 oncogenes in the thymus (15, 16), we showed that pre-LSCs remain dependent on physiological signaling from the microenvironment, specifically on activation of the NOTCH1/MYC axis (14). Our observations underscore the crit-ical importance of a niche-based assay for pre-LSCs, to allow for the discovery of new classes of antileukemic drugs beyond those that have been identified so far using standard cell line screening. A challenge in HTS is the necessary miniaturization Current chemotherapies for T cell acute lymphoblastic leukemia (T-ALL) efficiently reduce tumor mass. Nonetheless, disease
relapse attributed to survival of preleukemic stem cells (pre-LSCs) is associated with poor prognosis. Herein, we provide direct evidence that pre-LSCs are much less chemosensitive to existing chemotherapy drugs than leukemic blasts because of a distinctive lower proliferative state. Improving therapies for T-ALL requires the development of strategies to target pre-LSCs that are absolutely dependent on their microenvironment. Therefore, we designed a robust protocol for high-throughput screening of compounds that target primary pre-LSCs maintained in a niche-like environment, on stromal cells that were engineered for optimal NOTCH1 activation. The multiparametric readout takes into account the intrinsic complexity of primary cells in order to specifically monitor pre-LSCs, which were induced here by the SCL/TAL1 and LMO1 oncogenes. We screened a targeted library of compounds and determined that the estrogen derivative 2-methoxyestradiol (2-ME2) disrupted both cell-autonomous and non–cell-cell-autonomous pathways. Specifically, 2-ME2 abrogated pre-LSC viability and self-renewal activity in vivo by inhibiting translation of MYC, a downstream effector of NOTCH1, and preventing SCL/TAL1 activity. In contrast, normal hematopoietic stem/progenitor cells remained functional. These results illustrate how recapitulating tissue-like properties of primary cells in high-throughput screening is a promising avenue for innovation in cancer chemotherapy.
High-throughput screening in niche-based assay
identifies compounds to target preleukemic stem cells
Bastien Gerby,1,2 Diogo F.T. Veiga,1,2 Jana Krosl,1 Sami Nourreddine,1,2 Julianne Ouellette,1,2 André Haman,1,2 Geneviève Lavoie,1,2 Iman Fares,1 Mathieu Tremblay,1,2 Véronique Litalien,1 Elizabeth Ottoni,1,2 Milena Kosic,1,2 Dominique Geoffrion,1,2 Joël Ryan,1 Paul S. Maddox,3 Jalila Chagraoui,1 Anne Marinier,1 Josée Hébert,4 Guy Sauvageau,1,4 Benjamin H. Kwok,1,2
Philippe P. Roux,1,2 and Trang Hoang1,2,5
1Institute for Research in Immunology and Cancer, and 2Molecular Biology Program, Faculty of Medicine, University of Montreal, Montreal, Quebec, Canada. 3Department of Biology, University of North
Carolina at Chapel Hill, Chapel Hill, North Carolina, USA. 4Leukemia Cell Bank of Quebec, Maisonneuve-Rosemont Hospital, Department of Medicine, and 5Department of Pharmacology and Physiology and
Department of Biochemistry, Faculty of Medicine, University of Montreal, Montreal, Quebec, Canada.
Note regarding evaluation of this manuscript: Manuscripts authored by scientists associated with Duke University, The University of North Carolina at Chapel Hill, Duke-NUS, and the Sanford-Burnham Medical Research Institute are handled not by members of the editorial board but rather by the science editors, who consult with selected external editors and reviewers.
Conflict of interest: The authors have declared that no conflict of interest exists. Submitted: January 13, 2016; Accepted: September 22, 2016.
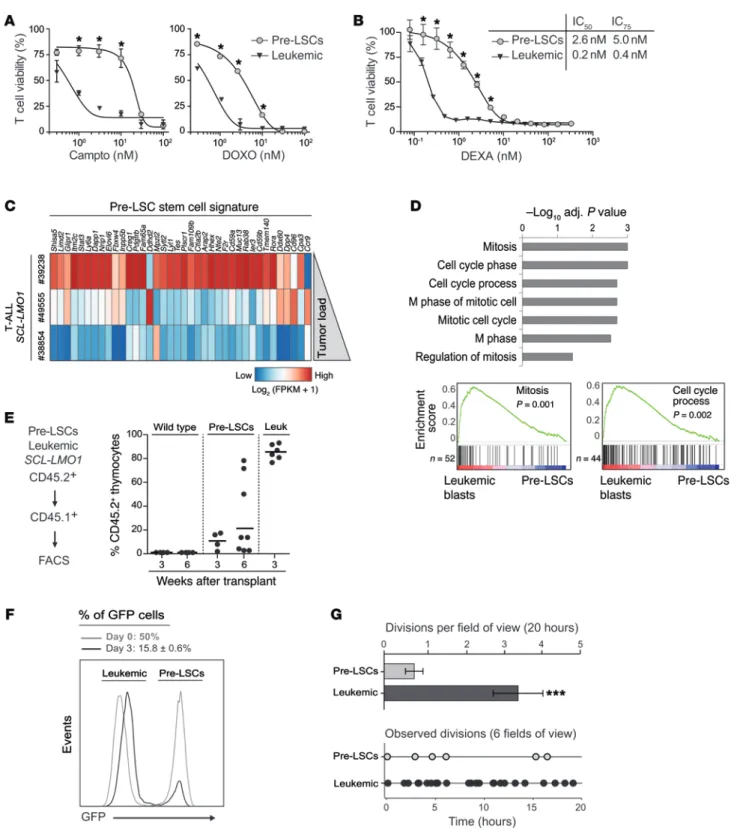
Figure 1. Proliferative leukemic blasts outcompete pre-LSCs and are more sensitive to chemotherapeutic agents. (A and B) Pre-LSCs are more resistant to the
treatment than leukemic cells. Pre-LSCs or fully transformed SCL-LMO1 leukemic blasts were cocultured on OP9-DL1 stromal cells and treated with camptothecin (Campto, A, left panel), doxorubicin (DOXO, A, right panel), or dexamethasone (DEXA, B) for 3 days. Viable T cells were assessed by FACS (mean ± SEM compared
with controls, n = 6, *P ≤ 0.05). Representative of 2 independent experiments. (C) Inverse correlation between pre-LSC gene signature (14) and tumor load in
Cd3e–/–SCL-LMO1 T-ALLs. Data from RNA sequencing of Cd3e–/–SCL-LMO1 T-ALLs were ranked according to the tumor load (Supplemental Figure 1A). (D) Gene set enrichment analysis for genes that are upregulated in leukemic blasts compared with pre-LSCs. Top panel: The top 7 gene ontology categories significantly enriched in T-ALL blasts (FWER P < 0.03). Bottom panel: Enrichment plots. (E) Pre-LSCs or leukemic blasts (5 × 10⁴ cells, CD45.2) from Cd3e–/–SCLtgLMO1tg mice or WT thymocytes were transplanted into recipient mice (CD45.1). Shown are the percentage of donor T cells (% CD45.2+Thy1.2+) per mouse analyzed 3 and 6 weeks
later. Horizontal lines, median of thymic engraftment. (F and G) Pre-LSCs exhibit low cell division frequency and are outcompeted by leukemic cells in vitro.
SCL-LMO1 leukemic cells (GFP–) and pre-LSCs (GFP+) were mixed in equal proportion and cultured for 3 days on OP9-DL1; GFP– and GFP+ cells were analyzed before (gray
curve) and after (black curve) coculture (F, n = 3). The numbers of divisions per field of observation during 20 hours (G, top panel, n = 4) and each individual division
observed at the indicated times in a total of 6 fields of view (G, bottom panel, n = 5–23) were then compared between GFP– and GFP+ cells by time-lapse imaging
The Journal of Clinical Investigation
R E S E A R C H A R T I C L Einitiating event is the establishment of an aberrant population of pre-LSCs found in both healthy and leukemic twins, with addi-tional transforming event(s) in the leukemic patient (7). The iden-tification of activating NOTCH1 mutations in over 60% of T-ALL patient samples in all molecular subgroups (17) rapidly led to the design of high-potency γ-secretase inhibitors (GSIs) targeting NOTCH1 signaling. GSIs are well tolerated with staggered dosing of a stromal-based coculture assay into a reproducible assay
with a quantitative readout.
At the cellular level, these pre-LSCs serve as a reservoir for acquisition of Notch1 gain-of-function mutations (16) that reca-pitulate those identified in the human disease (17). Therefore, the mouse model closely mimics the leukemogenic process in humans, initially reported in monochorionic twins in which the
Figure 2. High-throughput assay for primary pre-LSCs in thymic-like microenvironment. (A and B) Generation of an optimal MS5-DL4 stromal cell line
for pre-LSC viability. Following DL4 gene transfer, MS5 stromal cells were assessed for DL4 surface expression levels. Three MS5 subclones were purified according to levels of DL4 expression (low, medium, and high) (A). DN3 preleukemic SCLtgLMO1tg thymocytes were cocultured with MS5-CTL or MS5-DL4lo, -DL4med, or -DL4hi stromal cells during 5 days, and the absolute number of DN3 cells was assessed using FACS. Each dot represents an individual well, and dashed lines represent the mean for each condition (B). (C) Purified DN3 WT and preleukemic SCLtgLMO1tg thymocytes were cocultured with MS5-DL4lo stromal cells. DN3-derived thymocytes were immunophenotyped 5 days later using the CD4, CD8, CD25, and CD44 markers. (D) Miniaturized coculture
system for HTS-FACS in 384-well plate. The proportion of DN3 (left panel) and DP (right panel) thymocytes was then assessed using HTS-FACS, and assay reproducibility was calculated. Each dot represents an individual well. Solid lines and dashed lines represent the mean and 3-fold the SD, respectively. The Z′ factor is a statistical measure of the robustness of the HTS assay (ideally between 0.5 and 1). Representative of 3 independent experiments. (E and
F) DN3 preleukemic SCLtgLMO1tg thymocytes were cocultured with MS5-DL4lo stromal cells for 5 days in the presence or absence (Vehicle) of γ-secretase
inhibitor (GSI, 1 μM), and the absolute number of DN3 cells was assessed using HTS-FACS. Representative FACS analysis of DN population is shown (E) together with assay reproducibility (F).
than pre-LSCs, hence their higher sensitivities to topoisomerase inhibitors. The enrichment in cell cycle genes was manifested in vivo by the kinetic of thymic reconstitution after transplanta-tion into sublethally irradiated congenic recipient mice (Figure 1E). Within 3 weeks, T-ALL blasts rapidly and massively invaded the thymus (Figure 1E), spleen, and BM (Supplemental Figure 1B), while pre-LSCs induced a modest and heterogeneous thy-mic reconstitution at 3 weeks after transplantation and even at 6 weeks, without engrafting other organs. As expected, WT thymo-cytes did not engraft (Figure 1E and Supplemental Figure 1B). To directly address the question of whether leukemic blasts are more competitive than self-renewing pre-LSCs, we set up an equal-split competition in which equal proportions (50%) of GFP+ pre-LSCs
from SIL-SCL Lck-LMO1 double-transgenic mice (SCLtgLMO1tg
mice), which express the human SCL and LMO1 genes, and non-GFP leukemic cells were cultured on OP9-DL1 (Figure 1F). Within 3 days, T-ALL blasts outcompeted pre-LSCs in culture as observed by the 3-fold reduction of the proportion of GFP+ pre-LSCs (Figure
1F). Furthermore, time-lapse imaging (Supplemental Figure 1C) of this equal-split competitive assay performed 6 hours after plat-ing revealed that the division rate of leukemic cells was 4 times higher than that of pre-LSCs (Figure 1G).
Together, our results demonstrate that pre-LSCs have a low pro-liferative status and are more resistant than leukemic cells to cur-rent chemotherapeutic drugs that target proliferating cells, such as doxorubicin. Based on the evidence that pre-LSCs caused relapse (6), these cells represent the prime target for new drug development.
Design of a high-throughput screening protocol based on pre-LSC viability in a niche-like microenvironment. Several essential param-eters needed to be integrated into the design of a robust pre-LSC– based assay for high-throughput screening (HTS). First, pre-LSCs are extremely rare in leukemic patient samples, requiring exten-sive purification by flow cytometry and ultradeep sequencing to reveal mutations that occur in these cells (4, 24). This is because pre-LSCs are much less competitive than leukemic blasts, as shown above, and are highly diluted in the leukemic mass at the time of overt leukemia. We took advantage of the preleukemic stage in transgenic mouse models to have unrestricted access to a reproducible source of pre-LSCs. These cells were harvested at weaning, long before the acquisition of secondary mutations and leukemia onset (16). Second, we opted for a phenotypic screen for several reasons. Given the molecular diversity of T-ALL, we reasoned that a phenotypic screen using primary pre-LSCs has a higher likelihood of identifying small-molecule inhibitors of self-renewal, rather than targeting the diversity of oncogenes in the 5 molecular subgroups of T-ALL (10, 26). In addition, pre-LSCs in 3 different genetic models of T-ALL of the bHLH subgroup are DN3 cells (12, 14, 27), and rely on the same self-renewal genes for main-tenance in vivo (12, 14, 27), reinforcing the suitability of this popu-lation as target. Moreover, a multiparametric phenotypic screen takes into account the heterogeneity of primary cells (14, 28) and allows for a quantitative assessment of this specific subset of cells based on surface phenotype.
Finally, we previously showed that pre-LSCs conserve their dependence on the thymic microenvironment and require cocul-ture on OP9 stromal cells expressing delta-like 1 (DL1) for surviv-al in culture (14), much like their normsurviv-al counterparts (29). We in several phase I clinical trials (18, 19). Nonetheless, efficient
anti-leukemic activity might require sustained administration, which in turn could be a limiting factor (20). Interestingly, MYC is an essential downstream effector of NOTCH1 in T-ALL (21, 22), and decreasing Myc expression via a BRD4 inhibitor effectively killed leukemia-initiating cells (23).
As discussed above, pre-LSCs are more genetically and pheno-typically stable (14) than leukemia-propagating cells, which have acquired different sets of secondary mutations (16, 24). Impor-tantly, we provided genetic evidence that self-renewal activity is a major determinant of leukemogenesis (14), further underscoring the importance of pre-LSC–based screening to identify novel anti-leukemic compounds. A major advantage of the mouse model is to provide unrestricted access to pre-LSCs (14).
Here, we demonstrate that pre-LSCs are much less sensitive to current treatment than the leukemic bulk, underscoring the importance of novel therapeutic development targeting pre-LSCs. We built on mechanistic insight gained in our previous work (14) to develop a robust protocol for a phenotypic screen with SCL-LMO1–induced pre-LSCs cultured within their niche-like micro-environment. Using FDA-approved compounds and drug-like small molecules, we identified 2-methoxyestradiol (2-ME2) as a new promising drug that abrogates pre-LSC viability and self-renewal activity by inhibiting MYC translation and SCL accumu-lation, thereby antagonizing cell-autonomous as well as non–cell-autonomous pathways.
Results
Pre-LSC low chemosensitivity and low proliferation rate. Pre-LSCs are believed to be chemoresistant and to drive relapse (4, 24), although direct evidence for differential chemosensitivity between leukemic blasts and pre-LSCs remains to be documented. We took advantage of genetic mouse models to directly address the dis-tinctive properties of pre-LSCs compared with fully transformed cells using in vitro and in vivo approaches. We previously showed that Cd3e+/+ or Cd3e–/– DN3 thymocytes are the only pre-LSC–
enriched population in mice expressing SCL-LMO1 (14), hereaf-ter “pre-LSCs.” First, we compared the response of pre-LSCs and T-ALL blasts to 2 commonly used inhibitors of DNA replication, doxorubicin and camptothecin (Figure 1A). Dose-response curves indicate that leukemic cells are 10- to 20-fold more sensitive to the 2 drugs than pre-LSCs in vitro. Moreover, this difference was also observed with dexamethasone (DEXA; Figure 1B), a glucocorti-coid often used for stratification and treatment of childhood and adult T-ALL (25). We conclude that pre-LSCs are poorly respon-sive to current chemotherapeutic drugs.
We next analyzed by RNA sequencing the transcriptomes of 3 SCL-LMO1 T-ALLs taken at different stages of leukemia devel-opment, as assessed by the tumor load. Strikingly, we found that the pre-LSC stem cell gene signature (14) was inversely correlated with the tumor load, supporting the view that pre-LSCs were pro-gressively outcompeted by more aggressive leukemic cells (Figure 1C and Supplemental Figure 1A; supplemental material available online with this article; doi:10.1172/JCI86489DS1). Conversely, the top gene ontology categories associated with acute leukemia compared with the preleukemic stage are mitosis and cell cycle (Figure 1D), indicating that leukemic blasts are more proliferative
The Journal of Clinical Investigation
R E S E A R C H A R T I C L Eappropriate for a robust chemical HTS assay that requires sev-eral days of drug exposure. We generated MS5 stromal cell lines expressing different levels of the most physiological NOTCH1 ligand, delta-like 4 (DL4) (31, 32), for coculture with SCLtgLMO1tg
therefore designed a miniaturized coculture assay for pre-LSC viability in their “habitat.” To this end, we replaced OP9 cells, which need replating every 3 days, with MS5 stromal cells, which can be maintained for at least 7 days in culture (30) and are more
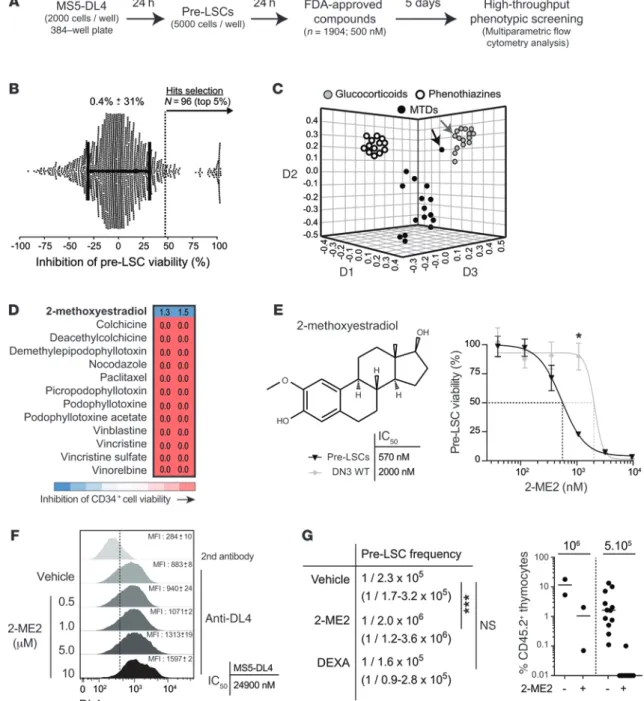
Figure 3. Small-molecule screening identifies 2-ME2 as an inhibitor of pre-LSCs. (A) Experimental procedure for chemical screening of pre-LSCs. (B) The
inhibi-tion of pre-LSC viability was calculated for each compound (GSI set as 100% and DMSO as 0%; average pre-LSC viability: 0.4%). The top 5% (n = 96) of hits were selected. (C) Clustering of 44 selected compounds by structural similarities using the ChemMine tool (http://chemmine.ucr.edu/). The multidimensional scaling
algorithm maps a compound described by its chemical structure into a 3D space and where neighbor compounds exhibit similar molecular structure. The axes (D1, D2, and D3) refer to the dimensions generated by the multidimensional scaling. Black arrow identifies 2-ME2 and gray arrow DEXA. MTDs, microtubule-targeting drugs. (D) 2-ME2 is the only MTD that does not affect the viability of human HSCs. Human CD34+ peripheral blood was collected from cord blood cells
and treated with the indicated MTDs at 1 μM during 1 week as described previously (38). Numbers (n = 2) represent the fractions of viable cells compared with vehicle control. (E) 2-ME2 structure (top left panel) and dose-response on purified pre-LSCs and DN3 WT thymocytes. The percentages of cell viability are shown
(right panel, n = 6, *P ≤ 0.05). IC50 was calculated (bottom left panel). Representative of 2 independent experiments. (F) MS5-DL4 stromal cells alone were
treated in the same conditions. DL4 expression was assessed by FACS (left panel, n = 2), and IC50 for cell viability was calculated (right panel, n = 2). (G) Treated
and untreated viable cells were then transplanted by limiting dilution assay into recipient mice according to Supplemental Figure 5A. Thymic engraftment was analyzed 6 weeks after transplantation, and pre-LSC frequencies were calculated (left panel) by Poisson statistics (CIs in parentheses; ***P ≤ 0.001). Right panel: Thymic reconstitution by control or 2-ME2–treated cells.
pre-LSCs (Figure 2A). We found that MS5-DL4lo cells sustained
viability of SCLtgLMO1tg pre-LSCs more efficiently than MS5
expressing higher DL4 levels (Figure 2B). We therefore selected MS5-DL4lo (hereafter “MS5-DL4”) for further experiments.
These coculture conditions favored the differentiation of puri-fied WT DN3 thymocytes to the double-positive (DP) stage within 5 days (Figure 2C). In contrast, SCL-LMO1–expressing pre-LSCs remained blocked at the DN3 stage during the same time frame
Figure 4. 2-ME2 inhibits the accumulation of SCL protein. (A) Pre-LSCs from SCLtgLMO1tg thymocytes were treated with 2-ME2 (1 μΜ) or DEXA (5 nM)
for 16 hours, and mRNA levels of SCL and SCL target genes Lyl1 and Hhex were determined by quantitative RT-PCR and normalized to β-actin (mean ± SD, n = 3, *P ≤ 0.05, **P ≤ 0.01, ***P ≤ 0.001). (B) 2-ME2 inhibits the activity of the SCL transcriptional complex. The Gypa promoter (Gypa-Luc) was used
as a reporter. Transfected cells were then treated or not (Vehicle) with 2-ME2 (1 μM) or DEXA (2 nM) for 24 hours. Results are expressed as fold activation by SCL over the complex without SCL. Data represent the mean ± SD (n = 3, ***P ≤ 0.001). (C) Immunofluorescence of human SCL oncoprotein by flow
cytometry in pre-LSCs from SCLtgLMO1tg thymocytes treated with the indicated doses of 2-ME2 or not (Vehicle) for 16 hours. DN3 WT thymocytes stained with antibody against SCL and cells stained with the secondary antibody only were used as negative controls. (D and E) Real-time imaging of HeLa
cells expressing SCL-GFP or H2B-RFP in the presence or absence of 2-ME2 (1 μM). Kinetic of GFP (top panels) and RFP (bottom panels) expression in a representative treated or untreated cell is shown (D), and the averages of mean fluorescence intensities (MFIs) for each time point were calculated (E).
MFIs were normalized to the initial intensity of the corresponding cell, which was set as 100%. (F) JURKAT cells were treated with 2-ME2 (1 μM) for the
indicated times, and nuclear extracts were subjected to immunoblotting. Pol II, RNA polymerase II. (G and H) SCL and histone H3 intracellular
immuno-fluorescence staining in JURKAT cells treated or not with 2-ME2 (1 μM) for 8 hours. The normalized corrected total cell immuno-fluorescence (CTCF) per nucleus of SCL (n = 27–98, ***P ≤ 0.001) and H3 (n = 42–60) was calculated (G). A representative example of SCL (left panel) and H3 (right panel) expression is
The Journal of Clinical Investigation
R E S E A R C H A R T I C L E(Figure 2C), reproducing the differentiation arrest observed in vivo (33, 34). Similar results were observed when the assay was miniaturized in 384-well format (Figure 2D). Finally, as proof of concept for the screen, cultures were exposed to GSI at 1 μM or to the vehicle alone (Figure 2, E and F). The drug was added 12 hours after seeding to allow for pre-LSC–stromal interaction before treatment. GSI strongly and reproducibly killed pre-LSCs as reported (14), with a robust Z′ factor. By taking into account the heterogeneity of primary cells (14, 28) and the necessity of niche-like microenvironments (14), the designed phenotypic screen allows for a quantitative assessment of pre-LSCs. We therefore conclude that the assay is suitable for HTS.
Small-molecule screening and identification of an inhibitor of pre-LSC self-renewal activity. Using the above protocol, we screened a library of 1,904 compounds on pre-LSC viability (Figure 3, A and
B, and Supplemental Figure 2). GSI (14) served as an internal ref-erence for the screen (Figure 3B and Supplemental Figure 2). The majority of tested compounds had no effect on pre-LSC viability, underscoring the selectivity of the assay and the specificity of the hits. We selected the top 5% of hits that reduced the viability of pre-LSCs (Figure 3B, range of 45%–100% inhibition). While our assay conditions enable the identification of potential inducers of differentiation (Figure 2D and Supplemental Figure 2), no com-pound was found to overcome the DN to DP differentiation block-ade imposed by SCL-LMO1. We then applied 3 criteria to filter the viability hits. First, compounds were clustered according to struc-tural similarities (http://chemmine.ucr.edu/). Second, we deter-mined compound selectivity by comparing our results with those obtained in a screen of 20 primary acute myeloid leukemia (AML) specimens (Supplemental Table 1), based on the premise that
pri-Figure 5. 2-ME2 inhibits glucocorticoid-resistant T-ALL cells and targets MYC protein synthesis. (A) Dose-response curves of DEXA (left panel) and 2-ME2
(right panel) of 4 human T-ALL cell lines (JURKAT, KOPTK1, P12-ICHIKAWA, and HPB-ALL) treated for 48 hours (mean ± SEM, n = 3, *P ≤ 0.05). Cell viability was assessed by FACS (percent control). (B) Levels of SCL and c-MYC protein expression were determined by Western blot in the 3 indicated T-ALL cell
lines after total protein extraction. (C–E) JURKAT, KOPTK1, and P12-ICHIKAWA cells were treated for 16 hours with the indicated doses of 2-ME2. Nuclear
protein extracts were subjected to immunoblotting with the indicated antibodies. α-Actin was used as a loading control. (F) SCL and c-MYC half-lives were determined in JURKAT (SCL+c-MYC+) and KOPTK1 (c-MYC+) T-ALL cells by cycloheximide chase and Western blotting according to Supplemental Figure 9D.
Representative of 2 independent experiments. (G) JURKAT, KOPTK1, and P12-ICHIKAWA cells were treated for 16 hours with the indicated doses of 2-ME2.
Total protein extracts were subjected to immunoblotting with the indicated antibodies. α-Tubulin was used as a loading control. Representative of 2 inde-pendent experiments. (H) JURKAT cells were treated with 2-ME2 (3 μM) or not (Vehicle) during 3 hours in the presence of 35S-methionine. SCL (top panel)
and c-MYC (bottom panel) immunoprecipitation was then performed on labeled proteins. Immunoglobulins were used as control of immunoprecipitation (IP CTL). Radiolabeling was revealed using a PhosphorImager. (I) T-ALL blasts from a thymoma of SCLtgLMO1tg mice were treated for 16 hours with the indi-cated doses of 2-ME2. The human SCL transgene and endogenous c-MYC protein expression levels were then determined by immunoblotting. α-Actin was used as a loading control. Representative of 2 independent experiments.
group included compounds of the phenothiazine family (Figure 3C and Supplemental Table 2) that were recently identified in a screen on MYC-induced T-ALL in zebrafish (35), demonstrating the convergence of 2 functional screens, 1 based on whole-animal and the other on organotypic cultures of primary cells. Interest-ingly, glucocorticoids and phenothiazines with the exception of perphenazine (35) mostly spared the AML samples that were test-ed (Supplemental Figure 3), indicating the discriminatory power mary human AML cells are significantly different from T-ALL.
Third, we searched for compounds that spare normal hematopoi-etic stem/progenitor cells (HSPCs).
Among the viability hits, 42 compounds clustered in 3 major groups (Figure 3C and Supplemental Table 2). The first group included 15 glucocorticoids, well-known inducers of thymocyte apoptosis (Figure 3C and Supplemental Table 2), in particular DEXA, which is currently used in T-ALL treatment. The second
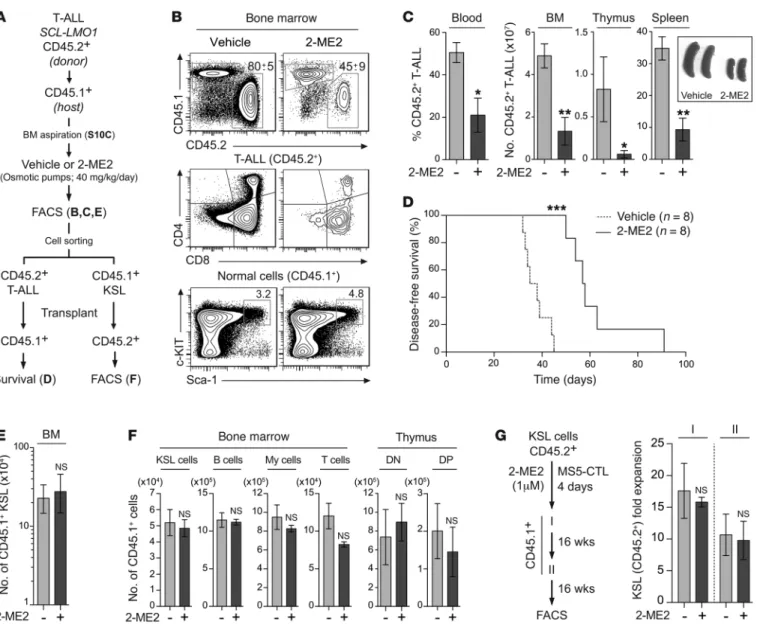
Figure 6. 2-ME2 inhibits T-ALL development without affecting HSC functions in vivo. (A) Experimental procedure to study the in vivo effect of 2-ME2 on
T-ALL development and HSC functions in a preclinical model. (B) Representative FACS profiles of CD45.2 (donor) and CD45.1 (host) expression in the BM cells
of mice treated or not (Vehicle) with 2-ME2 (top panel). The expression of CD4/CD8 and c-Kit/Sca-1 markers is shown in CD45.2+ T-ALL cells (middle panel)
and CD45.1+lineage– cells (bottom panel), respectively. (C) The proportion of T-ALL blasts (CD45.2+) was assessed in the blood (n = 5). Absolute numbers of
T-ALL blasts (CD45.2+) from the BM, thymus, and spleen were calculated, and pictures of spleens are shown (right panel, n = 5, *P ≤ 0.05, **P ≤ 0.01). (D)
Kaplan-Meier survival curve of secondary CD45.1+ mice transplanted with T-ALL blasts from 2-ME2–treated and untreated primary recipient (***P ≤ 0.001).
(E) Absolute numbers of HSC-enriched populations (KSL) from the BM of recipient mice (CD45.1+) were calculated after treatment (n = 5). (F) Absolute
numbers of donor-derived CD45.1+ HSCs (KSL) and B, myeloid (My), and T cells in the BM of secondary CD45.2+ recipient mice were calculated 14 weeks after
transplantation (n = 5). Absolute numbers of donor-derived CD45.1+ thymocytes (DN and DP) were calculated in the thymus (n = 5). There was no significant
difference between controls and 2-ME2–treated conditions. (G) KSL cells from the BM of CD45.2+ mice were purified and treated or not with 2-ME2 (1 μM) on
MS5-CTL cells during 4 days. Treated and untreated cells were then transplanted into primary and secondary lethally irradiated CD45.1+ mice (left panel,
n = 3–5). The fold expansions of CD45.2+ KSL cells in the BM were calculated after primary and secondary transplantation. There was no significant
The Journal of Clinical Investigation
R E S E A R C H A R T I C L E2-ME2 did not affect the numbers of Lin–CD34+ cells compared
with vehicle-treated control cultures (Figure 3D).
2-ME2 is an estrogen derivative that does not bind the estrogen receptor (ER) (36), and estrogens impaired pre-LSCs at micromolar concentrations only, well outside their bioactive range (Supplemental Figure 4A), indicating an ER-independent mechanism. Rather, 2-ME2 is an MTD (36). Dose-response curves of 2-ME2 on SCLtgLMO1tg pre-LSCs and normal DN3
thy-mocytes revealed IC50 of 570 nM and 2 μM, respectively (Figure 3E), suggesting that the SCL-LMO1 oncogenes sensitize DN3 of our screening strategy. The whole library included 14
microtu-bule-targeting drugs (MTDs), and all were active in our assay (Fig-ure 3C and Supplemental Table 2). Strikingly, 2-methoxyestradiol (2-ME2) (36) exhibits structural differences from other MTDs sug-gesting distinctive properties (Figure 3C). Indeed, 2-ME2 is the only MTD for which we observed a differential response in AML cells (Supplemental Figure 3). Finally, MTDs have well-known toxicities toward HSPCs (37). When tested against purified human Lin–CD34+ cells from normal cord blood (38), all MTDs except
2-ME2 totally inhibited cell viability (Figure 3D). Interestingly,
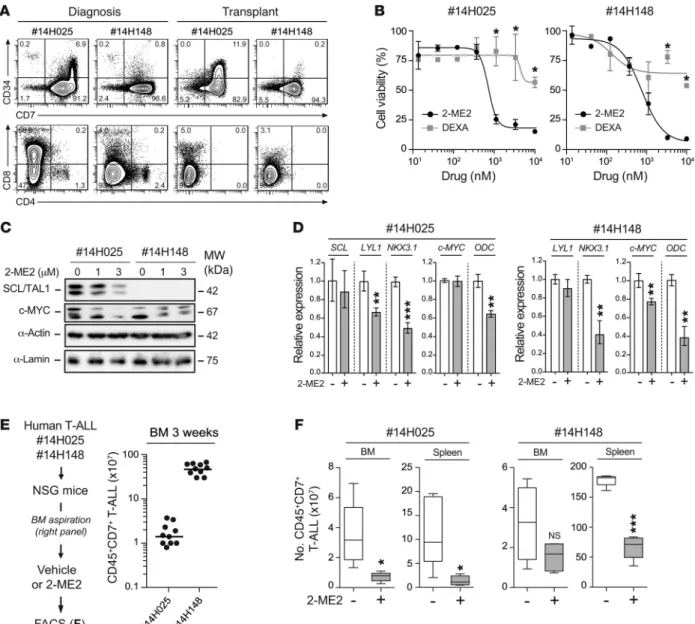
Figure 7. 2-ME2 reduces human T-ALL development in xenograft models. (A) Immunophenotype of human T-ALL samples (nos. 14H025 and 14H148) at
diagno-sis and after transplantation in NSG mice. The expression of human CD34/CD7 and CD4/CD8 markers of peripheral blood cells from the patients (left panel) and of engrafted human CD45+ T-ALL blasts in the BM of NSG mice 6 weeks after transplantation (right panel) is shown. (B) Purified engrafted human CD45+CD7+
T-ALL blasts from patients 14H025 and 14H148 were cocultured on MS5-DL4 stromal cells with a dose-response of 2-ME2 and DEXA for 4 days (n = 3, *P ≤ 0.05). The percentages of cell viability are shown for both patients. (C) Blasts from both patients were treated with the indicated doses of 2-ME2 for 16 hours. SCL
and c-MYC protein expression levels were determined by immunoblotting. (D) Blasts were treated with 1 μM of 2-ME2 during 16 hours, and mRNA expression
levels of the indicated genes were assessed by quantitative RT-PCR and were normalized to β-actin mRNA (n = 3, **P ≤ 0.01, ***P ≤ 0.001). (E) Experimental procedure to study the effect of 2-ME2 on human T-ALL in vivo (left panel). Engrafted T-ALL blasts of both patients were transplanted into secondary NSG mice (n = 10), and the proportion of CD45+CD7+ T-ALL blasts in BM aspirations was assessed 3 weeks after transplantation (right panel). (F) Engrafted secondary mice
were randomly selected for treatment or not (Vehicle, n = 5) with 2-ME2 (40 mg/kg/d, n = 5) using osmotic pumps during 7 days. Human T-ALL reconstitution (number of CD45+CD7+ blasts) was monitored by FACS in the BM and the spleen (*P ≤ 0.05, ***P ≤ 0.001).
Similarly, we found that 2-ME2 decreased endogenous SCL protein levels in the SCL+ JURKAT T-ALL cell line, starting at 4–6
hours after treatment (Figure 4F), exactly as observed with trans-fected SCL in HeLa cells (Figure 4, D and E). Finally, our immu-nofluorescence approach confirmed that 2-ME2 decreases SCL without modifying histone H3 nuclear expression levels (Figure 4, G and H). 2-ME2 is a microtubule depolymerizing agent (43). To assess the possibility that decreased SCL protein levels could be secondary to the perturbation of microtubule dynamics, we treated JURKAT T cells with colchicine, a well-characterized microtubule depolymerizing drug. While colchicine also inhibited cell growth (Supplemental Figure 7A), this occurred in the absence of a noticeable effect on SCL protein levels (Supplemental Figure 7B). Together, these results demonstrate that 2-ME2 impairs SCL expression via a colchicine-independent mechanism.
2-ME2 targets 2 pathways: inhibition of SCL and MYC. Resistance to glucocorticoids is an adverse prognostic factor in T-ALL both at presentation and in relapse (44). We found that 2-ME2 induced apoptosis (Supplemental Figure 8A, right panel, and Supplemental Figure 8B) and efficiently inhibited the viability of human T-ALL cell lines (Figure 5A, right panel) that are either corticosensitive (P12-ICHIKAWA) or corticoresistant (JURKAT, KOPTK1, and HPB-ALL; Figure 5A, left panel, and Supplemental Figure 8A, left panel). Furthermore, 2-ME2 did not modify the corticoresistance of JURKAT cells (Supplemental Figure 8C, left panel) nor the cor-ticosensitivity of P12-ICHIKAWA cells (Supplemental Figure 8C, right panel) or of SCL-LMO1 pre-LSCs (Supplemental Figure 8D), indicating that the activity of 2-ME2 is cortico-independent.
Consistent with the reported dependence of JURKAT cell viability on SCL (45), we observed that SCL protein expression in JURKAT cells (Figure 5B) was inhibited by 2-ME2 in a dose-dependent manner (Figure 5C) in exactly the same range as cell growth inhibition (~500 nM). This was associated with the down-regulation of SCL target gene NKX3.1 (ref. 45 and Supplemental Figure 8E, left panel), while SCL mRNA levels were not modified by 2-ME2, as observed in pre-LSCs.
We previously showed that the self-renewal node in pre-LSCs depends not only on the SCL oncogene but also on the NOTCH1/ MYC axis (14), a non–cell-autonomous pathway triggered by Delta-like NOTCH1 ligand. Importantly, 2-ME2 did not affect NOTCH1 target genes including Myc in pre-LSCs (Supplemental Figure 9A), ruling out the possibility that 2-ME2 could affect a general mecha-nism of NOTCH1 activation triggered by ligand endocytosis (46). In contrast, 2-ME2 decreased MYC protein levels in pre-LSCs (Supplemental Figure 9B). Interestingly, all tested T-ALL cell lines exhibit elevated MYC protein levels (Figure 5B and Supplemental Figure 9C), which were nearly abrogated by 2-ME2 (Figure 5, C and D), whereas MYC mRNA levels were unaffected (Supplemen-tal Figure 8E, right panel). Strikingly, this inhibitory activity was not observed with 2 other factors controlling the self-renewal node in normal HSCs, HOXA9 and HOXB4, or with the SCL protein partner E2A (Figure 5E). Together, these results indicate a selec-tive and previously unreported inhibitory effect of 2-ME2 on SCL and MYC protein levels.
Decreased SCL and MYC protein levels were not due to pro-tein degradation, since 2-ME2 did not modify SCL and MYC half-lives (t1/2), as determined by cycloheximide chase in all 3 T-ALL thymocytes to 2-ME2. Furthermore, we observed that the
non-toxic doses of 2-ME2 did not affect the capacity of WT DN3 thy-mocytes to generate DP cells in vitro (Supplemental Figure 4B), indicating that 2-ME2 did not block normal T cell differentiation within the tested range. In addition, we excluded the possibility that decreased pre-LSC viability could be secondary to stromal cell failure, since MS5-DL4 cell viability as well as DL4 surface expression was not affected by 2-ME2 at concentrations as high as 10 μM (Figure 3F).
2-ME2 exhibits structural similarity to DEXA (Figure 3C). We therefore compared their activities on the self-renewal of pre-LSCs following in vitro treatments with 1 μM 2-ME2 or 5 nM DEXA (Supplemental Figure 5A), corresponding to 75% inhibition in vitro (Figure 3E and Figure 1B). Pre-LSC frequency and activ-ity were quantitatively assessed in vivo, by transplantation in irra-diated congenic mice in limiting dilution assays (Supplemental Figure 5A). As shown in Figure 3G (and Supplemental Figure 5B), there was a striking difference between DEXA and 2-ME2. Even though both compounds were used at a dose of 75% inhibition in vitro, SCLtgLMO1tg pre-LSCs fully recovered from DEXA treatment
in culture and their self-renewal activity in vivo was not altered, concurring with the view that pre-LSCs are spared by current treatment (4, 24). In contrast, 2-ME2 reduced pre-LSC frequency 10-fold (Figure 3G and Supplemental Figure 5) and is therefore a drug candidate for T-ALL treatment.
2-ME2 inhibits SCL accumulation and transcriptional activ-ity. At the molecular level, 2-ME2 but not DEXA decreased the expression of the SCL-dependent self-renewal genes (14) Lyl1 and Hhex without affecting mRNA levels of SCL (Figure 4A). Since pre-LSC self-renewal activity depends on the capacity of SCL to activate transcription (14), we next addressed the question of whether 2-ME2 inhibits SCL transcription activity, using a quan-titative reporter assay (39, 40). We observed that 2-ME2 but not DEXA inhibited SCL activity in transient transcription assays (Fig-ure 4B), consistent with the suppression of endogenous SCL tar-get genes in pre-LSCs (Figure 4A). These results concur with our functional studies (Figure 3G) and indicated that 2-ME2 inhibits pre-LSC self-renewal activity via inhibition of SCL.
Recent evidence suggests an important nonmitotic function of 2-ME2, in preventing the nuclear accumulation of transcrip-tion factors or DNA repair proteins (41, 42). We therefore quanti-tated SCL at the single-cell level by flow cytometry and found that 2-ME2 caused a dose-dependent inhibition of the human SCL oncoprotein in SCLtgLMO1tg pre-LSCs (Figure 4C). We examined
the fate of the SCL protein by live cell imaging throughout the time exposure to 2-ME2. To this end, we delivered SCL-GFP into HeLa cells. We then followed GFP expression in individual cells in the presence or absence of 2-ME2 for 16 hours, a time point chosen based on HeLa full viability in drug-treated cultures (Supplemen-tal Figure 6A). SCL-GFP expression in the nucleus of 2-ME2– treated cells decreased steadily compared with that in untreated cells (Figure 4, D and E, top panels, and Supplemental Figure 6B). In contrast, 2-ME2 treatment of HeLa cells stably expressing the nuclear protein histone H2B-RFP did not modify the level of RFP expression during the same time lapse (Figure 4, D and E, bottom panels, and Supplemental Figure 6C), showing that 2-ME2 specifi-cally targets SCL accumulation.
The Journal of Clinical Investigation
R E S E A R C H A R T I C L E2-ME2–treated HSPCs remain functional. Finally, in vitro treat-ment with 2-ME2 for 4 days was sufficient to alter pre-LSC activ-ity (Figure 3G), while normal HSPCs (KSL) retained self-renewal activity (Figure 6G) and multipotency (Supplemental Figure 11C) in serial transplantation assays. Therefore, this preclinical model of T-ALL indicates that normal HSPCs remain functional after in vivo exposure to 2-ME2, concurring with the reported lack of myelosuppression in clinical trials (36). Similarly, normal T cells were at least 4-fold less sensitive to 2-ME2, corresponding to an inability to downregulate MYC. In contrast, 2-ME2 reduced T-ALL blasts, leukemia-propagating cells, and pre-LSCs, revealing a sig-nificant difference in chemosensitivity between normal cells and preleukemic/leukemic cells.
Primary human T-ALLs are sensitive to 2-ME2. Xenograft mod-els of human T-ALL mimic disease relapse (52) and represent a powerful preclinical tool to directly test drug efficacy on pri-mary leukemia cells in vivo (28). Purified leukemic blasts from 2 T-ALL patients (14H025 and 14H148; Supplemental Table 3) were transplanted and expanded into immunocompromised NOD.Cg-PrkdcscidIl2rgtmWjl/SzJ (referred to here as NSG) mice (Figure 7A) to
test their sensitivities to 2-ME2 both in vitro and in vivo.
In vitro, both patient samples were sensitive to 2-ME2 treat-ment in a dose-dependent manner but resistant to DEXA (Figure 7B). At the molecular level, patient 14H025 exhibited SIL-TAL1 chromosomal rearrangement and patient 14H148 did not (Supple-mental Figure 12A and Supple(Supple-mental Table 4). 2-ME2 treatment efficiently downregulated SCL protein levels in the SIL-TAL1 patient sample 14H025 (Figure 7C), associated with the inhibition of 2 SCL-dependent target genes, LYL1 and NKX3.1 (45) (Figure 7D, left panel). In contrast, LYL1 remained unaffected in the other patient sample, while NKX3.1 was decreased via an SCL-indepen-dent mechanism (Figure 7D, right panel). MYC protein expres-sion was detectable in both patient samples despite the absence of NOTCH1 mutations and of MYC rearrangement (Supplemental Table 4). Interestingly, MYC was decreased by 2-ME2 treatment in vitro in both patient samples (Figure 7C), associated with the inhi-bition of the well-established MYC target gene ODC (reviewed in ref. 53) (Figure 7D). These observations indicate that 2-ME2 inhib-its SCL and MYC functions in primary human T-ALL samples, as observed in the mouse model.
Finally, mice were transplanted and monitored for engraftment before treatment with 2-ME2 using osmotic minipumps (Figure 7E). Within 7 days, both samples engrafted in the BM with dissemina-tion in the spleen, and 14H148 engrafted in the peripheral blood as well (Supplemental Figure 12B). Strikingly, treatment with 2-ME2 downregulated SCL and MYC protein levels in vivo (Supplemen-tal Figure 12C) and prevented T-ALL progression by significantly reducing the leukemic burden in the BM, spleen (Figure 7F), and peripheral blood (Supplemental Figure 12B) of recipient mice.
Together, these results indicate that 2-ME2 exhibits antileuke-mic activity in primary human T-ALL blasts.
Discussion
In the present study, we bring evidence that pre-LSCs are more chemoresistant than leukemic blasts to conventional therapies because of their low proliferation rate. We developed a robust heterotypic assay for chemical screening of primary pre-LSCs in cell lines (Figure 5F and Supplemental Figure 9D). We therefore
examined the possibility that 2-ME2 affects SCL and MYC trans-lation. First we observed that the p70 ribosomal S6 kinase (S6K), a key downstream effector of mTORC1 signaling pathway (47), was active in all T-ALL cell lines (Figure 5G). Interestingly, 2-ME2 inhibits S6 phosphorylation in KOPTK1 and P12-ICHIKAWA and to a lesser extent in JURKAT cells (Figure 5G), indicating that 2-ME2 inhibits the mTORC1 pathway. Indeed, the translation of MYC mRNA was previously shown to be highly mTORC1-sensitive because of a long and structured 5′-UTR (48). By metabolic label-ing with 35S-methionine (Figure 5H and Supplemental Figure 9E),
we found that 2-ME2 strongly decreased MYC translation (Figure 5H, right panel). These results reveal an unsuspected mechanism of 2-ME2 in inhibiting MYC translation. Since SCL translation was not significantly affected by 2-ME2 (Figure 5H, left panel), we infer that MYC and SCL translation has differential dependence on mTORC1 signaling.
2-ME2 kills leukemic blasts without affecting viability of nor-mal HSPCs. We next showed that 2-ME2 inhibits SCL and MYC expression in fully transformed SCLtgLMO1tg leukemic blasts
(Figure 5I) and addressed the question of whether 2-ME2 might also inhibit primary SCLtgLMO1tg leukemic cells. Comparison of
the transcriptomes of murine SCL-LMO1–induced T-ALLs and of their normal counterparts points to the regulation of apoptosis as a top gene ontology category among SCL targets (Supplemental Figure 10A). We observed that 2-ME2 induced apoptosis in vitro both in pre-LSCs and in T-ALL blasts from SCLtgLMO1tg mice
(Supplemental Figure 10B), consistent with an inhibition of SCL antiapoptotic function (49–51).
To study the effect of 2-ME2 on T-ALL in vivo, primary SCLtg
LMO1tg T-ALL blasts were transplanted into 10 syngeneic mice
(Figure 6A). After engraftment (Supplemental Figure 10C), which was as rapid and homogenous as in Figure 1E, mice were treated with 2-ME2 via implantation of osmotic minipumps (40 mg/kg/d) (Figure 6A). Compared with control mice receiving the vehicle only, 2-ME2 induced a profound reduction of leukemic blasts in the BM, thymus, spleen, and peripheral blood (Figure 6, B and C) and altered their capacities to initiate leukemia in secondary recipients (Figure 6D). In contrast, the analysis of normal host (CD45.1+) T cell compartments indicated that 2-ME2 did not block
normal T cell differentiation in vivo (Supplemental Figure 11A), confirming our in vitro results (Supplemental Figure 4B). Despite high MYC levels in normal DN3 thymocytes, 2-ME2 did not affect MYC expression levels in these cells (Supplemental Figure 11B), concurring with their low sensitivities to 2-ME2 (Figure 3E). We therefore conclude that the SCL and LMO1 oncogenes sensitize DN3 cells to 2-ME2.
In parallel, we monitored how 2-ME2 affects residual normal stem/progenitor cells in the same mice. Host HSCs can be distin-guished from transplanted cells on the basis of CD45 isoforms, as shown in Figure 6A. 2-ME2 modifies neither the frequency (Figure 6B) nor the absolute numbers (Figure 6E) of host HSPCs as defined by their c-Kit+Sca-1+lineage– (KSL) phenotype in vivo,
contrasting with its dramatic effect on transplanted leukemic cells in the same mice. Moreover, 2-ME2–treated KSL cells retained proliferative and multilineage differentiation potentials when transplanted in secondary recipients (Figure 6F), indicating that
inhibitory effect on MYC. Concurring with the emerging role of MYC in AML (59, 60), perphenazine, the only phenothiazine hit in AML in the present study, was revealed as a top hit in a chemical screen for suppressors of MYC-induced T-ALL in zebrafish (35). Finally, the multiparametric screening assay described here could potentially allow for the identification of compounds that restore cell differentiation in T-ALL, as exemplified by the differentiation therapy achieved in acute promyelocytic leukemia (61).
The importance of regulated translation in T-ALL is under-scored by the finding of recurring loss-of-function mutations in several ribosomal genes, RPL5, RPL10, and RPL22, in 10%–20% of pediatric T-ALL (62). In addition, PTEN deletion occurs in 20% of T-ALL, causing increased AKT (63) and a hyperactive mTORC1 pathway. The translation of mRNA into polypeptide is mostly con-trolled at the level of translation initiation, which is partly regu-lated by the mTORC1 signaling pathway (47). While mTORC1 controls global protein synthesis, it preferentially stimulates the translation of selected groups of mRNAs that contain relatively long and structured 5′-UTRs, including MYC (47). Here, we show that 2-ME2 strongly alters MYC translation without modifying SCL translation. We thus conclude that MYC and SCL have dif-ferential dependence on the mTORC1 pathway. It remains to be determined whether this differential dependence could be impart-ed by the structure of their 5′-UTRs, as reportimpart-ed for MYC (47). In summary, our observations place MYC as a highly sensitive target hit of 2-ME2, downstream of the mTORC1 pathway. Finally, MYC is frequently dysregulated in tumors and represents a major target in cancer therapy (64). In addition to inhibiting MYC transcription or activity (65), our observations support the view that it is possible to target MYC translation.
SCL controls HSC self-renewal activity under stress (50, 66– 68), and is redundant with Lyl1 during steady-state hematopoiesis (69). In contrast, SCL activation in thymocytes occurs in a context whereby other self-renewal genes are absent and therefore pre-LSCs are “addicted” to SCL. Along the same line, Lyl1 upregula-tion by Lmo2 in DN3 thymocytes occurs in a context whereby Scl is not expressed, and therefore Lyl1 is required for Lmo2 repro-gramming activity (70). Similarly, Myc is critical for pre-LSC self-renewal activity (14, 56), whereas Myc is redundant in HSCs (71), indicating that targeting MYC will spare normal HSCs. Our results do not rule out the possibility that normal stem/progenitor cells express a 2-ME2–resistant isoform of tubulin, β1-tubulin, proposed
to protect patients from drug-induced myelosuppression (72). Nonetheless, we favor the idea that differential dependence on SCL and MYC levels distinguishes pre-LSCs from normal HSCs. Hence, decreasing SCL and MYC protein levels is synthetic lethal in pre-LSCs but not in HSCs that are endowed with a highly redun-dant self-renewal node.
Chemical biology combined with the capacity for HTS pro-vides unprecedented opportunities for drug discovery. Yet, despite the number of hits, there is currently a tendency for high drug attri-tion rates when it comes to efficacy in clinical trials (73). Without ruling out the possibility that many factors could contribute to this high attrition rate, our results suggest that cell line–based screen-ing as well as 2-dimensional screenscreen-ing assays may not yield much-needed novel bioactive compounds. While these assays have been useful in identifying anticancer drugs, it is well known that cell an ex vivo assay mimicking a thymic-like microenvironment, and
demonstrated the feasibility of this strategy for HTS. This strategy led us to identify an inhibitor that targets 2 central actors of the self-renewal node in pre-LSCs, SCL and MYC (14).
The development of new drugs targeting self-renewing (pre) cancer stem cells could open new therapeutic opportunities for more selective treatments (6). In T-ALL, leukemic stem cells are capable of sustained leukemia propagation. Nonetheless, these cells are endowed with an evolving genetic landscape, carrying founder mutations as well as varying secondary mutations (24, 52). In contrast, the emergence of self-renewing pre-LSCs via oncogene-induced reprogramming of normal thymocytes repre-sents the earliest events in T-ALL (10, 12, 14) and in B cell acute lymphoblastic leukemia (7). Therefore, pre-LSCs represent the prime cellular target for novel drug development. In AML, these cells are believed to harbor landscaping mutations that remain stable in remission and relapse (4). These molecular studies also suggested that the cells that caused relapse are preleukemic HSCs that do not have the full complement of transforming events. Obviously, these cells must have escaped therapy (4). Nonethe-less, direct evidence for differential chemosensitivity between pre-LSCs and leukemic blasts was hindered by the extreme rarity of these cells within the tumor bulk, as we now show that pre-LSCs are rapidly offset by more competitive, fully transformed leukemic blasts. We took advantage of the mouse model that recapitulates the evolution of the human disease to demonstrate that pre-LSCs are less sensitive than leukemic blasts to drugs that target prolifer-ating cells, such as topoisomerase inhibitors, because of their low proliferative status. Similarly, leukemic blasts and pre-LSCs also exhibit differential sensitivities to radiation (54).
Our previous work indicates that self-renewing pre-LSCs depend both on the primary oncogenes and on the physiologi-cal NOTCH1 pathway activated by the microenvironment (14). Interestingly, 2-ME2 specifically prevents SCL accumulation via a colchicine-independent mechanism, which differs from the col-chicine-sensitive transport of HIF-1α into the nucleus via microtu-bules (36). Moreover, 2-ME2 also decreased MYC protein levels, resulting in decreased expression of a prototypic MYC target gene, ODC. Based on our previous finding that MYC can substitute for NOTCH1 signaling to collaborate with SCL-LMO1 in thymocyte reprogramming (14), we conclude that 2-ME2 inhibits pre-LSCs by antagonizing their dependence on both SCL and the DL4-NOTCH1 pathway. Moreover, we showed that 2-ME2 inhibits SCL and MYC targets in primary human T-ALL blasts and prevents their growth in a preclinical model of T-ALL.
Interestingly, gain of function of NOTCH1 is the most frequent genetic alteration in T-ALL that can be found in all molecular sub-groups, defined by SCL/TAL1, LMO2, TLX1/3, HOXA, and MYB (9, 26, 55). Given the necessary collaboration of NOTCH1-MYC with SCL-LMO1 in self-renewing pre-LSCs (14) and the importance of NOTCH1-MYC in T-ALL (56, 57), we surmise that inhibiting MYC could be lethal in other molecular T-ALL subgroups. In addition, inhibition of the NOTCH signaling pathway can antagonize gluco-corticoid resistance, an adverse prognostic factor in ALL (58). We propose that 2-ME2 will be beneficial for the treatment of gluco-corticoid-resistant primary or relapsed human T-ALL. In addition, 2-ME2 may be of interest in AML treatment as well because of its
The Journal of Clinical Investigation
R E S E A R C H A R T I C L EAPC–anti-CD8, PE-Cy7–anti-CD25, and AF780–anti-CD44 at 4°C for 15 minutes. The screen was then performed with an LSRII flow cytom-eter equipped with an HTS module (BD Biosciences).
FACS analysis and cell sorting. Immunostaining was done as
previ-ously described (33). Dead cells were excluded by propidium iodide staining. Immunophenotype and apoptosis analysis was performed on an LSRII cytometer using DIVA (BD Biosciences) software. Cell sort-ing was done ussort-ing an FACSAria cytometer (BD Biosciences).
Congenic transplantation assay. Preleukemic thymocytes from
donor mice (CD45.2+) were transplanted in i.v. into sublethally
irradi-ated (600 cGy) recipient mice (CD45.1+) (14). Thymic chimerism in
the T lineage (Thy1.2+) was analyzed by flow cytometry (FACS) and
illustrated by the percentage of donor-derived cells (% CD45.2+)
found in the recipient thymus.
In vivo study of the effect of 2-ME2 on T-ALL development and HSC functions. T-ALL blasts (CD45.2+) from primary SCLtgLMO1tg
thymo-ma were injected i.v. into 10 sublethally irradiated CD45.1+ recipient
mice (5 × 10⁶ blasts per mouse). T-ALL reconstitution was assessed
by FACS after BM aspiration, and mice were randomly selected for treatment with vehicle alone (50% DMSO; 50% PEG400) or 2-ME2 (Bosche Scientific, M19071; 40 mg/kg/d). Osmotic minipumps (Alzet model 2001; 1 μl/h, 7 days) containing vehicle or 2-ME2 were loaded and primed at 37°C in 0.9% NaCl, 24 hours before their subcutane-ous implantation, in accordance with the manufacturer’s instructions. T-ALL reconstitution was monitored in the thymus, BM, spleen, and blood, and engrafted T-ALL blasts from the BM were transplanted into secondary sublethally irradiated CD45.1+ mice. c-Kit+Sca-1+lineage–
(KSL) cells from the BM of treated CD45.1+ mice were transplanted
into secondary lethally irradiated CD45.2+ mice in parallel.
Xenogenic transplantation assay. T-ALL patient samples were
selected for high blast counts (>90%) in the peripheral blood. T-ALL blasts were immunophenotyped using FITC–anti-hCD45, PE–anti-hCD7, PE-Cy7–anti-hCD4, PE-Cy5–anti-hCD8, and APC–anti-hCD34. Normal peripheral CD34+CD7– hematopoietic progenitors
and mature CD4+/hi and CD8+/hi single-positive T cells (28) were
excluded by cell sorting, and T-ALL blasts were transplanted and expanded by transplantation into sublethally irradiated (250 cGy) 8- to 12-week-old NOD-Scid IL2rgnull mice (NSG, Jackson Laboratory).
Engrafted T-ALL blasts were collected from the spleen and the BM 6–8 weeks after transplantation.
T-ALL blasts (CD45+CD7+) from primary NSG mice engrafted with
each patient sample were injected i.v. into 10 secondary NSG mice (5 × 10⁶ blasts per mouse). T-ALL reconstitution was assessed by FACS after
BM aspiration, and mice were randomly selected for treatment with the vehicle or 2-ME2 using osmotic minipumps as described above.
Limiting dilution assays. Preleukemic thymocytes were
transplant-ed into irradiattransplant-ed hosts at various cell doses. Mice were scortransplant-ed positive when T cell lineage reconstitution was more than 0.1% in the thymus. Pre-LSCs frequencies (range pre-LSC ± CI), also named competitive repopulating unit frequencies, were calculated by application of Pois-son statistics using Limiting Dilution Analysis software (Stem Cell Technologies) (66).
Metabolic radiolabeling with 35S-methionine and immunopre-cipitation. 4 × 10⁷ JURKAT cells (106 cells/ml) were incubated
overnight at 37°C, washed twice with 50 ml of l-methionine–free DMEM (Wisent Inc., 319-045-CL), and pretreated or not (DMSO) with 2-ME2 (3 μM) for 30 minutes. Cells were then centrifuged to
fate is shaped by the local niche. It is therefore not surprising that the niche may also modify the chemosensitivity of primary leu-kemic blasts (74). Our strategy led to the identification of a drug that inhibits both cell-autonomous and non–cell-autonomous pathways, acting in vitro and in vivo, while sparing normal HSCs. We propose that recapitulating tissue-like conditions (75–77) rep-resents a promising avenue in the quest for new cancer therapies in other tumors.
Methods
Supplemental Methods are available online with this article; doi:10.1172/JCI86489DS1.
Human leukemia samples and cell lines. All AML and T-ALL samples
were collected from the Maisonneuve-Rosemont Hospital of Montre-al, Canada. Human JURKAT, KOPTK1, P12-ICHIKAWA, and HPB-ALL cell lines were obtained from DSMZ, Germany.
Mice and ethics statement. All animals were maintained in
pathogen-free conditions. The current study was performed using previously described SIL-SCL (referred to as SCLtg) and Lck-LMO1
(referred to as LMO1tg) mice (15, 16, 33). All mouse lines were
back-crossed onto a C57BL6/J background for more than 12 generations. Mice cohorts were generated by cross-breeding, and their genotypes were verified by PCR.
Generation of MS5-DL4 stromal cell lines. Mouse stromal MS5 cells
than can maintain in vitro both mouse and human long-term hema-topoiesis were from K. Mori (Nagata University, Japan) (78) and were maintained as described previously (30). VSV-G–producing cells transfected with the human DLL4 cDNA (MHS4426-98361330, GE Healthcare) were used for gene transduction in MS5 cells (48 hours) as described previously (50, 66). Transduced MS5 cells were stained using rabbit anti-DLL4 (ab7280, Abcam), and 3 MS5 stromal cell lines were generated by cell sorting according to 3 levels of DL4 expression (low, medium, and high). Staining with the secondary antibody only was used for negative controls.
Chemical screen of small molecules on pre-LSCs. MS5-DL4
stro-mal cells (2 × 10³ per 40 μl per well) were seeded in 384-well plates
in complete T cell medium described in the Supplemental Methods. Twenty-four hours later, DN thymocytes from thymi of 3-week-old preleukemic SCLtgLMO1tg mice were prepared by depletion of CD4+
and CD8+ thymocytes through immunomagnetic bead cell separation
as previously described (66). DN3 (pre-LSC) thymocytes (5 × 10³ per
5 μl per well) were then purified and cocultured on seeded MS5-DL4 stromal cells by cell sorting. Twenty-four hours later, cocultured pre-LSCs were exposed to 1,904 individual FDA-approved and drug-like small molecules (Preswick; Biomol; Lopac/Sigma-Aldrich; Micro-Source Discovery Systems) at a dose of 500 nM. Absolute numbers of DN3 cells were determined after 5 days of culture using flow cytom-etry. In each plate, 16 wells containing pre-LSCs were treated with 1 μM γ-secretase inhibitor (GSI) and 16 wells were treated with DMSO (vehicle) as positive and negative controls, respectively (Supplemen-tal Figure 2). The inhibition (percentage) of pre-LSC viability by indi-vidual compounds was calculated based on the absolute numbers of cells in the DN3 gate (Thy1+CD4–CD8–CD25+CD44–) recovered from
3 different treatment conditions according to the formula 100 – ((test compound – median GSI) / (median vehicle – median GSI) × 100).
Pre-LSCs were stained by addition of 5 μl/well of PBS supple-mented with 2% FBS containing PE–anti-Thy1.2, PE-Cy5–anti-CD4,
1. Ishikawa F, et al. Chemotherapy-resistant human AML stem cells home to and engraft within the bone-marrow endosteal region. Nat Biotechnol. 2007;25(11):1315–1321.
2. McMillin DW, et al. Tumor cell-specific biolumi-nescence platform to identify stroma-induced changes to anticancer drug activity. Nat Med. 2010;16(4):483–489.
3. Lane SW, Scadden DT, Gilliland DG. The leukemic stem cell niche: current concepts and therapeutic opportunities. Blood. 2009;114(6):1150–1157. 4. Corces-Zimmerman MR, Hong WJ, Weissman
IL, Medeiros BC, Majeti R. Preleukemic
muta-tions in human acute myeloid leukemia affect epigenetic regulators and persist in remission.
Proc Natl Acad Sci U S A. 2014;111(7):2548–2553.
5. Shlush LI, et al. Identification of pre-leukaemic haematopoietic stem cells in acute leukaemia.
Nature. 2014;506(7488):328–333.
6. Durinck K, et al. Novel biological insights in T-cell acute lymphoblastic leukemia. Exp
Hema-tol. 2015;43(8):625–639.
7. Hong D, et al. Initiating and cancer-propagating cells in TEL-AML1-associated childhood leuke-mia. Science. 2008;319(5861):336–339. 8. Ferrando AA, et al. Gene expression signatures
define novel oncogenic pathways in T cell acute lymphoblastic leukemia. Cancer Cell. 2002;1(1):75–87.
9. Van Vlierberghe P, Pieters R, Beverloo HB, Mei-jerink JP. Molecular-genetic insights in paediatric T-cell acute lymphoblastic leukaemia. Br J
Hae-matol. 2008;143(2):153–168.
10. Hoang T. Of mice and men: how an oncogene transgresses the limits and predisposes to T cell acute lymphoblastic leukemia. Sci Transl Med. 2010;2(21):21ps10.
11. Krivtsov AV, et al. Transformation from commit-ted progenitor to leukaemia stem cell initiacommit-ted by
human cells. BG and TH interpreted the data and wrote the manuscript. All authors contributed to the final draft.
Acknowledgments
We thank Danièle Mathieu (INSERM, Marseille, France) for the anti-SCL antibody, Adolfo Ferrando (Colombia University, New York, New York, USA) for the human T-ALL cell lines, Danièle Gagné and Gael Dulude for assistance with flow cytometry, Valérie Villeneuve for sequencing, and Jean Duchaine for HTS and for the chemical library. Clinical specimens were collected and analyzed by the Banque de Cellules Leucémiques du Québec, supported by the Cancer Research Network of the Fonds de Recherche du Québec en Santé (FRQS). The Institute for Research in Immunology and Can-cer is supported in part by the Canada Foundation for Innovation and the FRQS. This work was funded by grants from the Canadian Institutes for Health Research (CIHR) and the Canadian Cancer Society Research Institute (to TH, PR, BK, and GS); the Leukemia Lymphoma Society of Canada, the Cancer Research Society Inc., and the Programme de soutien à la recherche (PSR), volet Soutien à des initiatives internationales de recherche et d’innovation (SIIRI), Ministère de l’Économie, de la Science et de l’Innovation–Québec (to TH); “Fonds de partenariat pour un Québec innovant et en santé” and the Institute for Research in Immunology and Cancer–Commer-cialization of Research (to TH); the Canada Research Chair program (to PR and GS); the Industrielle-Alliance research chair in leukemia at Université de Montréal (to JH); and fellowships from the Cole Foundation (to BG and DFTV), the CIHR (to EO), and the FRQS (to BG). The funders had no role in study design, data collection and analysis, decision to publish, or preparation of the manuscript. Address correspondence to: Trang Hoang, Institute for Research in Immunology and Cancer (IRIC), University of Montréal, PO Box 6128, Downtown Station, Montréal, Québec, Canada H3C 3J7. Phone: 514.343.6970; E-mail: [email protected]. DFTV’s present address is: Jackson Laboratory for Genomic Medi-cine, Farmington, Connecticut, USA.
MT’s present address is: McGill Cancer Center, Montreal, Quebec, Canada.
MK’s present address is: Department of Pharmaceutical Sciences, Faculty of Pharmacy, University of Toronto, Toronto, Ontario, Canada.
remove the supernatant, resuspended in fresh l-methionine–free DMEM containing 1.75 mCi of 35S-methionine (PerkinElmer), and
incubated for 3 hours in the presence or absence (DMSO) of 2-ME2 (3 μM). JURKAT cells were washed 3 times with ice-cold PBS and harvested in 600 μl lysis buffer (10 mM K3PO4, 1 mM EDTA, 5 mM EGTA, 10 mM MgCl2, 50 mM β-glycerophosphate, 0.5% Nonidet P-40, 0.1% Brij 35, 0.1% deoxycholic acid, 1 mM sodium orthovan-adate [Na3VO4], 1 mM PMSF, and a Complete Protease Inhibitor Mixture tablet [Roche]). For immunoprecipitations, cell lysates were incubated with the SCL/TAL1 (C-21) sc-12984 goat polyclonal antibody or with the c-MYC (9E10) sc-40 mouse monoclonal anti-body for 2 hours, followed by a 1-hour incubation with protein A– Sepharose CL-4B beads (GE Healthcare). Immunoglobulins from goat (Sigma-Aldrich, I-9140) and mouse (Sigma-Aldrich, I-8765) serum were used as control for the immunoprecipitation. Immu-noprecipitates were washed 3 times in lysis buffer, and beads were eluted and boiled in 2× reducing sample buffer (125 mM Tris-HCl [pH 6.8], 20% [vol/vol] glycerol, 4% [wt/vol] SDS, 6.2% DTT, and 0.1% bromophenol blue). Immunoblotting was performed using a submersible transfer apparatus and polyvinylidene fluoride mem-brane. Radiolabeling was revealed using a PhosphorImager (GE Healthcare Life Science).
Statistics. Z′ value was calculated according to the formula 1 – [3 × (SD
of positive control + SD of negative control)/(mean of positive control – mean of negative control)]. The theoretical maximum value for the Z′ fac-tor is 1, and ideally the Z′ facfac-tor is between 0.5 and 1.
We performed statistical analyses by Student’s t test (*P ≤ 0.05, **P ≤ 0.01, ***P ≤ 0.001). We assumed normality and equal distribu-tion of variance between the different groups analyzed. Survival in mouse experiments was represented with Kaplan-Meier curves, and significance was estimated with log-rank test (GraphPad Prism).
Study approval. All AML and T-ALL samples were collected with
informed consent according to procedures of the Banque de Cel-lules Leucémiques du Québec, and the project was approved by the Research Ethics Boards of Maisonneuve-Rosemont Hospital and the University of Montreal. All animals were maintained in pathogen-free conditions according to institutional animal care and guidelines set by the Canadian Council on Animal Care.
Author contributions
BG, PSM, BHK, and TH designed the study. BG, DFTV, SN, IF, JO, GL, JR, JK, MT, EO, MK, VL, AH, and DG performed exper-iments. BG, DFTV, PSM, AM, PPR, BHK, and TH analyzed data. JH, JC and GS contributed to experiments with primary